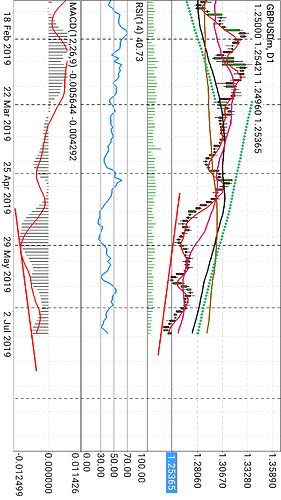
The GBP/USD chart is indicating that a trend reversal the downward trend hit rock bottom on Tuesday as price closed at 1.24401. The price closed below the 5 SMA (red), 20 SMA (pink), 60 SMA (black) and 100 SMA (brown). The RSI indicator hit 30 although it did not go into the oversold area but the 30 acted as a support as it held steady and on Wednesday price closed at 1.24977 and moved up to 40 on the RSI. Now the real deal here is if you look at the MACD, it is indicating that higher lows are being formed while price action shows that lower lows are being formed which is indicative of a bullish divergence, that is price is reversing from the downtrend. News from Fed’s Powell speech to congress and the FOMC minutes of meeting suggesting that the FED will go dovish with rate cut as a 25points rate cut is supported by the FOMC. Further news to confirm the trend should be waited on as the US releases the CPI and FED delivers another speech today. Keep your ears sharp and your eyes open for the 1D chart suggestion for going long wait till price closes beyond the 20SARA and the RSI is above 50. Don’t mind the Parabolic SAR for now it is still showing a bearish market.
