Pound Sterling declined against a basket of currencies last week after a series of negative news. First of all, Bank of England (BOE) decided to increase quantitative easing by £100BN, putting pressure to Pound Sterling. Secondly, the deadlock in EU and UK trade negotiations over Brexit would likely persist until the year-end. Then finally, Bank of England does not rule out negative interest rate and likely to consider it in 2H20.
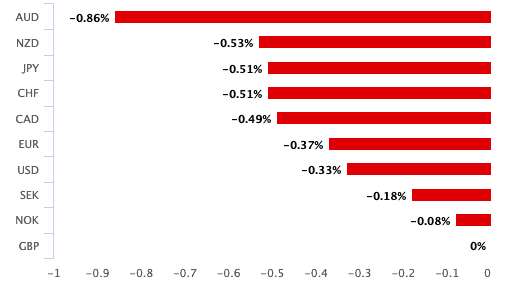
UK economy has been battered by the Covid-19 pandemic. A very negative economic growth and the uncertainty over Brexit can limit the strength in GBP this year. Below is the currency’s performance against other world currencies last week.
EURGBP Weekly Elliott Wave Chart
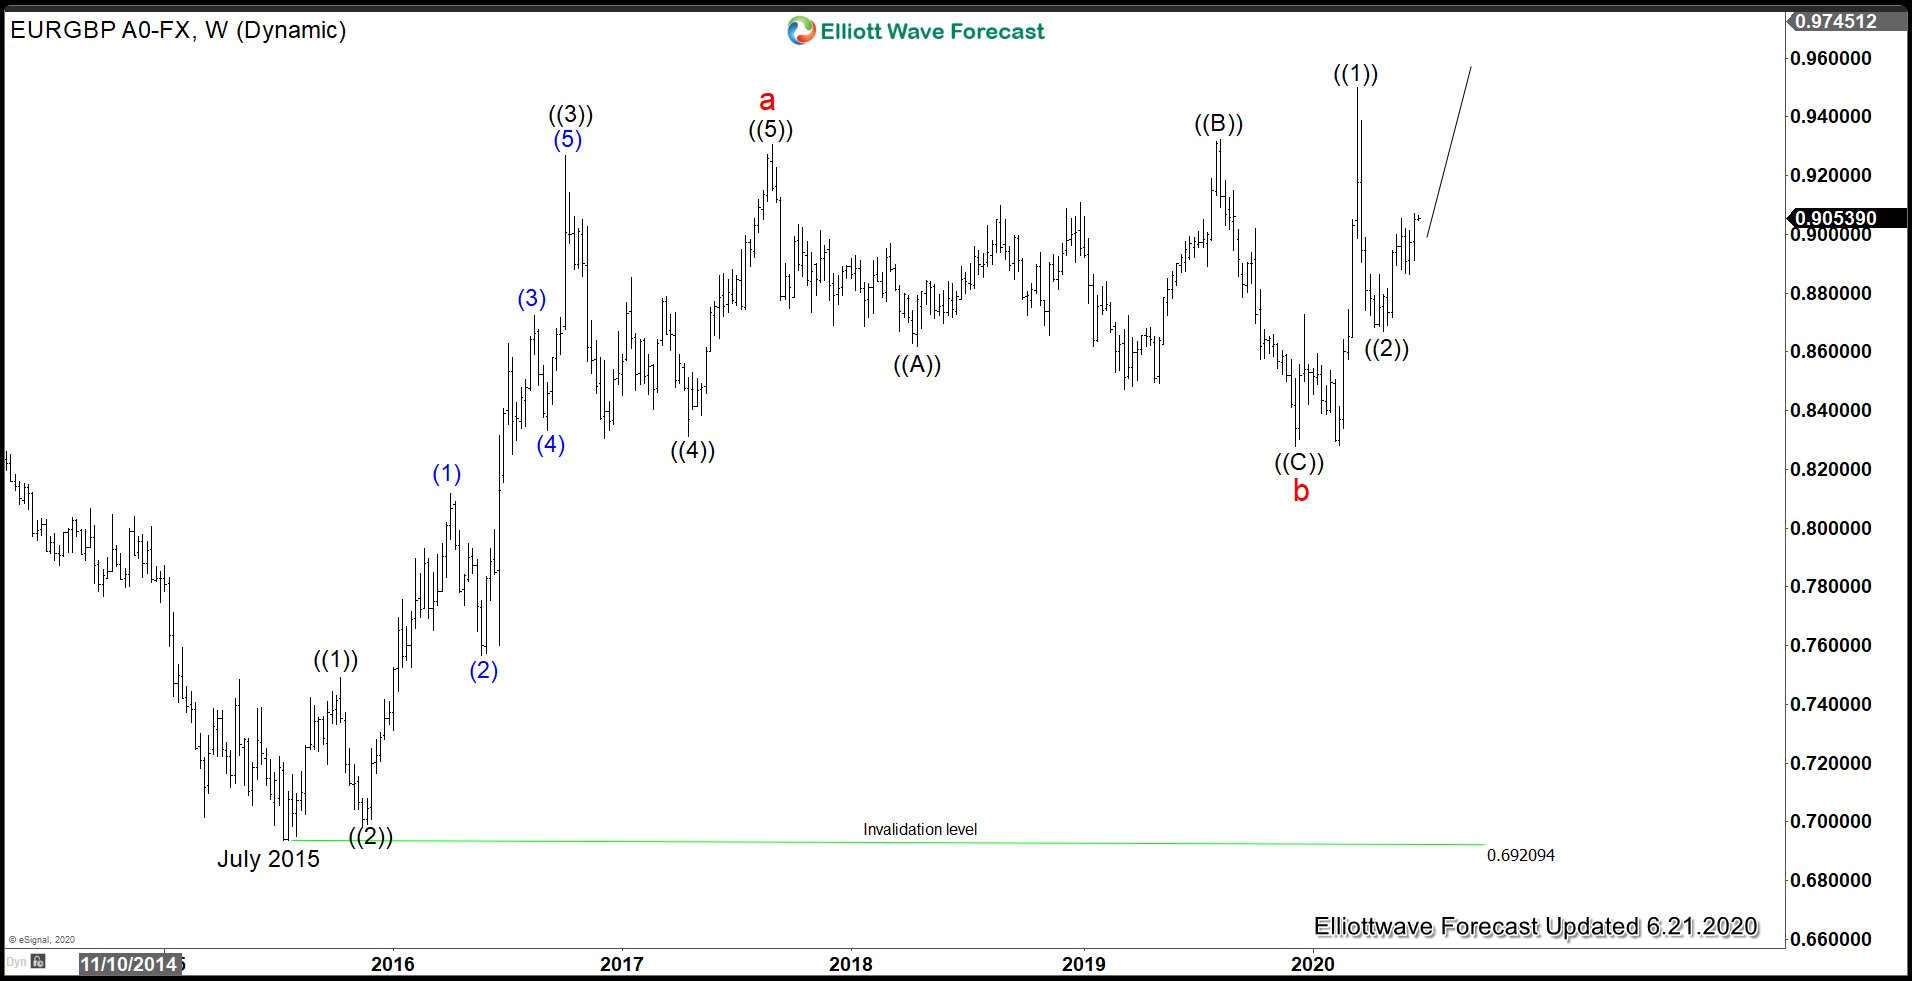
$EURGBP weekly chart above shows an incomplete sequence from July 2015 low favoring more upside. The rally is proposed to be unfolding as a zigzag Elliott Wave structure. Up from July 2015 low, wave a ended at 0.9306 as 5 waves impulse structure. From there, wave b pullback ended a t0.8277 as an expanded flat structure where wave ((A)) ended at 0.862, wave ((B)) ended at 0.9324, and wave (©) ended at 0.8277. Pair has since resumed higher and broken above previous wave ((B)) high suggesting wave c has started. Up from wave ((B)) low, wave ((1)) ended at 0.9499 and wave ((2)) is proposed complete at 0.8671. Pair now still needs to break above wave ((1)) at 0.9499 to avoid a double correction.
EURGBP 4 Hour Elliott Wave Chart
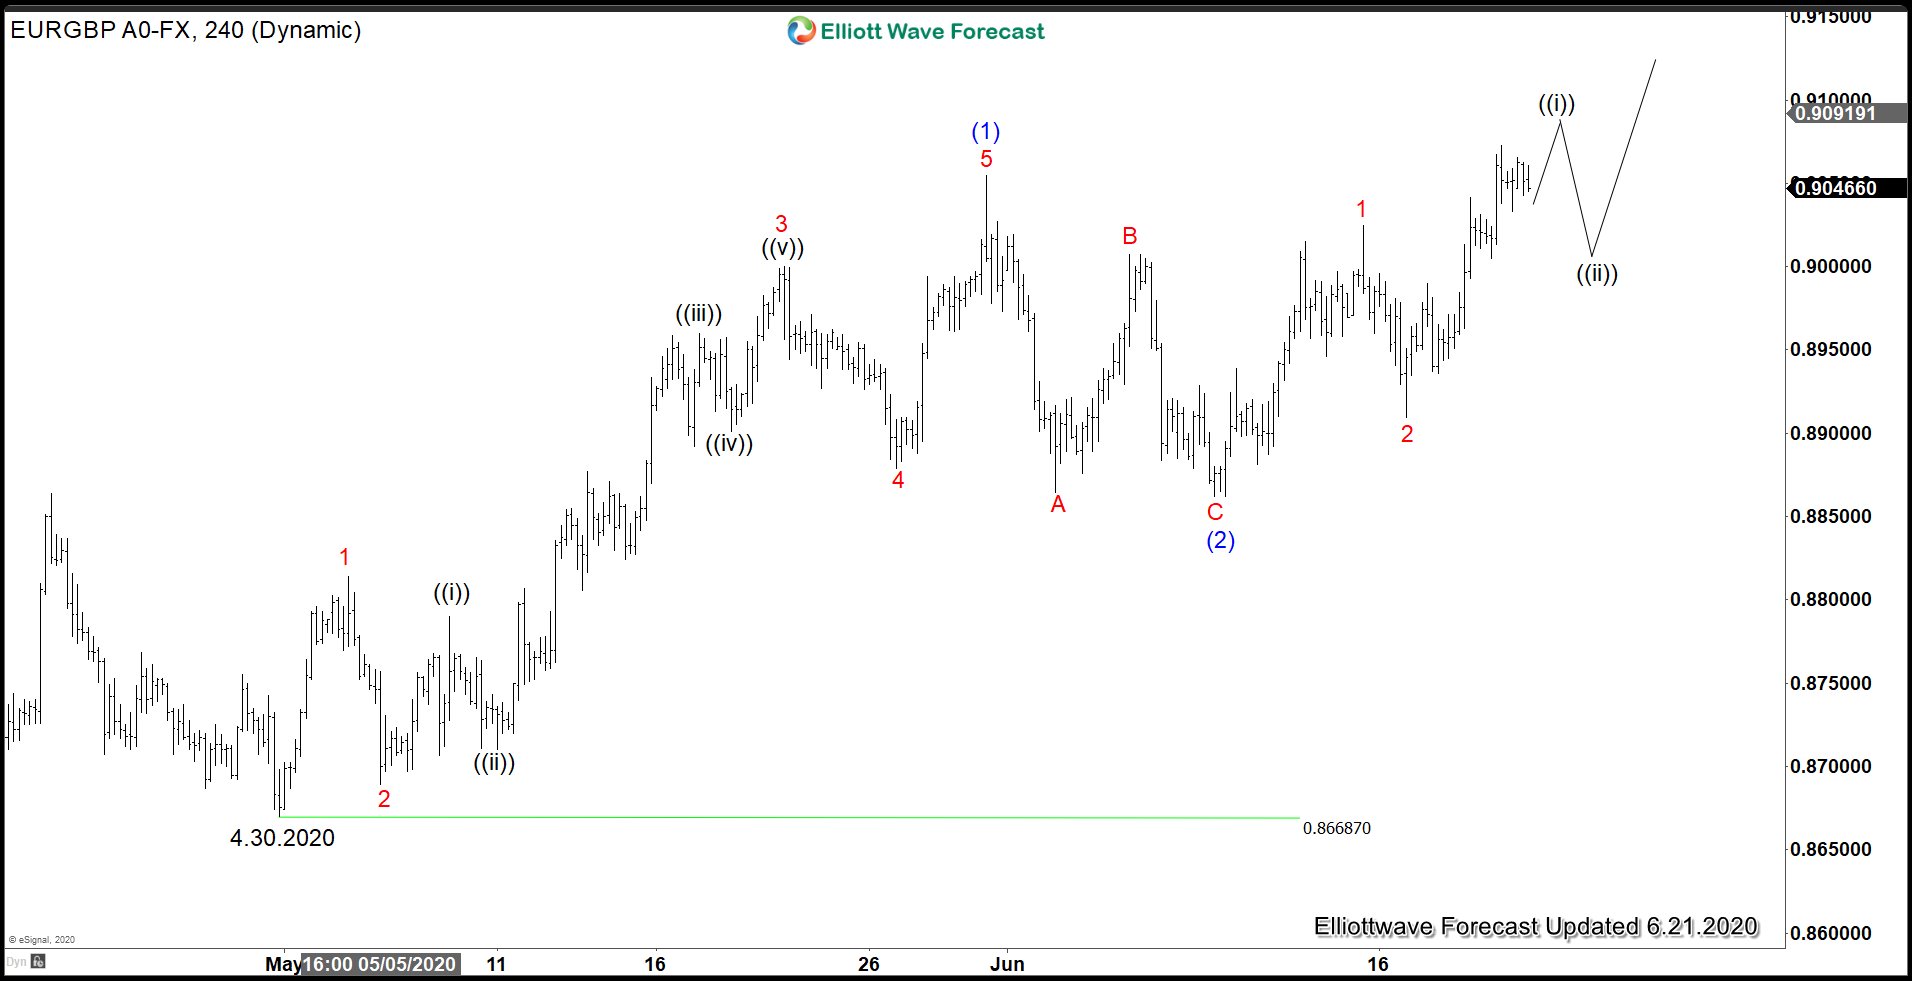
4 hour chart of EURGBP above shows the pair also has a bullish sequence from 4.30.2020 low favoring more upside. Up from 4.30.2020 low, the rally ended wave (1) at 0.9054, and pullback in wave (2) ended at 0.8862. Pair has since broken above wave (1) at 0.9054, suggesting the next leg higher has started. Near term, dips should see support in 3, 7, or 11 swing against wave (2) low at 0.8862.