Earlier this week, news came out that a vaccine from Pfizer and BionTech has a 90% effectiveness. It triggered a big rally in the market on Monday. The U.S. and Europe are now still struggling with a new wave of Covid-19 infection with potential lockdown measures. There’s no question that people need to brace for social and economic pain in the short term due to the restrictive measures. However, we can look forward to mass vaccination in 2021 to finally bring life back to normal.
The tech sector which has outperformed others during the pandemic now start to see a rotation to other sectors. One World Index which sees a breakout is the Eurostoxx 50, a stock index primarily dominated by France and Germany’s stocks. The Index manages to break above July 21 high (3451). This suggests that further upside is likely.
Mass vaccination should help social and economic life around the world return to normal and that’s what everyone wants. However, what market has not fully realized at this stage is that this in turns reduces the need for more monetary and fiscal stimulus. If the most important driver supporting the market is taken off or reduced, it will be interesting to see the market’s reaction down the road after the early optimism fades.
Eurostoxx 4 Hour Elliott Wave Chart
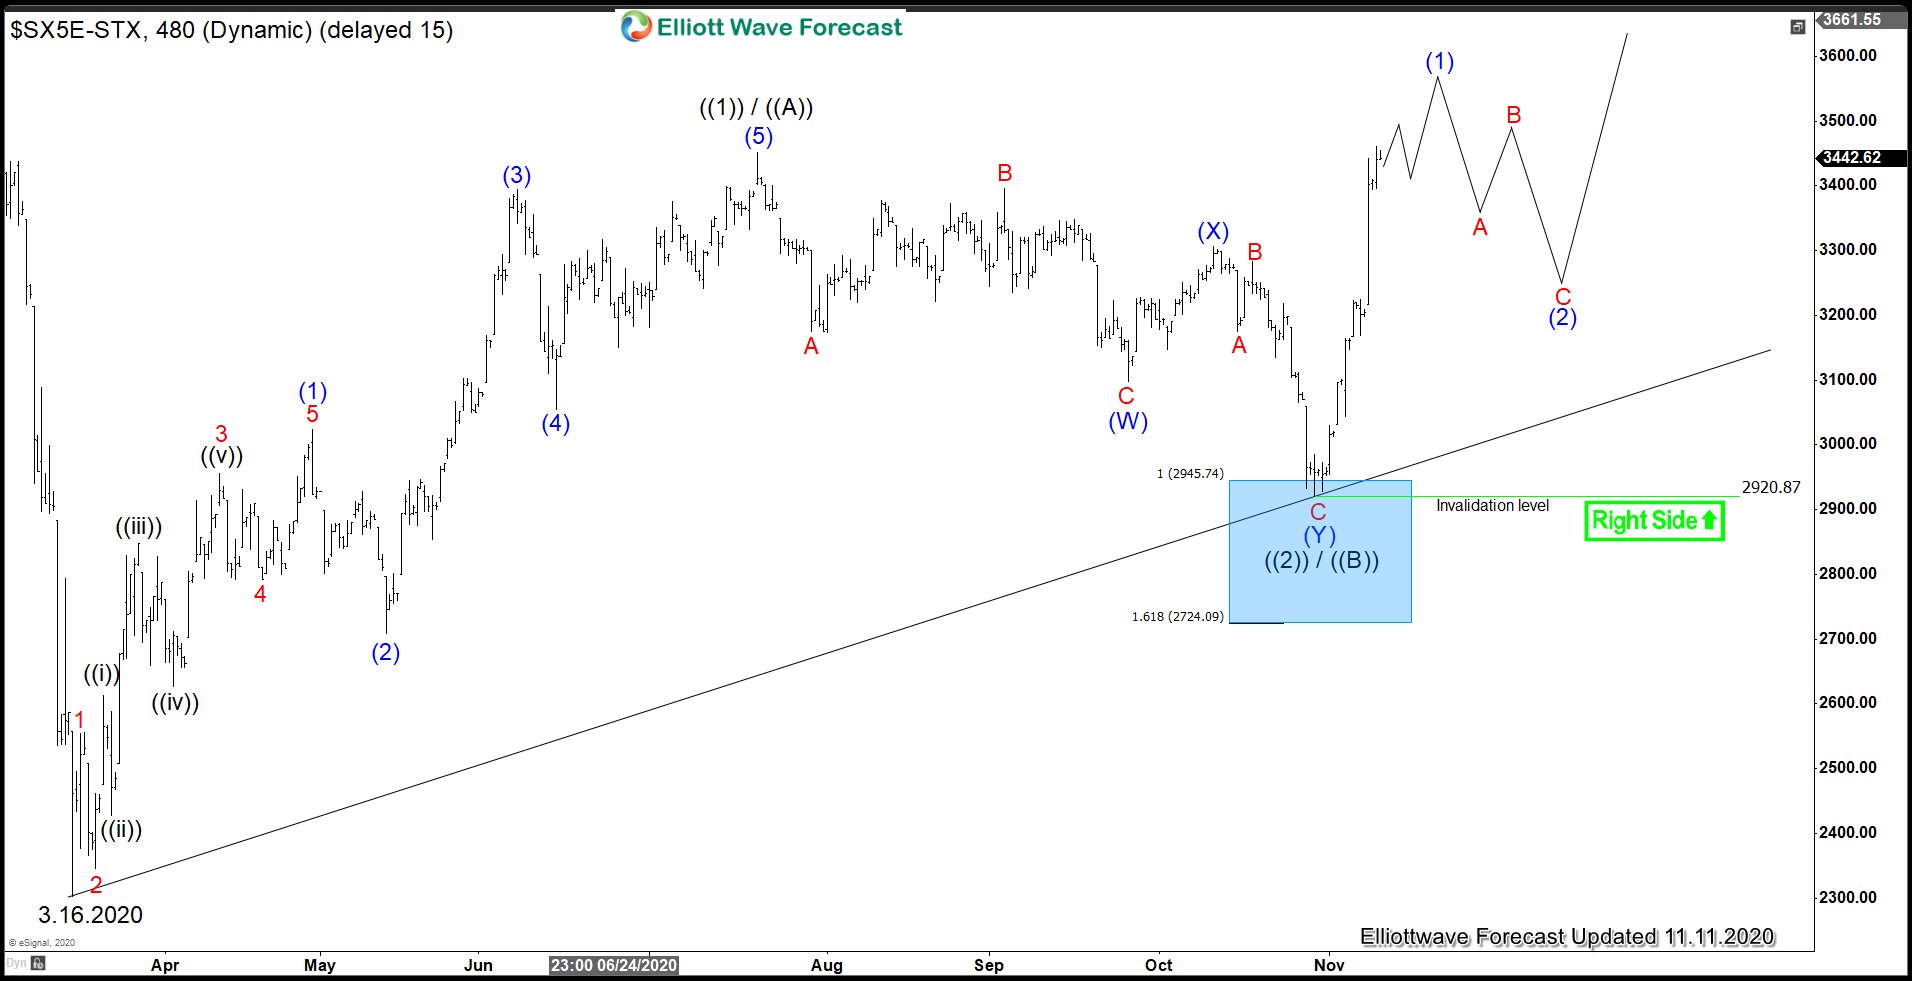
Eurostoxx 50 (SX5E) 4 hour Elliott Wave chart above shows the Index ended the correction on March 16 low (2302). It has now broken above its previous high wave ((1)) / ((A)) at 3451. This suggests that the Index more likely sees further upside. The rally can either unfold as an impulse in which case the current rally can extend in wave ((3)). Alternatively, it can be in wave (©). Regardless, the typical extension for the third leg of the rally is 100%-123.6% of the first leg higher. This suggests a potential target of 4070 - 4341 area while dips continue to stay above wave ((2)) / ((B)) low at 2920.87. Alternatively, if Index fails to get a follow through to the upside, we can have a truncated ((A))-((B))-(©) rally. If the Index turns lower and breaks below the ascending trend line drawn from 3.16.2020 low, that could be an early indication that a truncation might occur.