CAC40 is a French stock market index representing a capitalization-weighted measure of the 40 most significant stocks on the Euronext Paris; the ticker is $PX1. The drop in indices in February-March 2020 which many still relate to COVID-19 events has marked most probably a significant low in world indices. It seems like CAC40 has also found its bottom on march lows at 3622.5 and is now looking higher.
CAC40 Weekly Elliott Wave Analysis 07.08.2020
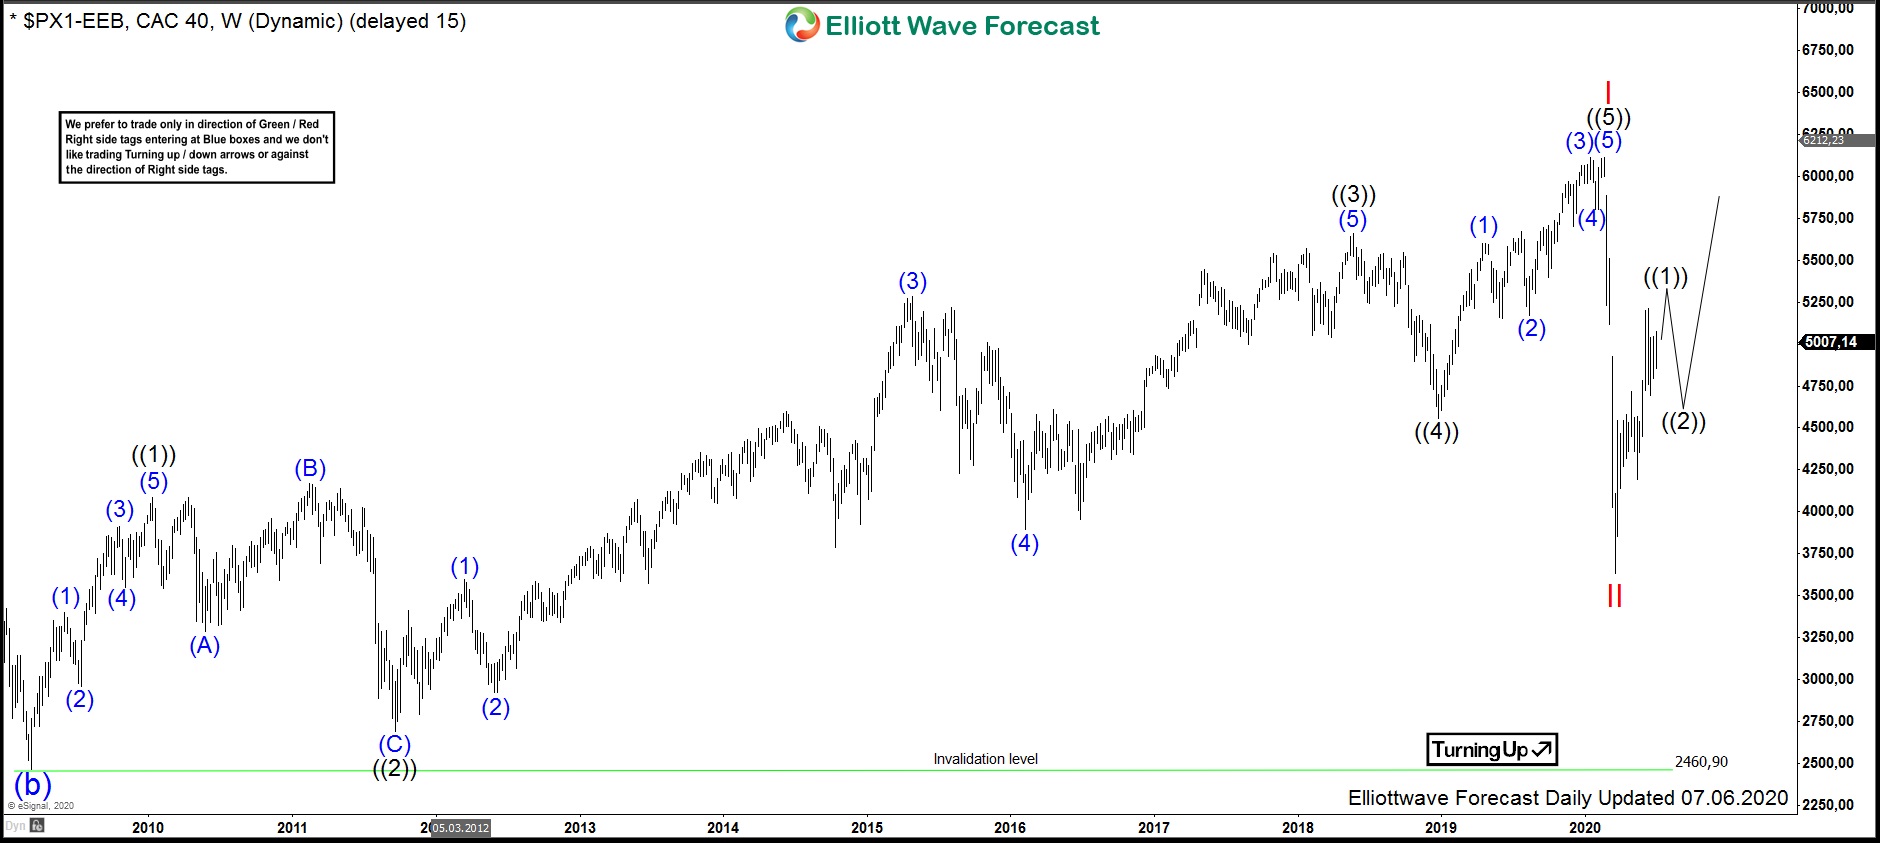
The weekly chart below shows the CAC40 index $PX1 listed at Euronext. From the march 2009 lows at 2460.9, the stock price has developed a cycle higher in wave I of a cycle degree. It has ended by printing a high in February 2020 at 6111.4. Hereby, the overall move higher is an impulse. Within the wave I, the internal waves ((1)), ((3)) and ((5)) themselves are also impulses consisting of 5 motive subwaves (1), (3) and (5) each. The wave ((3)) of I shows an extension which occurs frequently within 3rd waves of impulsive moves.
From February 2020 highs at 6111.4, a sharp corection lower in wave II has retraced a respectable part of the motive cycle higher towards March lows at 3622.5. Technically speaking, the decline can be seen as an Elliott Wave zigzag correction. As a consequence, after a corrective move, the trend may resume which is pointing without any doubt to the upside. While above 3622.5, CAC40 might be now in development of the wave ((1)) of III to the upside.
CAC40 Daily Elliott Wave Analysis 07.08.2020
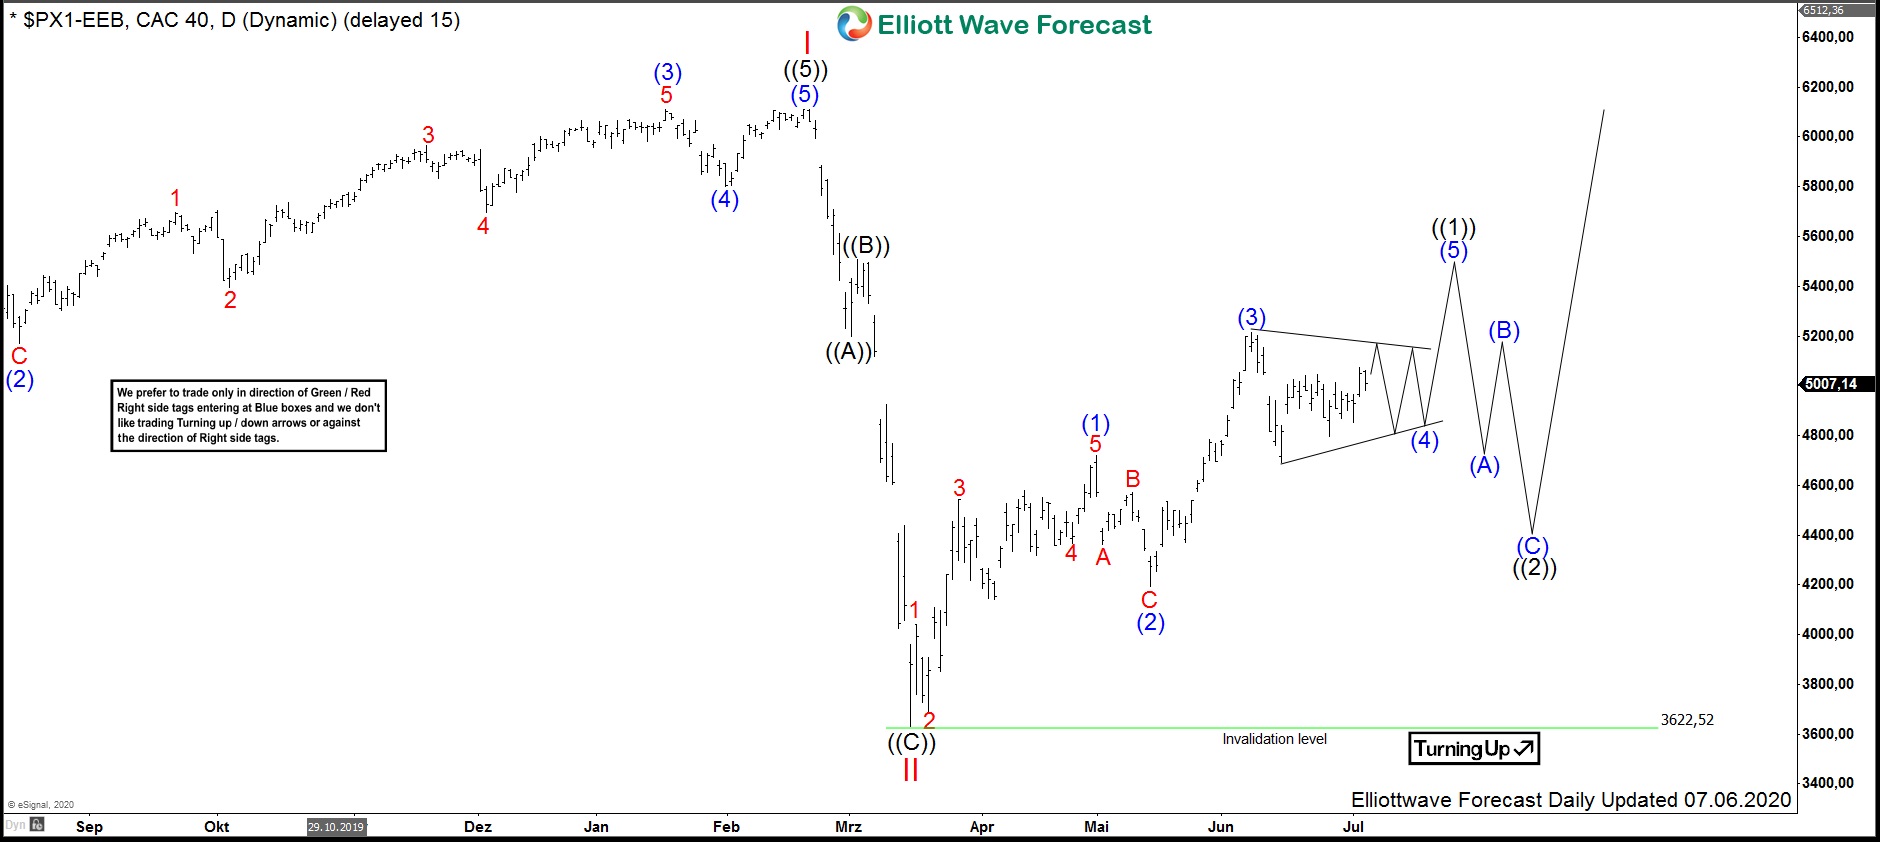
The daily chart below shows in more detail the zigzag lower as wave II. Also, it demonstrates clearly the subdivisions of the March cycle higher in black wave ((1)). Hereby, blue subwaves (1)-(3) of ((1)) might have ended and the wave (4) is currently retracing part of the rise. The wave (4) by nature can unfold different Elliott wave patterns. Among them are zigzags, flats, double and tripple corrections as well as triangles. Here, one can see a corrective pattern in form of a converging triangle. Still, a double corection lower can take place. Also, a more bullish scenario can not be excluded. Within that view, wave (4) has already ended and wave (5) does multiple nests. Therefore, acceleration higher can happen.
From current levels, we are looking in general to the upside. Another push higher will probably end the march cycle in wave ((1)). After an advance in 5 waves, a pullback in 3 waves follows. So, CAC40 may soon peak in wave ((1)), consolidate thereafter in wave ((2)) lower and start another leg higher in wave ((3)) to new highs.
As a consequence, contrary to the social mood and economical expectations, CAC40 has found most probably its multi-year low in march 2020 at 3622.5. The index is currently resuming a rally. Alternatively, it should do after a pullback another leg higher at least.