CADJPY Technical Analysis
On March 4/2020 I posted on social media (Stocktwits/Twitter) @AidanFX “$CADJPY Break below 79.88 and I’m selling … lets see if we see any downside momentum”
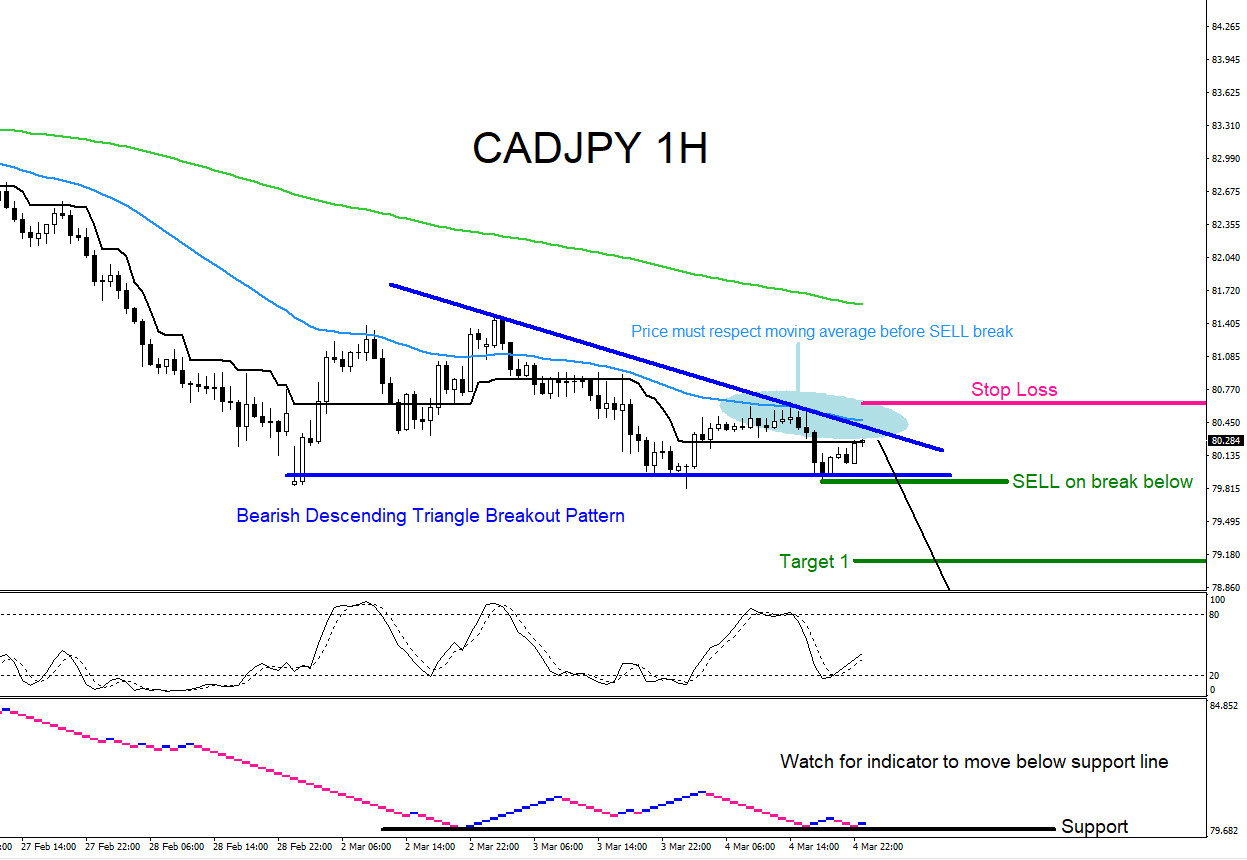
CADJPY 1 Hour Chart 3.4.2020 : The chart below was also posted on social media (StockTwits/Twitter) @AidanFX March 4/2020 showing that a bearish descending triangle breakout pattern (blue) was forming. I called for traders to watch for SELLS on the break below the triangle as long as price respects the moving average (light blue) and to also watch for a break below the support level on the indicator.
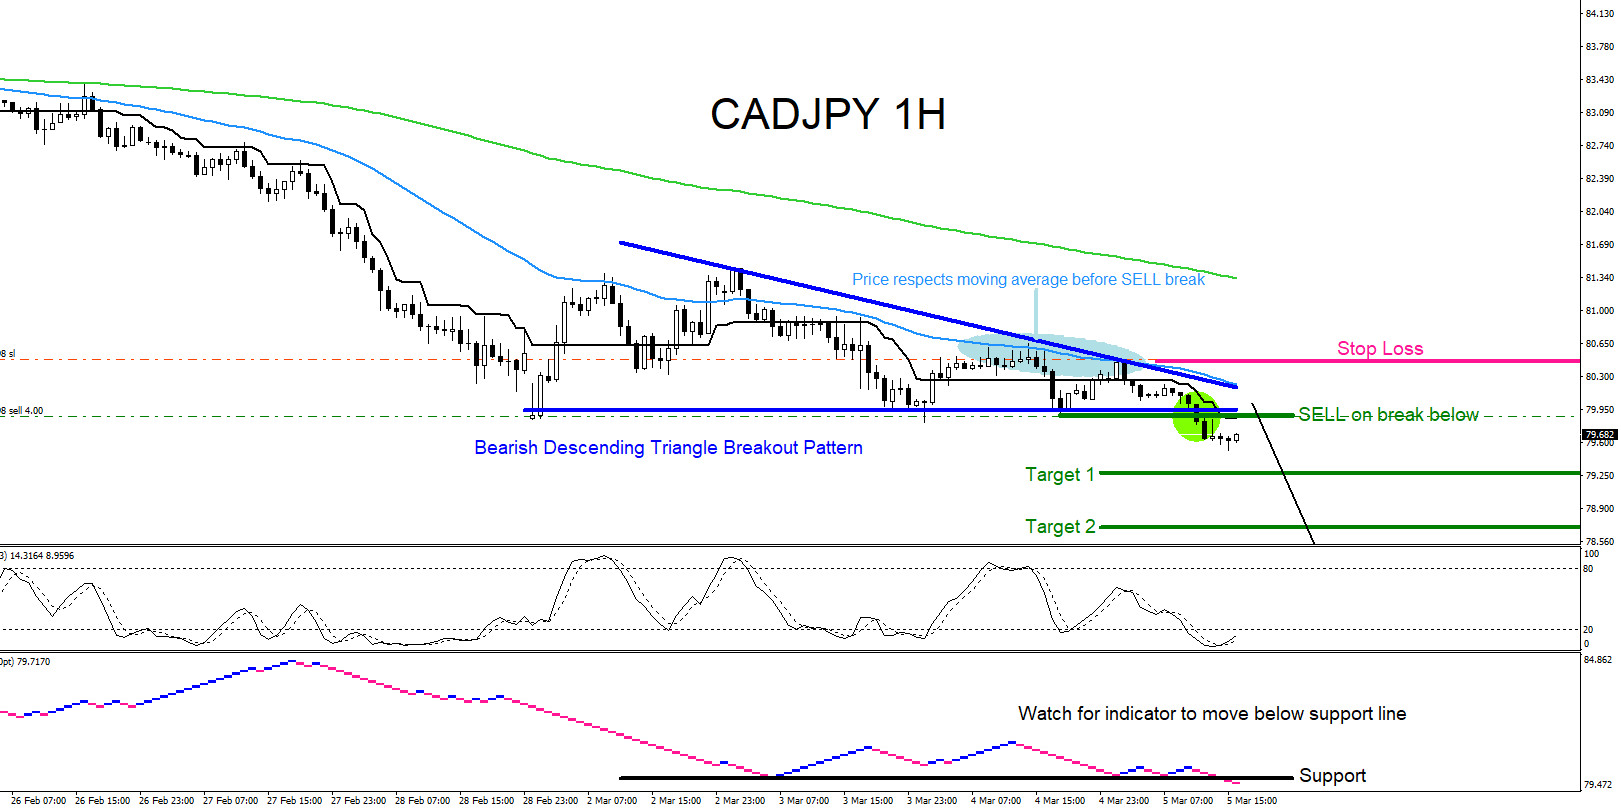
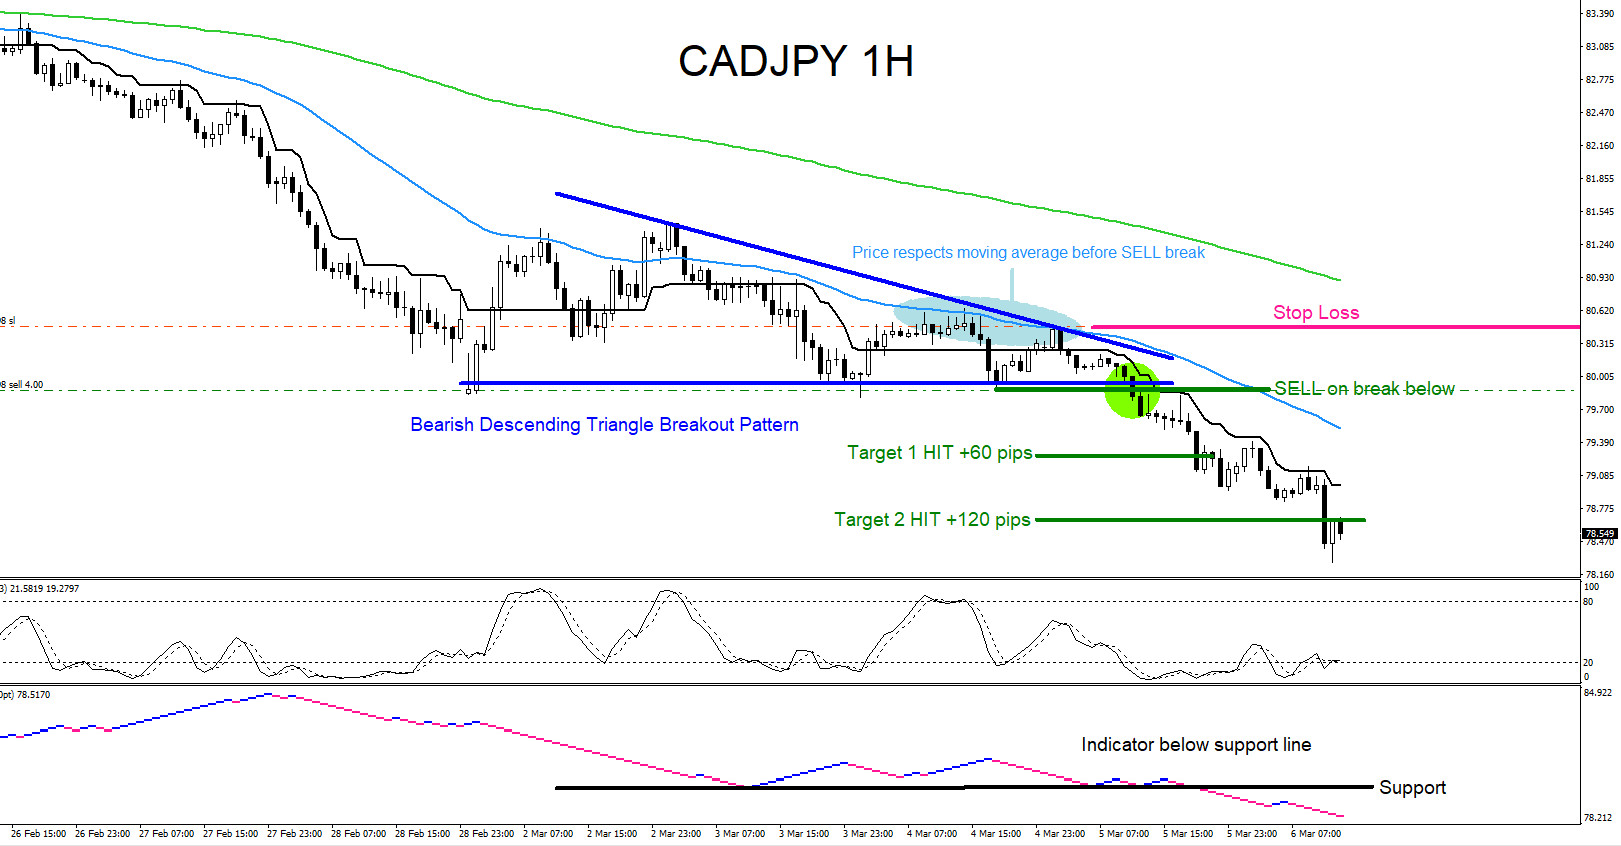
CADJPY 1 Hour Chart 3.5.2020/3.6.2020 : Price breaks below triangle triggering SELLS. Indicator also broke below support level signalling downside momentum. By the end of the trading week March 6/2020 price hits target 2. There was no reason or signal to close the trade so sell trade was held over the weekend.
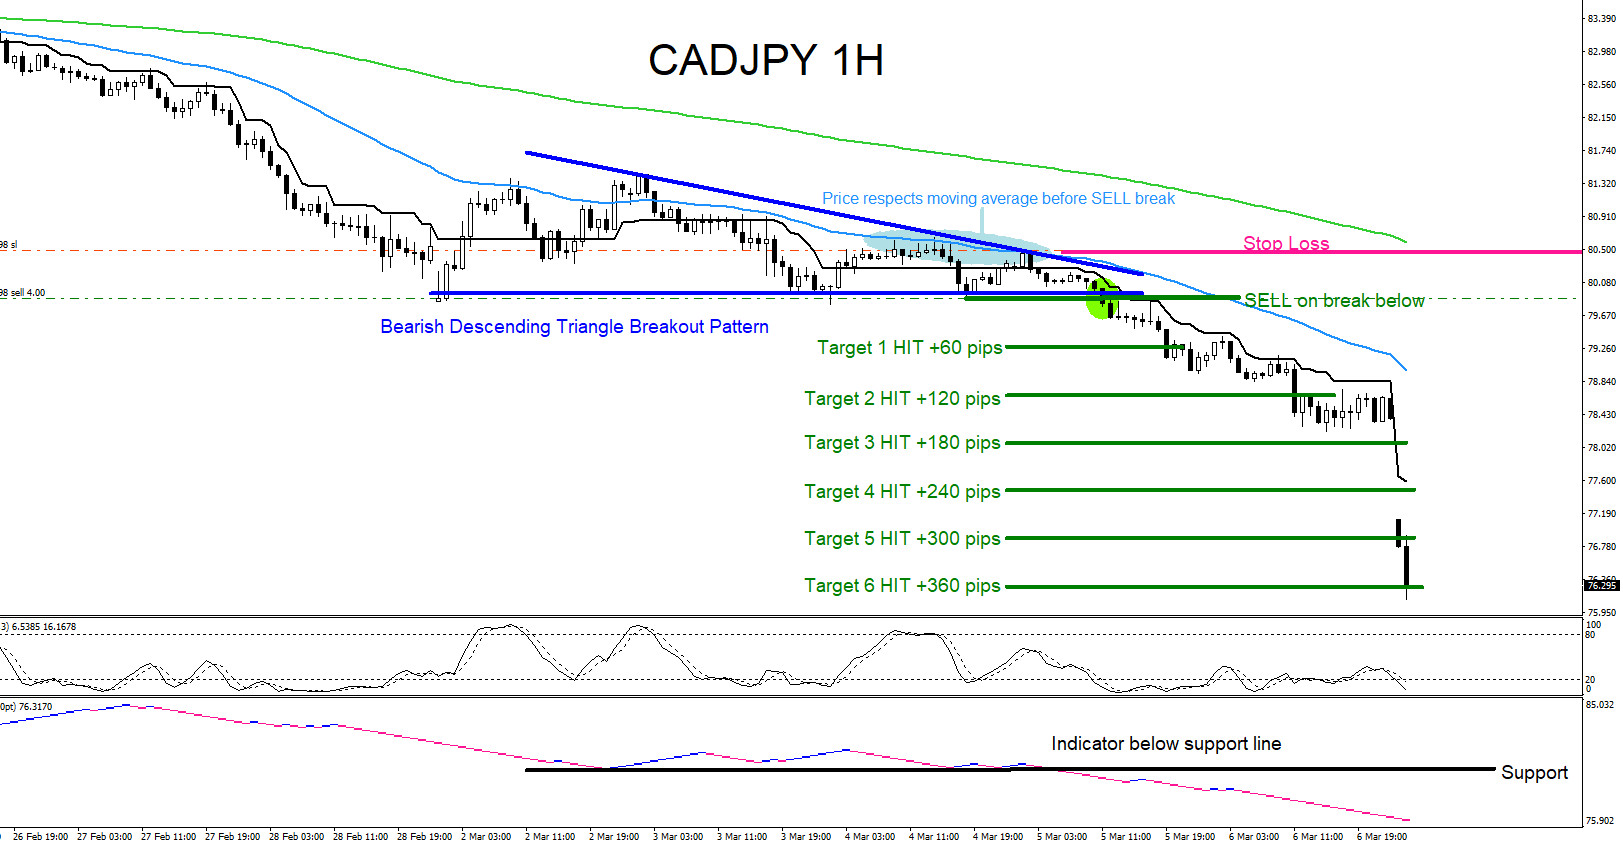
CADJPY 1 Hour Chart 3.8.2020 : At the open of the new trading week price drops lower from the panic sell off of the markets and hits the 1:10 RR Target for +600 pips where I eventually banked profits. If you followed me on Twitter/Stocktwits you too could have caught the CADJPY drop lower.

Of course, like any strategy/technique, there will be times when the strategy/technique fails so proper money/risk management should always be used on every trade. Hope you enjoyed this article and follow me on Twitter for updates and questions> @AidanFX or chat me on Skype > EWF Aidan Chan
*** Always use proper risk/money management according to your account size ***
At Elliottwave-Forecast we cover 78 instruments (Forex, Commodities, Indices, Stocks and ETFs) in 4 different timeframes and we offer 5 Live Session Webinars everyday. We do Daily Technical Videos, Elliott Wave Trade Setup Videos and we have a 24 Chat Room. Our clients are always in the loop for the next market move.