Cameco is one of the world’s largest uranium producers, involved in the exploration, mining, refining, and conversion of uranium for use in nuclear power generation. The company’s operations span across Canada, the United States, and Kazakhstan. Below we are updating the Elliott Wave outlook for the company.
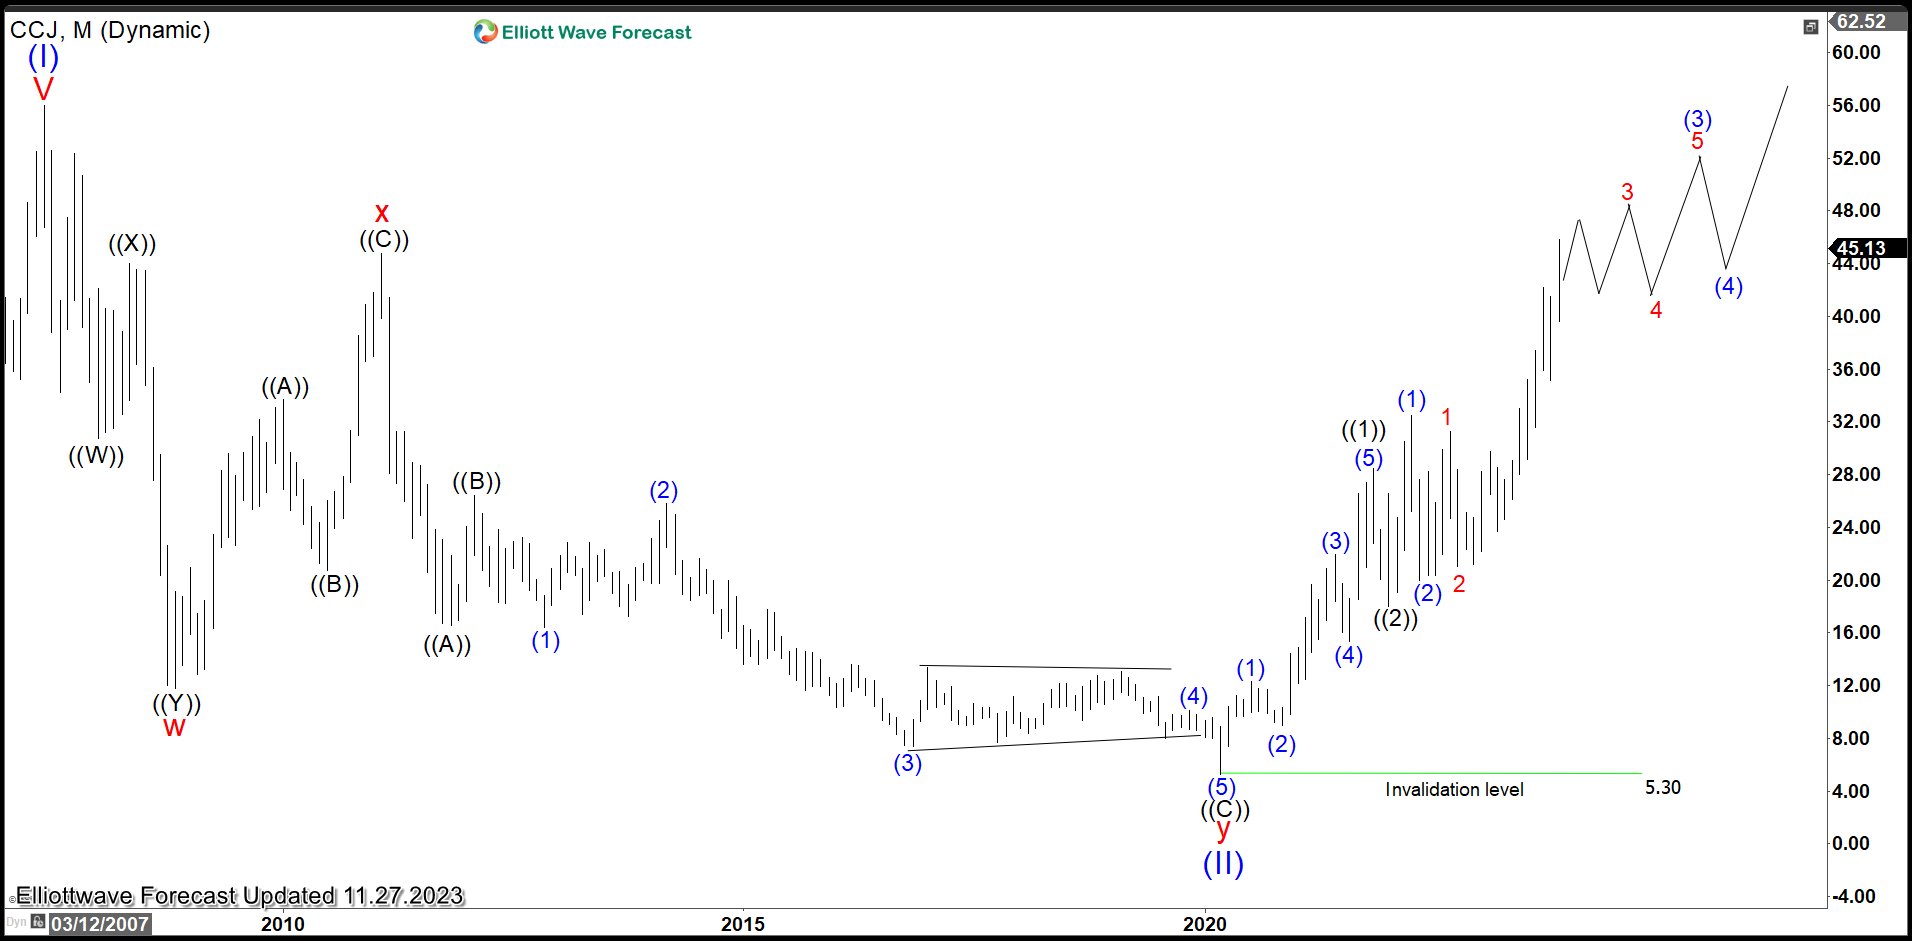
Cameco ($CCJ) Monthly Elliott Wave Chart
Monthly Elliott Wave Chart of Cameco above shows that the stock ended wave (II) Super Cycle at 5.30. It has started a new super cycle wave (III) which should eventually take it to new high above wave (I) at 56. Up from wave (II), wave ((1)) ended at 28.49 and dips in wave ((2)) ended at 18.03. The stock extended higher again in wave ((3)) as a 5 waves impulse. Up from wave ((2)), wave (1) ended at 32.49 and pullback in wave (2) ended at 20.02. Wave (3) of ((3)) is currently in progress and should continue to see further upside.
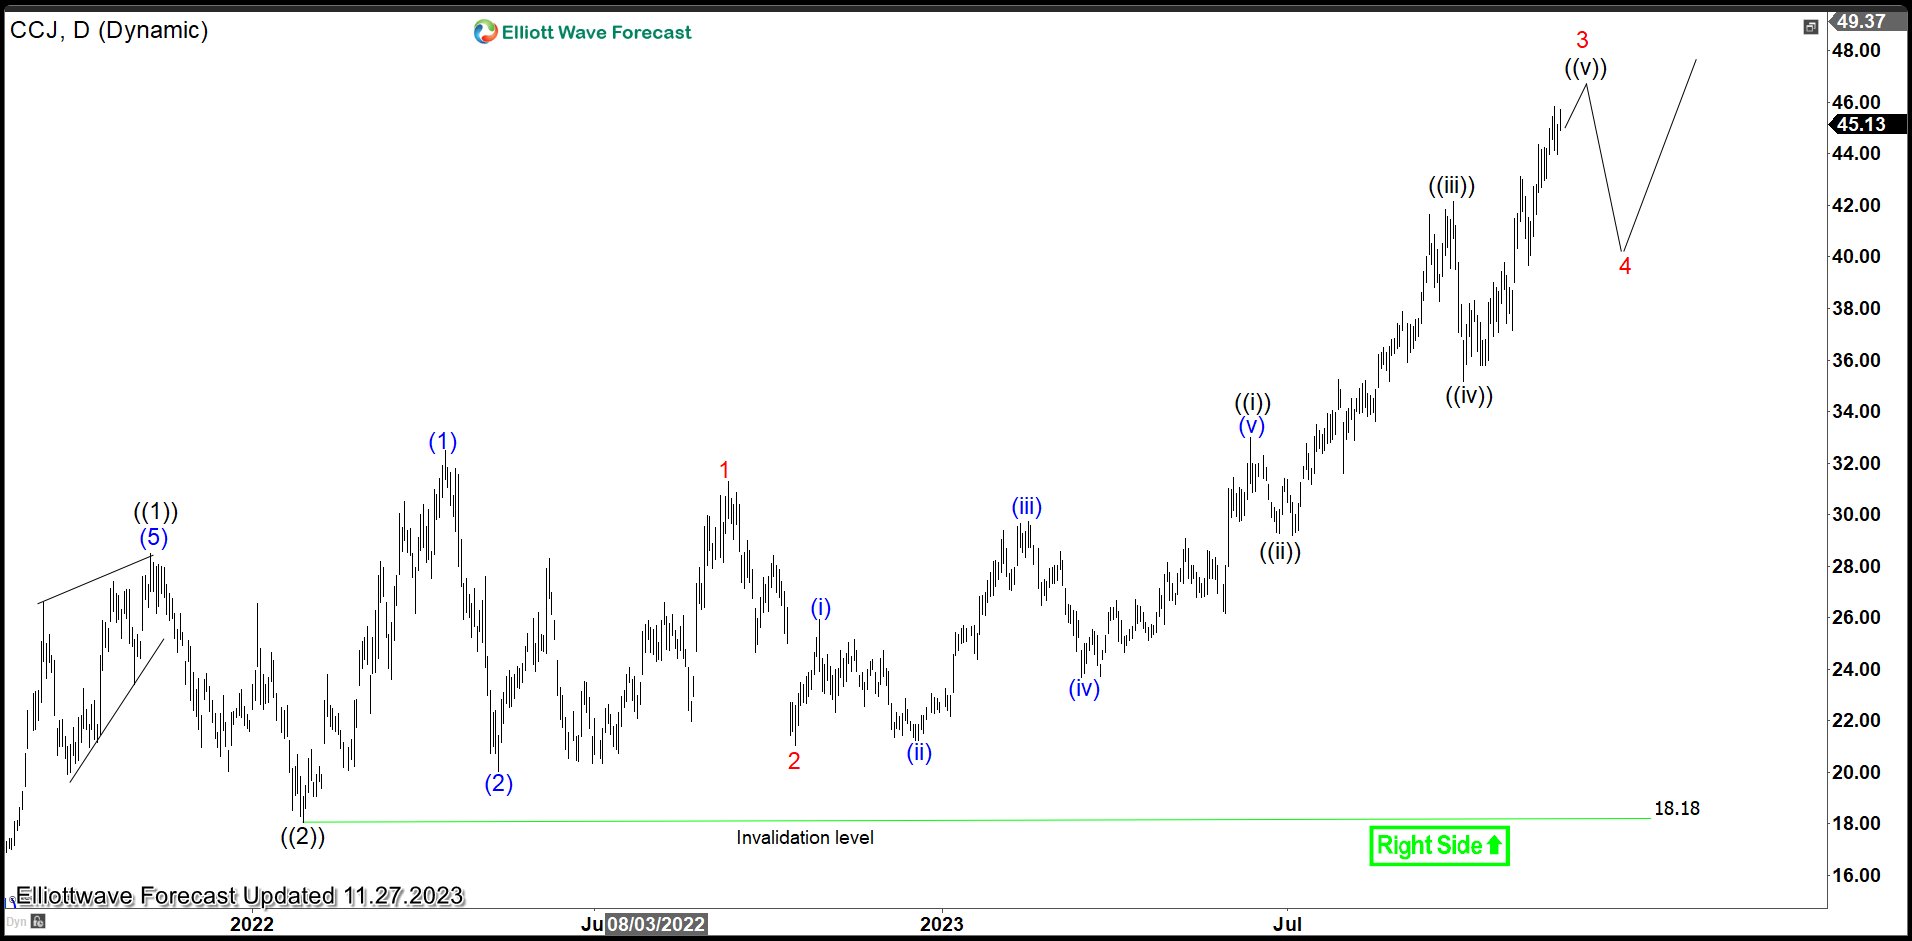
$CCJ Daily Elliott Wave Chart
Daily Elliott Wave Chart of Cameco (CCJ) above shows wave ((2)) ended at 18.18 and the stock is nesting into wave ((3)). Near term, expect dips to continue finding support in 3, 7, or 11 swing against 18.18 for further upside.

