Cameco Corporation (ticker: $CCJ) is the world’s largest publicly traded uranium company, based in Saskatoon, Saskatchewan, Canada. In 2015, it was the world’s second largest uranium producer, accounting for 18% of world production. This article provides the Elliott Wave technical outlook of the company.
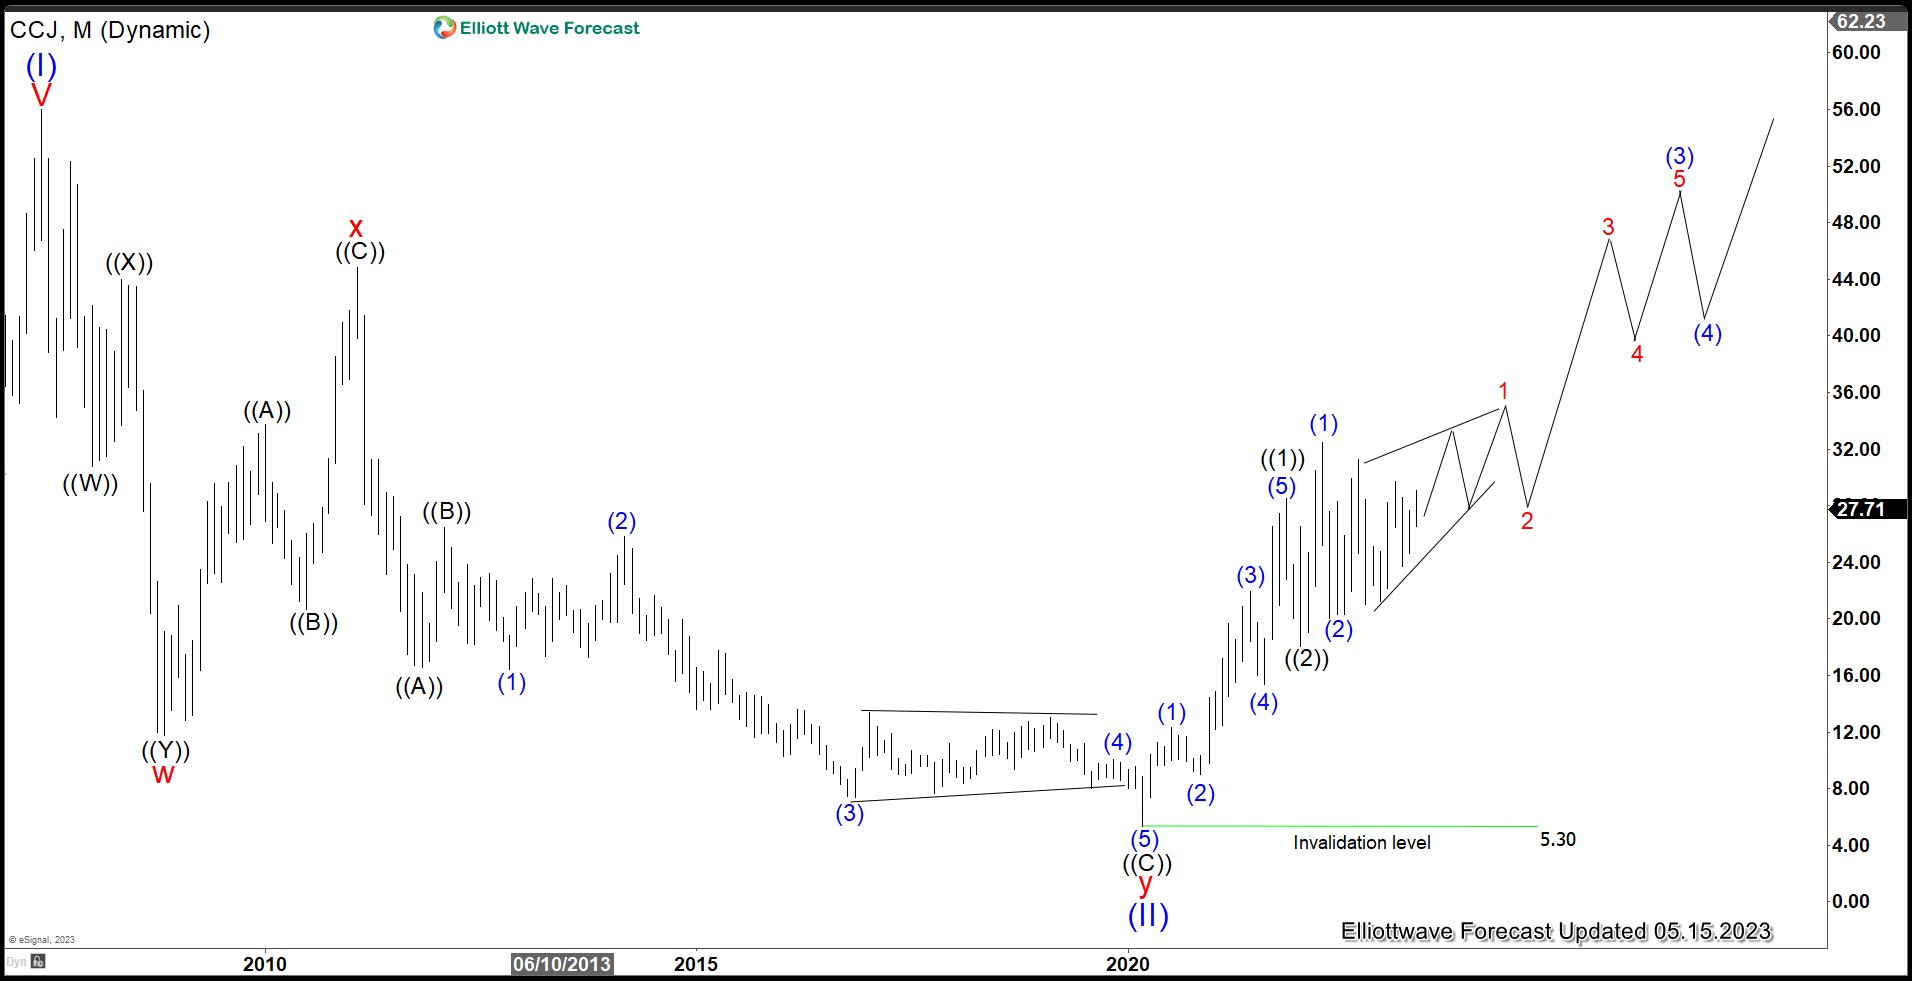
$CCJ Monthly Elliott Wave Chart
Monthly chart of Cameco above shows the stock ended wave (II) at 5.30 and it has resumed higher in wave (III). Up from wave (II), wave ((1)) ended at $28.49 and wave ((2)) completed at 18.03. The stock has resumed higher in wave ((3)). Wave (1) ended at 32.49 and pullback in wave (2) ended at 20.02. It has traded sideways since May last year looking for the next direction. We have a bullish bias and thus calling it higher as a diagonal within wave 1 of (3). However, this view still needs validation by breaking above wave (1).
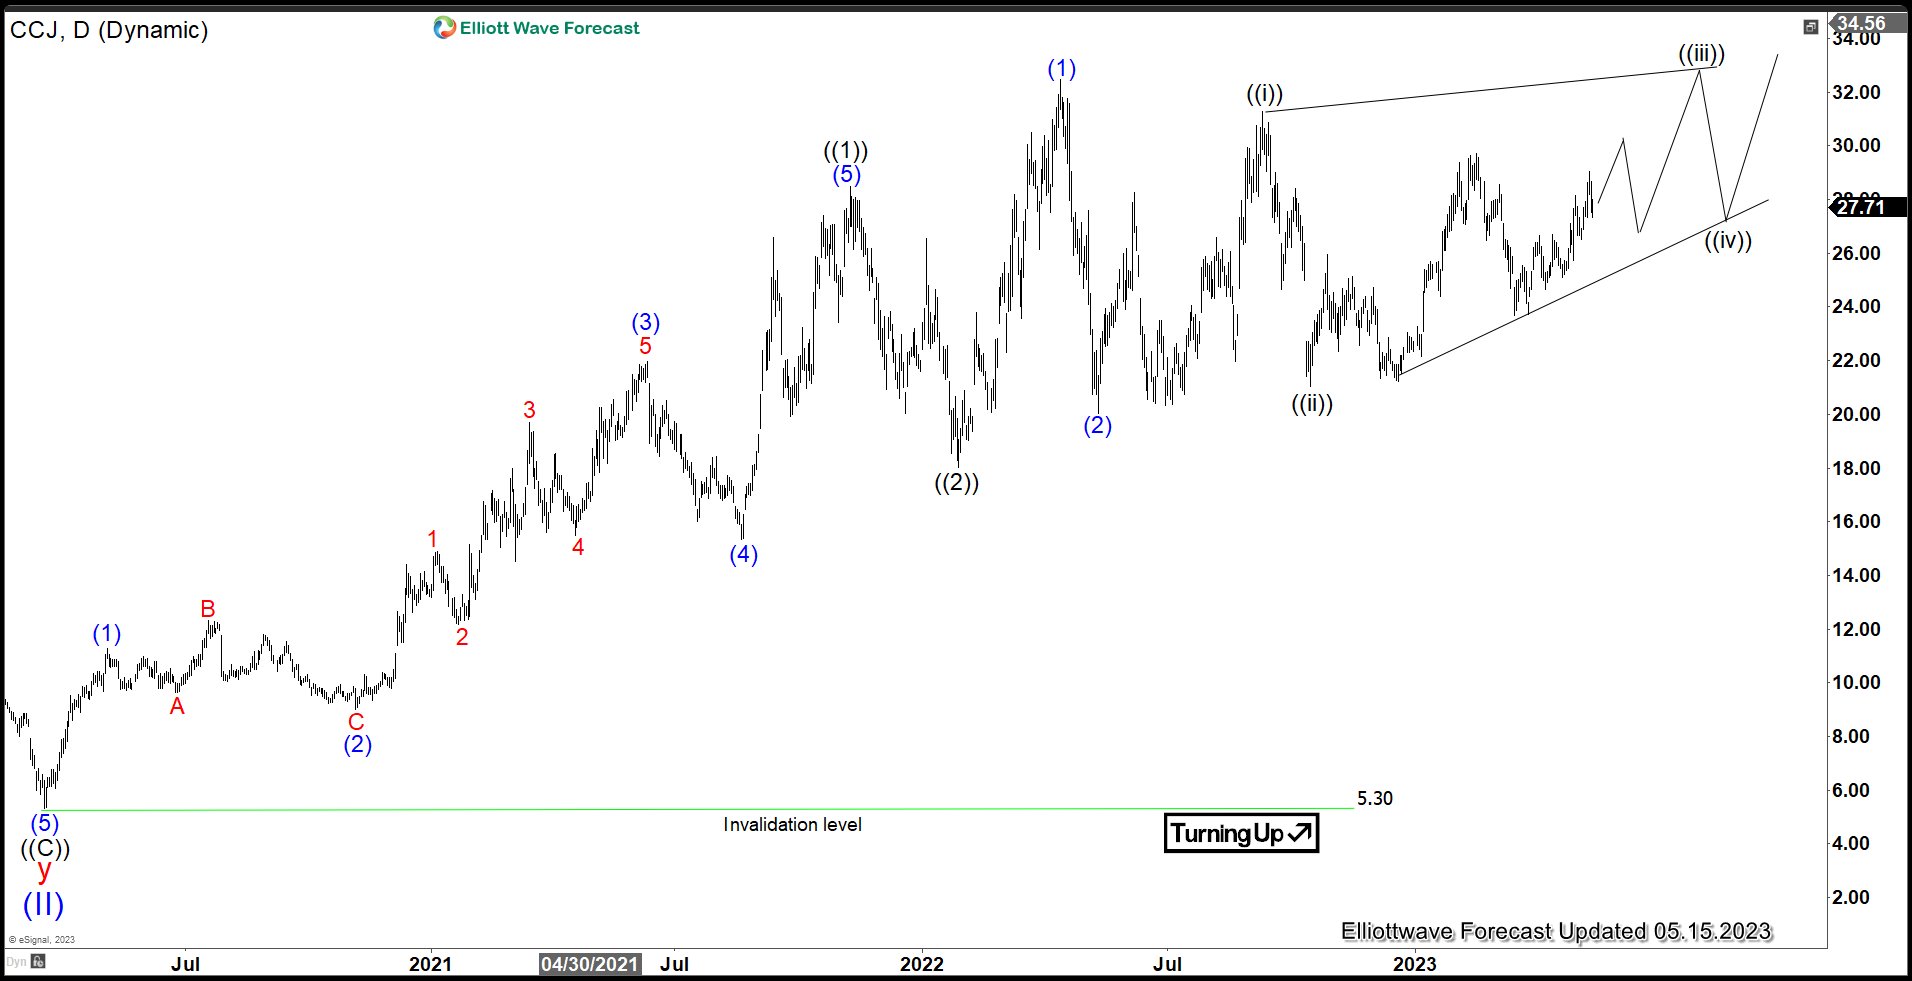
$CCJ Daily Elliott Wave Chart
Daily Chart of $CCJ above shows that the stock has traded sideways in the past year. The stock needs to either break above wave (1) or below wave (2) to show us the next direction. Either way, we are bullish against wave (II) low at 5.30. Break above wave (1) would confirm the bullish sequence and opens more upside. Break below wave (2) on the other hand suggests a double correction within wave (2). As far as pivot at 5.3 low stays intact, expect pullback to find support in 3, 7, or 11 swing for further upside.

