I saw horizontal green line as a breaking point to go long after consolidation. Before going to sleep I’ve dropped pending order slightly above the line, which triggered overnigh (Green arrow)
I woke up around yellow circle to see I am in the position on the green side, so switched to breakeven. It looks like good, strong move through the resistance with perfect retest. Additionally strong demand supported the rise and you can see weaker supply on corrections.
Price hit the “golden area” of 50%-61.8% Fibo almost perfectly. First two “knocks” came with raising volume, so I was expecting to break into the golden zone and continue the up move.
Upward move after second knock (build up for third one) came in with lowering volume. This is first sign of weakness.
Third knock goes with lower volume than previous ones. I saw this as supply taking control. I closed the position in profit near the 50% line (red arrow).
If new bullish move would appear supported by strong demand I consider jumping back long for a quick scalp.
I like this analysis, and though people could poke holes in it, I always like reading such “brain dumps”. It takes a special dedication to the art of trading to be able to post-analyze winning and losing trades, and you do that very well.
I cut my teeth on “moving averages” as an engineer in the 1980s. I was using instruments that gathered back-scattered neutron radiation, and natural gamma radiation in rocks underground (oil exploration). Having started in the analogue days before everything was hidden behind the mask of “digitalisation”, I used to wonder why, as you increased the number of data points to create an average, the time stamp of those averages moved forward in time. Not sure I have explained that properly, but if I had spent less time at Uni playing bridge and more time in maths lectures I would have probably recognised something called a Fourier transform. Alas, that was nearly 50 years ago, so no use crying over spilt milk.
I use this example because I am fascinated by data manipulation in the effort to “see trends”, ideally before they happen, but alas in reality most of the indicators are after the event. This is one of the reasons I respect the NNFX method. NNFX has not done any mathematical or technical analysis on why certain indicators indicate real world behaviour of markets, and why other indicators fail miserably and only tell you what happened after the event, often too late to take advantage of the event.
Taking this concept to its limit as you describe, about the 1M timeframe, by definition a 1M is the smallest timeframe you get data for in the retail market, so the average true range of one dataset over the same time period is itself. If you look at a chart of 1 minute price action and blur your eyes, you will see the 5m ATR. Print out the chart and draw with a pencil across the average highs and lows of the one minute candles, and it will be a pretty close approximation of the 5m ATR.
So what I applied from my “scintillating” days as an engineer is that if you try to smooth data over too short a timeframe, the error in the result is too high to interpret any real trend. You are far better off using a much longer timeframe over which to collect, process and analyze data. I believe this is the reason that it is common practice to look at trends just one timeframe either side of your preferred trading timeframe just to confirm there is actually a trend. So if you are a day trader (or swing on a daily basis), you would be seeking to determine the trend on the daily charts, with confirmation of trend on the four hourly and the weekly. You may ask “why not the 12 hourly and the 2 daily?” Because the four hourly is one sixth of the daily, and the weekly is one fifth of the daily, and that is sufficient difference either side to confirm a trend for direction (daily aligns with weekly), and to determine a zone of interest for entry (the end of the four hourly candle that matches your entry criteria for a back-tested, proven high probability trade)
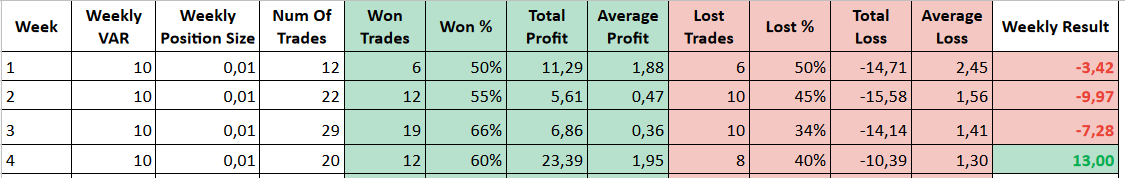
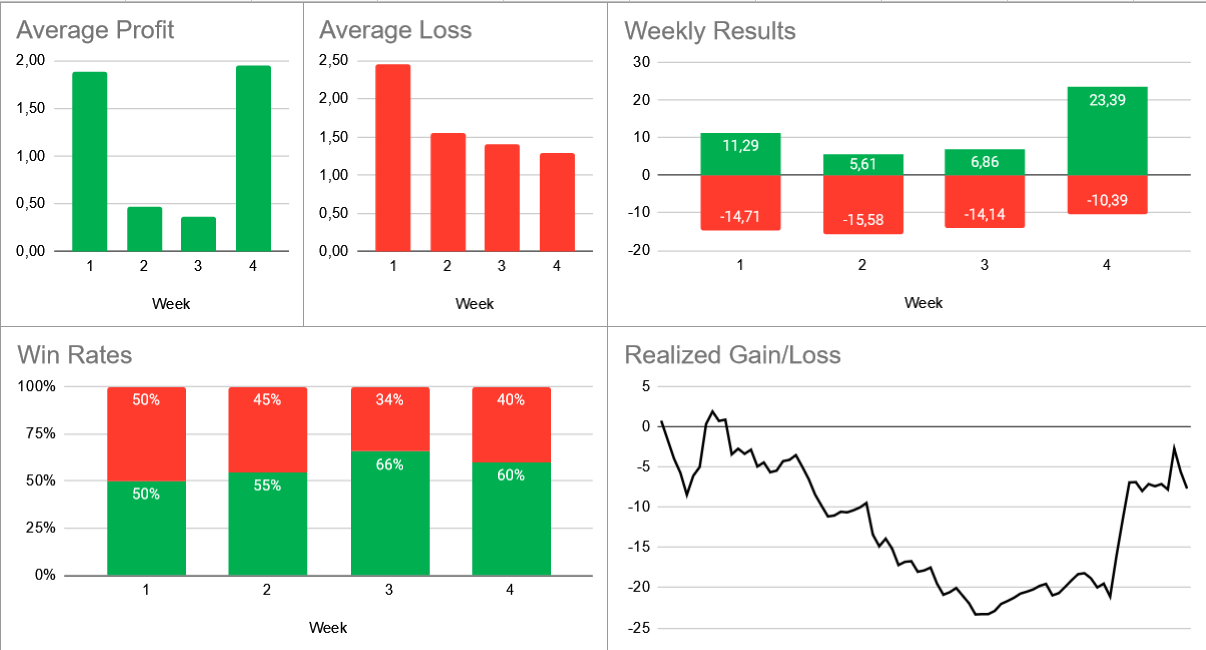
This week ended with very good result (+13 PLN), but as always errors have been made.
Results first, as Friday evening is good moment to have a small celebration.
Few (relatively) very high profits allowed to get great net result. I must admit, that one of these was a trade let loose with higher SL than usual and left alone due to some urgent matters outside of trading.
I’ve booked medium losses due to wishful thinking about what is going to happen. After closing good, profitable trade, I have unnecessarily jumped back in AND averaged down during the process. As a result losses were slightly larger than profit from the first trade - very disappointing from my side.
Rules are good so far - it’s following them in such fast pace is difficult. On 1H-1D charts, where I usually trade, I have more than enough time to stop and really think WHY and WHAT I am doing. In 1M it is really hard for me to reach the same level of self awareness and keep up.
I am considering changing the pace a little by looking also to 5M chart and extending the SL. Having 3PLN - 5PLN SL would allow me to take only three consecutive losses in a week, but it may increase overall expectancy.
Getting back with update after two weeks.
Last week with zero trades and this one with very few. I see new problem with trading this short term scalping - it requires more and more time during the day. Quality trades require a lot of patience and active chart time to catch. On the other side having little time for sitting in front of charts cause the urge to take what it is - not always best trades. This week results are very good, but I feel more lucky than prepared I’ve also allowed myself wider initial stop losses. Very narrow stop loss allows to profit only from awesome momentum trades where first pips appear immediately in green. Trades, which start with markets indecision (good/mediocre ones) usually hit SL and then go either way.
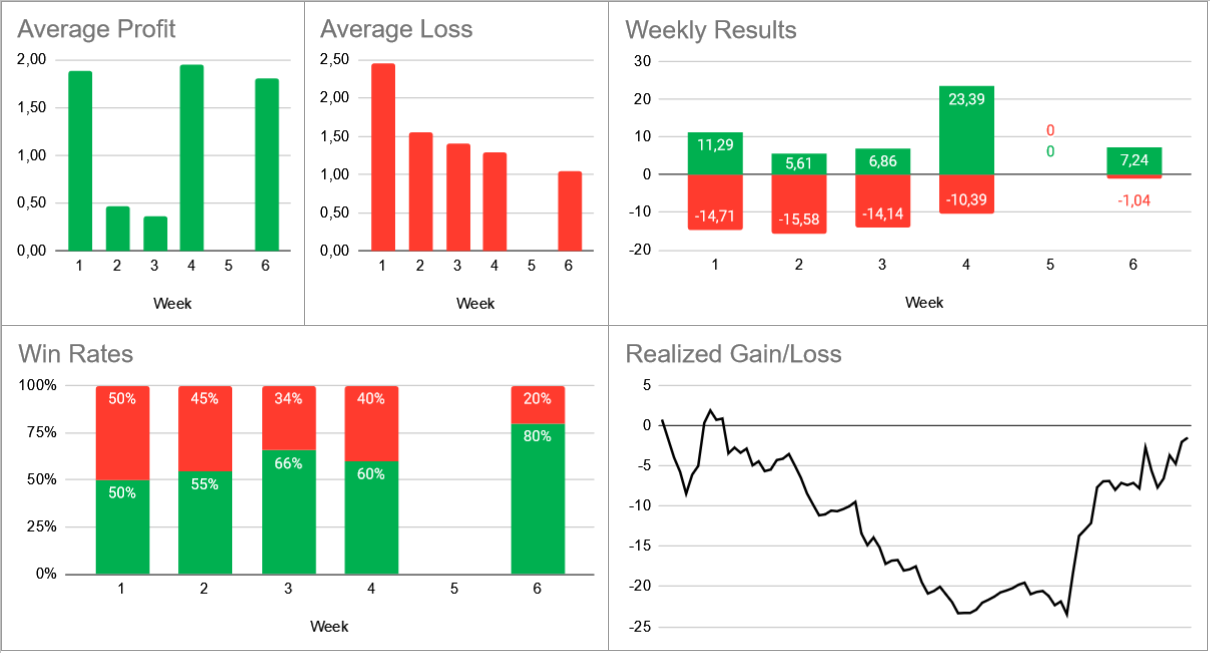
Well done, we all need some successes. Really like your executive summary data. Quick question - is the realized gain/loss in dollars or percentage of funds allocated to the trade account?
If you trade with loose stop loss stubbornly waiting for a reversal of bad trend in losing position, you may succeed in some trades but the more trades you make the higher is probability there will be a losing trade from which you won’t recover and get margin call or even stop out.
I think you took many incorrect assumptions
Have you read the post from beginning including the explanation of trading plan and money management framework?
There is no chance for margin call and risk is carefully kept in check week by week.
Another week bites the dust.
All losses have been recovered (almost). It’s been seven weeks so far and few observations below:
This way of scalping requires extremely high win rate (> 80%) to keep head above the water
Almost all trades are at least for a short while positive or near zero - due to extremely unfavorable risk reward ratio trades must be closed as soon as possible with little loss or little gain. Very hard from psychological point of view.
Moving stop loss to break even is suboptimal - almost always it would be better to just take the profit instead of securing scraps. Spreads are huge and will close out profitable trades due to just natural market moves. At 1 minue each pip in plus matters. There is no swing trading, as often spread is larger than swings
Trading this way requires screen time. As my dream goal would be to live off the forex - I don’t want to change my regular job to “forex 9 to 5”. This may be a good experience to be able to jump between breakfast and coffee and bite some pips, but I doubt to ever make it a relevant strategy in my arsenal.
It requires well developed resiliency. One bad trade can wipe few profitable ones and this just hurts. Natural consequence of high win rate / low RR strategies. This week I’ve had 7 profitable trades and one loss… Yet, the loss took away almost 50% of profits The more I trade this way, the more I feel I need a strategy with balanced win rate and risk reward.
Congratulations on coming back over that zero line. Also on surviving four weeks without a loss week. That looks positive, but I gather from what you have written you think this is still in the realm of statistical noise. But if you continue with this strategy whilst trying to refine your rules, and you maintain the win rate at 65% or above, it could be the start of a plan that would generate a positive outcome overall.
Just a daft idea really, but instead of scalping based on pips, have you thought of back testing a strategy based on length of time the trade is held? For example, what happens if you close a trade exactly 5 minutes after you bought, if it has not reached SL by then?
So after several months you are slightly above breakeven right? I see that your performance improved greatly in the couple of last months, what did you change in your approach?
Changes and lessons learned are already scattered in above posts, but I believe three are main contributors:
Patience - I took too many trades too fast
Taking trades more from M5 chart than 1M - M5 gives me slightly better feeling for scale of spread
Increasing Stop Loss and actually reducing the risk to reward - taking smaller profits and allowing bigger risk seems counterintuitive, but the increase in win rate so far is compensating this unfavorable risk:reward bias.


 I’ve also allowed myself wider initial stop losses. Very narrow stop loss allows to profit only from awesome momentum trades where first pips appear immediately in green. Trades, which start with markets indecision (good/mediocre ones) usually hit SL and then go either way.