I’ve learned that a single candle can indicate both high and low.
1 Like
Welcome to Babypips, @Blueb
A single candle obviously defines and displays the high and low of the period over which it was formed. If you look at a monthly chart, for example (as many investors do), each individual candle/bar obviously displays the high and low for that month. And that’s true of all other timeframes, too.
How you choose to define “trend” is up to you. We all have our own definition of it that suits our own purposes and our own trading methods.
The answer to your specific question of whether two consecutive candles can indicate a trend is definitely Yes: for example, in some institutional trading circles where Heikin Ashi candles are used, a trend is actually defined for some purposes as two consecutive HA candles of a certain type with certain specific attributes. My understanding is that this is more for scalping than anything like the monthly charts I mentioned above.
4 Likes
Trend will be relative to the timeframe used. A single monthly candle can have many uptrends and downtrends on the lower timeframes.
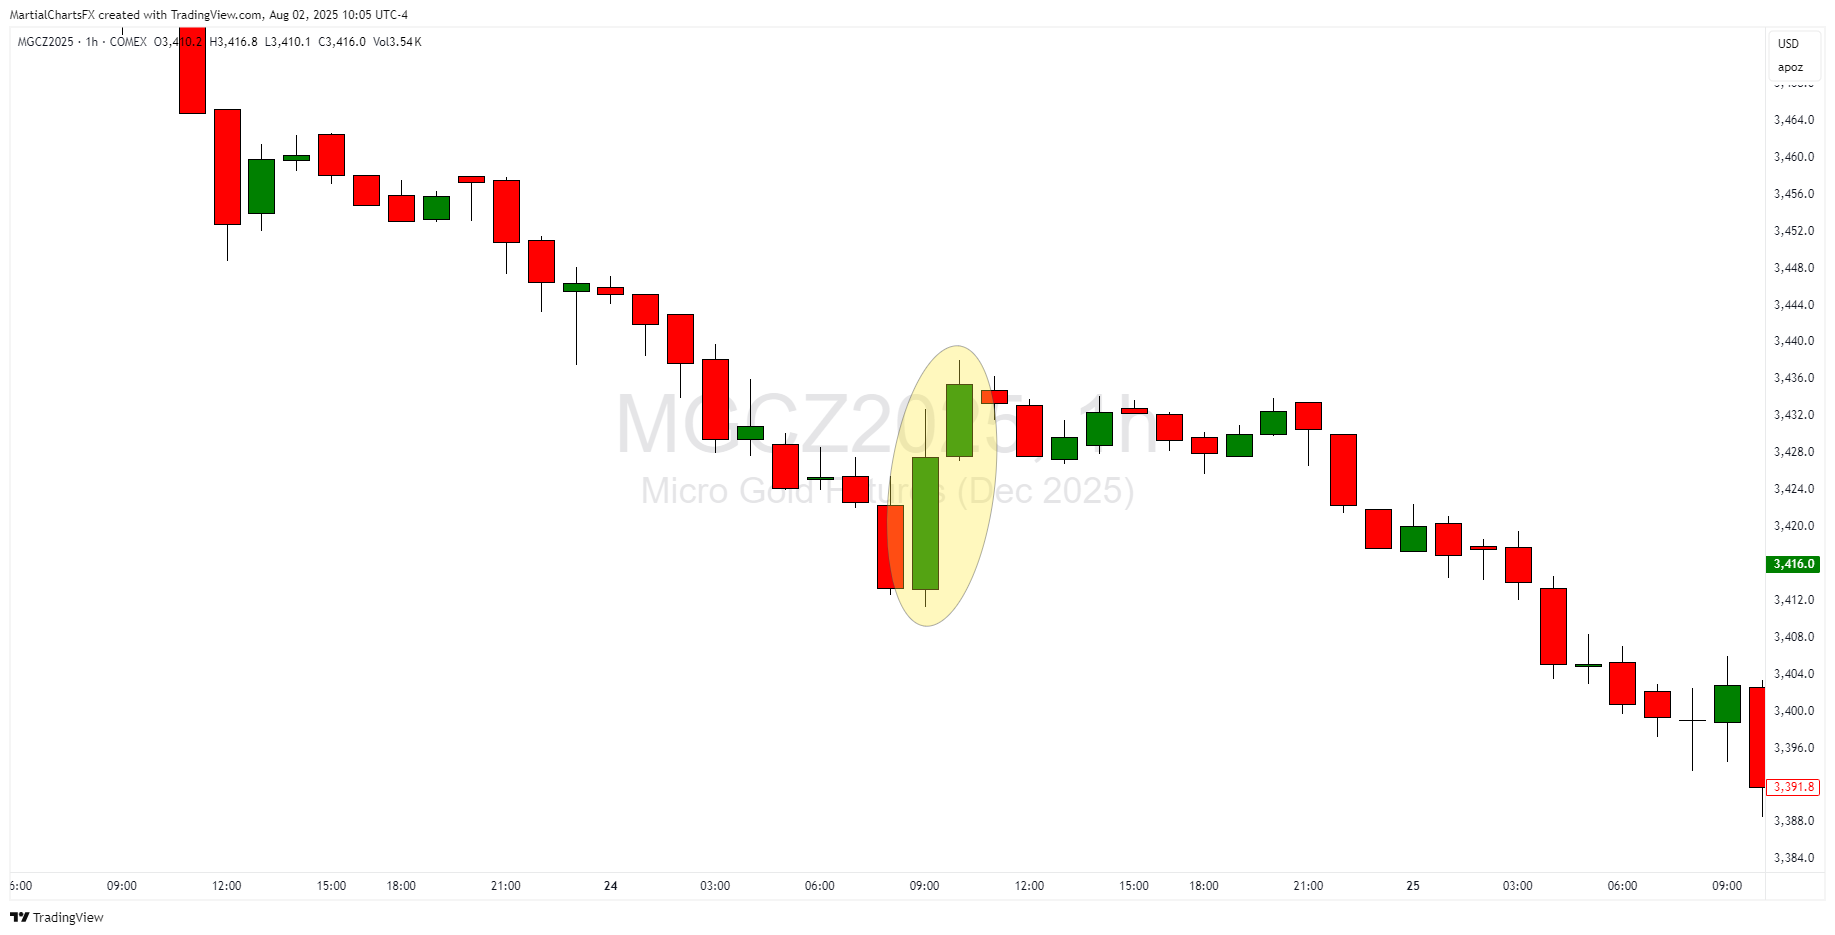
These 2 consecutive bullish 1 hour candles in this downtrend wouldn’t represent an uptrend on the 1 hour timeframe.
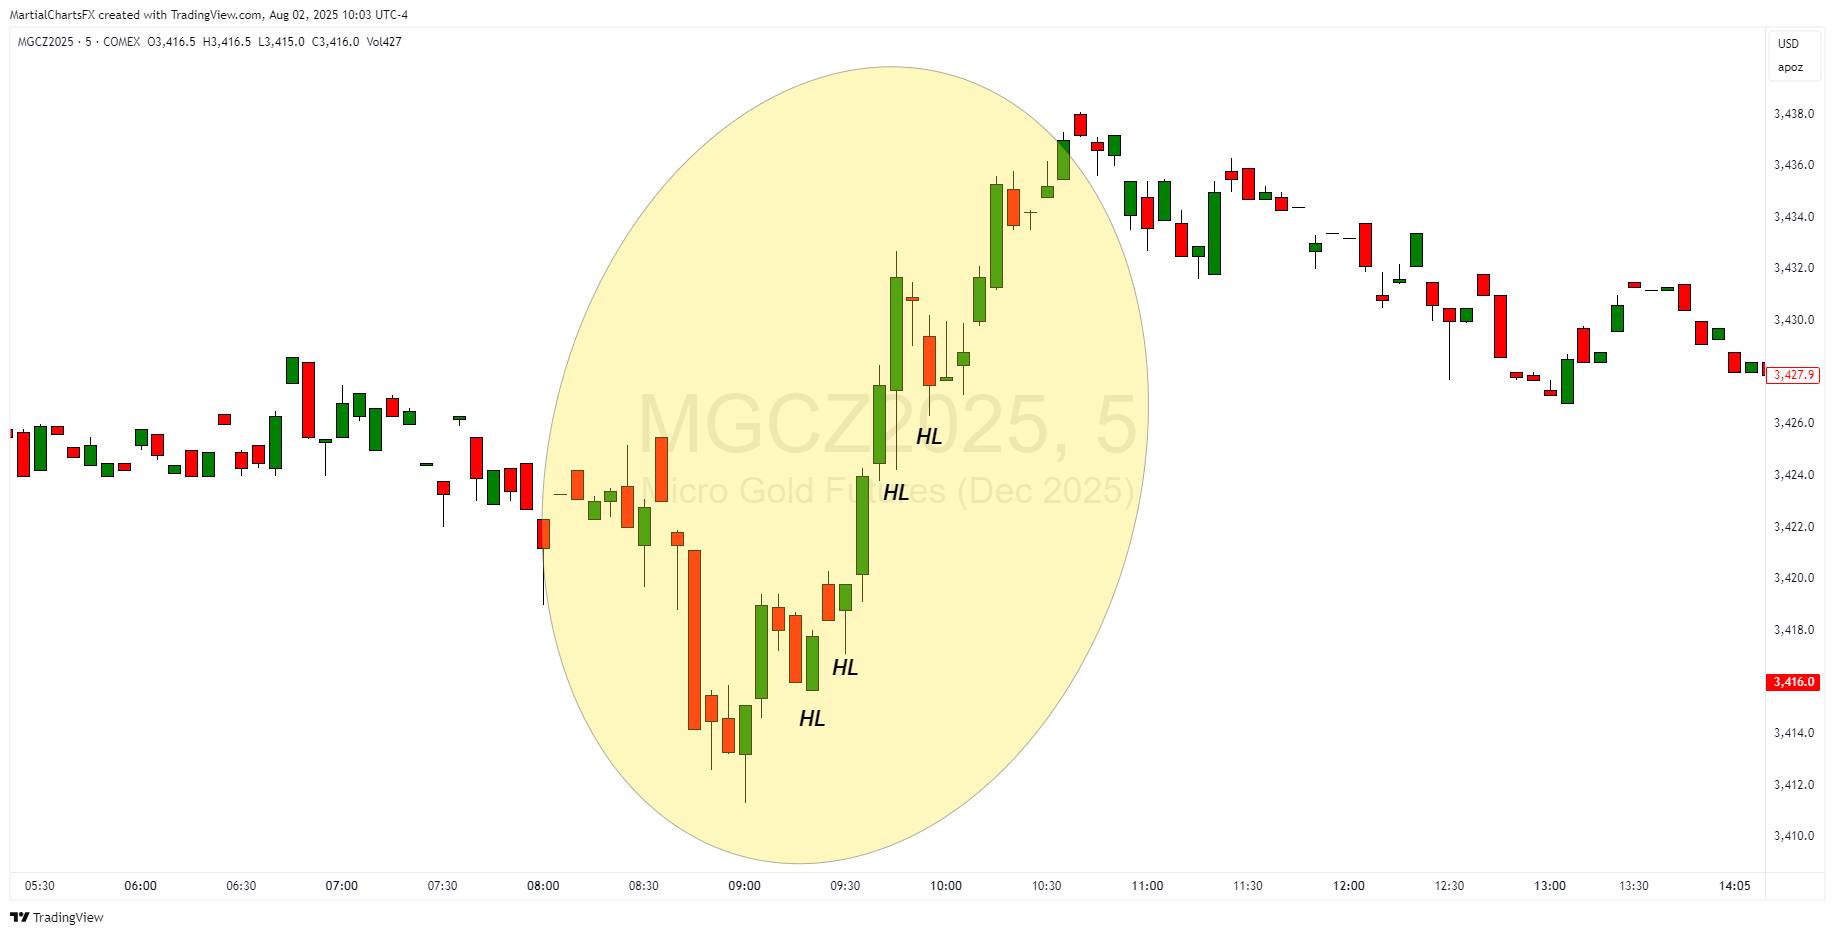
The same 2 consecutive bullish 1 hour candles do represent a short term uptrend on the 5 minute timeframe
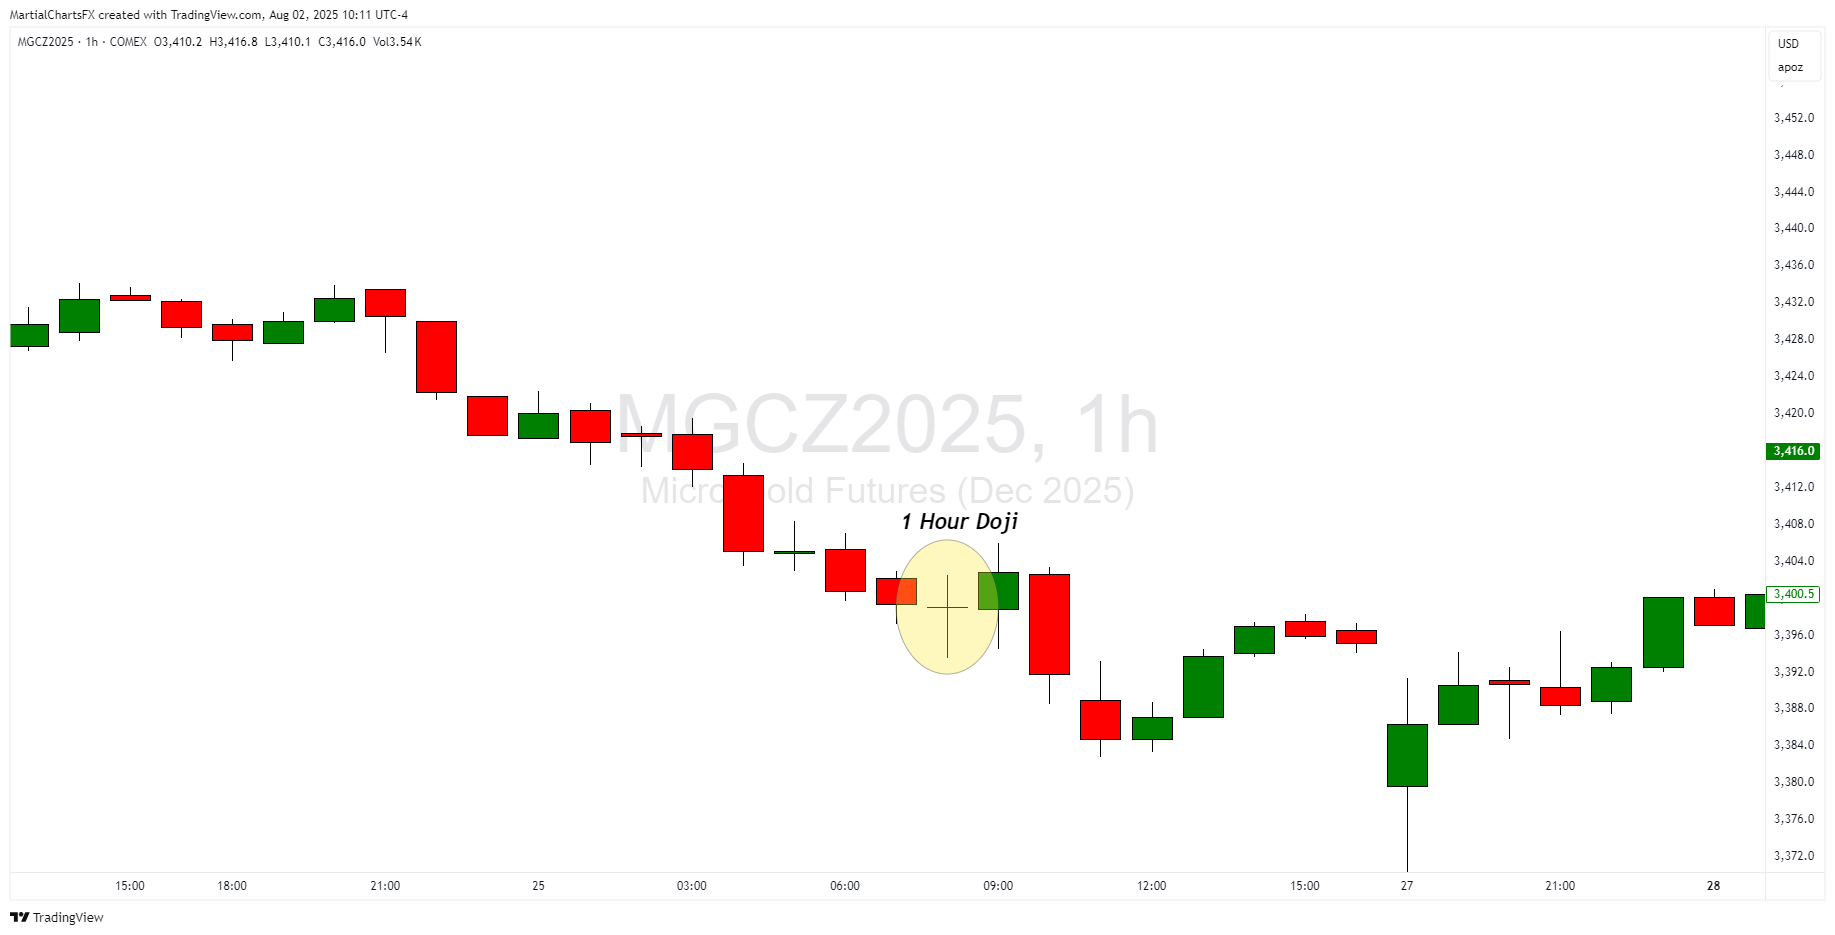
Even a doji can have short term uptrends and downtrends as price oscillates between the support and resistance, if you go to a low enough timeframe.
Same doji on the 1 minute:

An hourly uptrend can be a bullish retracement in a daily timeframe downtrend. It is inevitable that at some point you will trade counter-trend to some other timeframe, but the trend that matters is the trend that you’re using to frame your setups on your chosen timeframe.
Welcome to Babypips!
6 Likes
Your definition of a trend is determined by the rules concerning how to trade that trend in your strategy. Identify the strategy, identify its rules and then find a trend that complies with these rules.
A trend which you can use only exists when you have drawn it on your chart, other market players do not see the exact same trend as you do and they are playing different strategies anyway.
6 Likes
Well said, I believe this is how the majority does it.
However, my internal wiring is backwards compared to most people. What works for the majority unfortunately doesn’t work for me, which is probably why it took 11+ years (!!!) for it to finally click for me.
I personally needed to do it in the opposite direction:
First identify the different market trends, then learn to objectively analyze them, figure out which trend best fit my personality and lifestyle preference and then create & optimize a strategy that fit.
Different strokes and all that… ![]()
2 Likes
Exactly! A trend only exists based on your strategy’s rules. So, two candles might signal a trend for your system if that’s what your rules say.
1 Like
The two consecutive candles might be an indicator however we can add one or more confirmations to our analysis to take trades.