I am trying to learn how to correctly draw a located wedge pattern.
Here is an attempt from this morning’s GBP/USD:
Rising Wedge GBP/USD(D1) 22/06/2023 Rising wedge suggests reversal – but I think this is drawn wrong – wedge should be over a smaller time frame? Can someone draw this wedge differently?
Can somebody please share how they woud draw a wedge here? Or is the problem I am having, that actually a wedge isn’t present here(I am looking for one when it doesn’t exist?) Over what number of ‘days’ would a wedge normally form?
I wouldn’t worry too much over the precise rules for drawing wedges (or any chart pattern). Every single trader who draws lines on a chart using a set of rules ends up bending those rules by the time they get to the third chart of the day.
To get a little artistic, lines drawn on charts should not be seen as photographic evidence, they are impressionistic.
They are a decent guide to what you might do next about the market but not a good guide about what the market is going to do next for you.
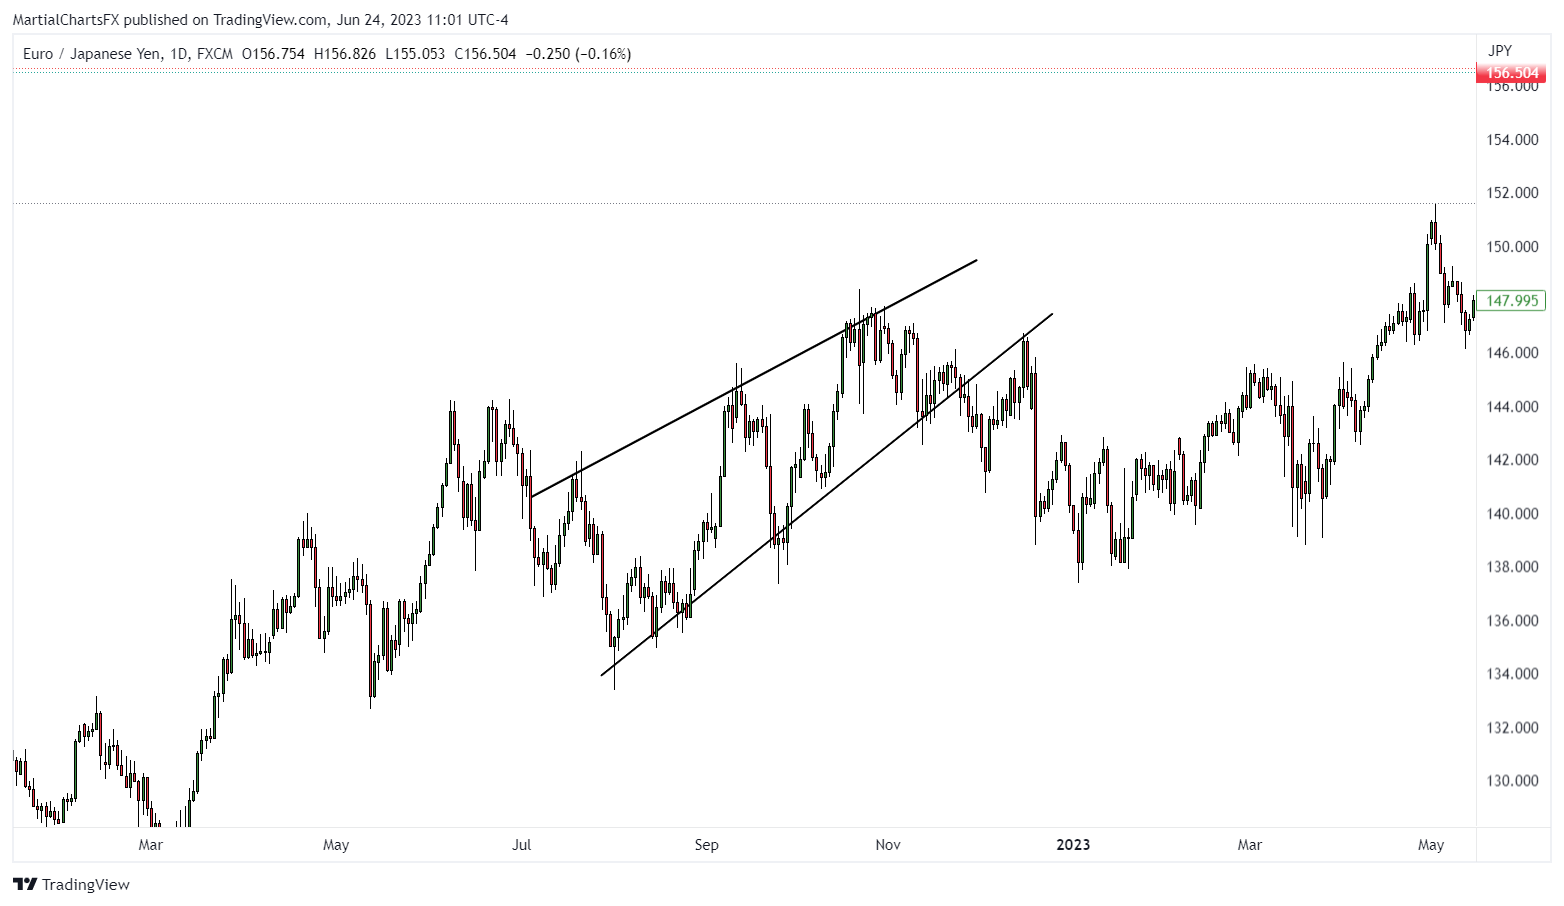
But in the same breath they are absolutely useless if you consider other considerations. For example this to me looks like a rising wedge.
However we know interest rates from BoE are likely to rise at midday, and therefore we are likely to see a bullish trend! So the rising wedge although present means a continuation when it would otherwise suggest reversal. So why does a page like this on babypips not give a bit more of a looser definition of a wedge?
Keep in mind that the trend line used to draw these patterns is not a hard set line in the sand and there is likely to be some spill over (wicks breaking through and even candle bodies) without invalidating the pattern itself. Treat the lines as areas rather than specific price levels.
If you are going to use wedges, look for rising wedges that terminate at an area of supply and falling wedges that terminate at an area of demand. This will give greater confluence and increase the probability of the pattern playing out as expected.