I am one of the babypips academy students and I’m currently stuck in the kindergarten section of the school that talks about how to create a channel as drawing this has been hard for me,been trying to draw one on the EUR/USD price chart since Saturday but it seems like I am not getting it,I do need assistance with how to draw and get it correctly,I understood that of the horizontal support and resistance lines but that of the diagonal line(Trend lines) is hard for me,your contribution will highly be appreciated, Thanks
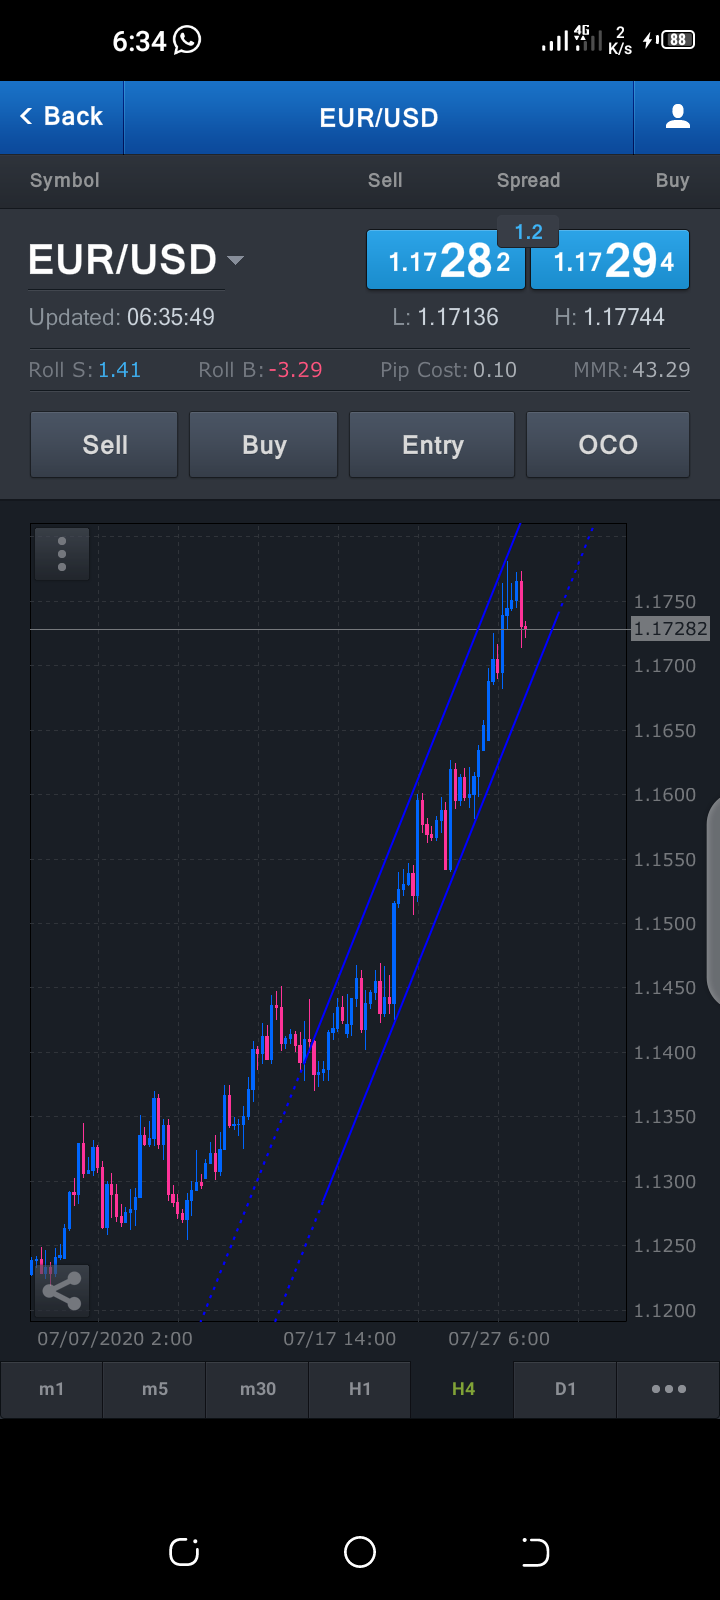
This is the channel I created on the 4hr chart of the EUR/USD pair but i am just not sure of how correctly I drew it need to know if it’s correct,and if not what I’ll need to know to drawing better and even faster as this took some kind of time for me to
Yeah it looks good. A channel is just two trendlines parallel to each other. So draw a trendline, matching atleast 2 points then duplicate the trendline and put it on the other side of price matching 2 points. Dont draw two seperate trendlines you have to duplicate the first one so the angles are the same.
However remember they aren’t always accurate. Price can break them and then go back in. You’ll have wicks sticking out of them too. They’re supposed to be a guide so you can easily see what price is doing eg in a trend, or in a range hitting the upper and lower channel. You can also draw the channel on a higher timeframe and then got to a lower one to anticipate price hitting the bottom or top and bouncing off to the other side.
The red circles are the first two touches to draw the bottom channel. Then you copy the first and form a second trendline. Put it on top of previous price highs to form the upper channel. Now you have a channel which you can see is ascending so look for buys. The yellow circle was a potential buy from the bottom of the channel. Some people also look for sells when it hits the top, that’s upto you.
Thanks so much for the assistance,i used the one I created this morning to make a little profit,its a demo account tho but it’s helpful,I’d like to ask some more questions,I hope you wouldn’t mind that tho
Nobody knows perfect recipe for drawing S/R lines. There are only general rules we use. The rest of the knowledge (which by the way makes money for you) comes from experience - you see what worked for you and build your own tools basically.
There are many types of support/resistance. Such as key level, event level, first support, and first resistant area, near term level. Each level of work is different. But the most important is the event level. You can get a detailed idea about these levels by searching online.
Nobody knows perfect recipe for drawing S/R lines. There are only general rules we use. The rest of the knowledge (which by the way makes money for you) comes from experience - you see what worked for you and build your own tools basically.