No problem, loosing is part of the game, I don’t mind loosing as long as I’ve learned anything from the loss. This time I ignored a couple of stalling signals due to lack of focus.
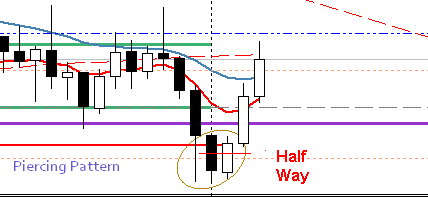
About your question. A definition of a Piercing Pattern is as follows: A relatively long Bearish Candle followed by a Candle that has opened with a gap below the prior Candles close (even a slight gap counts) which then retraces more than half way (with the real body, not just the shadow) within the prior Candles real body.
Your short on EUR/JPY’s perfect one . Though be careful on 106.10 - 105.30 area, it’s very sensitive, I’d take half of my profits around those levels if I were you. I don’t mean to teach you, just making an observation. Good luck.
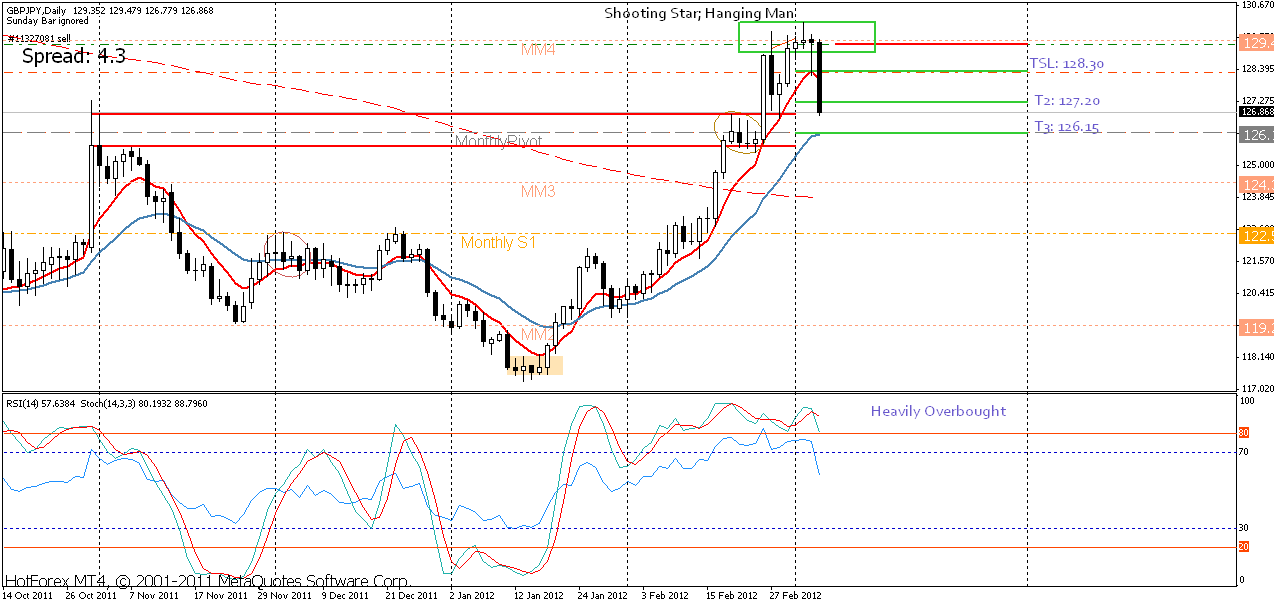
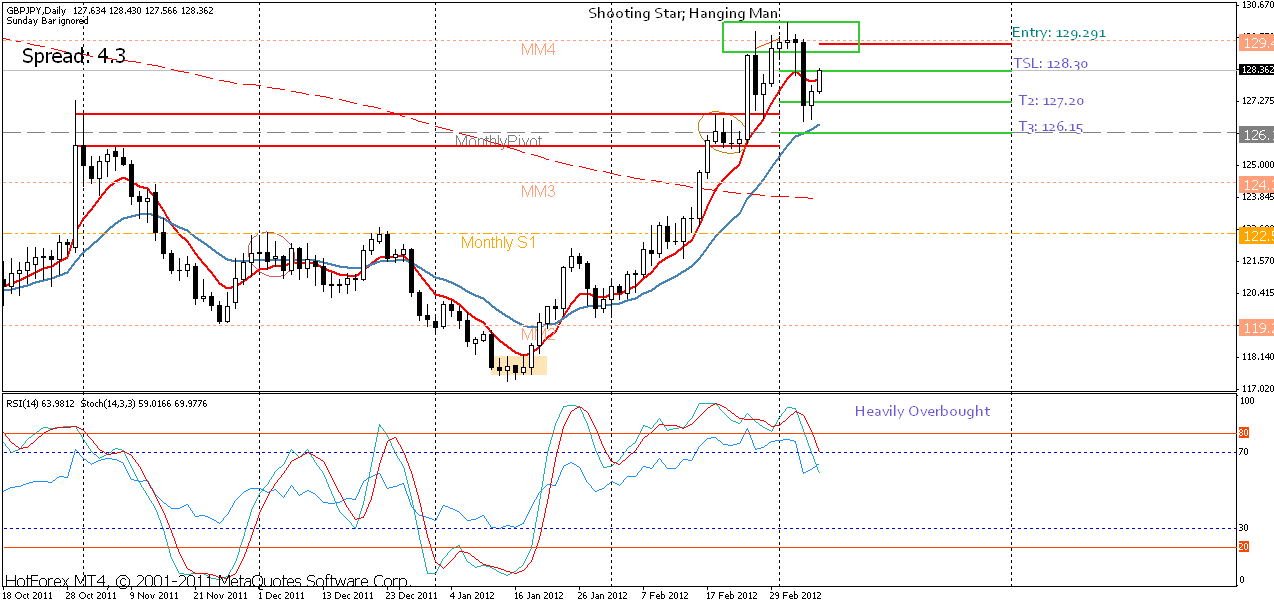
GBP/JPY Sell trade hit the second TP @ 127.20 (+209.1 Pips. I trailed SL to the first target @128.30.
Well done! This pair has gone on to display a large Outside bar, about 299 pips or so, big move. Nice spotting GicaEric!
The USDCAD kept going through the round numbers and closed above the 1.00000 area.
The GBPCAD did move up and test the the 1.58000 area, this allowed some pips to be taken off the table, however the pair then receded back below the 1.57500 area and the daily pivot point, it will be interesting to see where price decides to go from here.
Possible sell trade on the EURUSD. Price has formed a nice looking Engulfing pattern, which pushed lower and closed below the daily pivot point. The EUR is looking weak and USD strong. This setup is in favor of the trend continuing lower. If you were to look at the weekly time frame you can see there is also an Inside Bar that is in favor of the daily time frame.
Technically that’s not called a Hammer. Hammer’s occur only in downtrends, this Candlestick Formation is called Hanging Man, however it’s purpose signal is Possible Reversal. So yes, I would say this is a good trade, though if you’d entered this deal yesterday noon it would have had a better Risk/Reward profile. However, don’t forget to apply Money Management rules.
Thanks Obie. EURUSD seems attractive though I wouldn’t touch it for now. That [B]1.3000 - 1.3100[/B] looks kind of messy if you ask me, lots of reaction. However, that Weekly Candle Formation (Dark Cloud or Inside Candle) is very lurking :15: !!! -Let’s see how things play out over the following sessions.
I will be sitting on the side lines today. There are several major news releases due out and the market seems a bit indecisive.
The GBPCAD continued to move lower closing just above the 1.57000 area. The pair looks to be pushing lower.
The EURUSD tested the 1.31000 area, moved higher, and then closed back below the 1.31500 round number. I am still short this pair with an entry off the engulfing pattern.
Update: My SL was hit on the EURUSD trade not long after posting, trade closed for - 40 pips.
GBPJPY started to retrace since yesterday hitting my trailing stop @128.30(+99.1 Pips). Nonetheless, we made some nice profit out of this one. Here are the stats:
Thanks Obie. I have a nice setup on GBP/CAD but due to tomorrow’s heavy report ‘traffic’ I’m not planning on trading. Though I have to mention what I’ve missed:
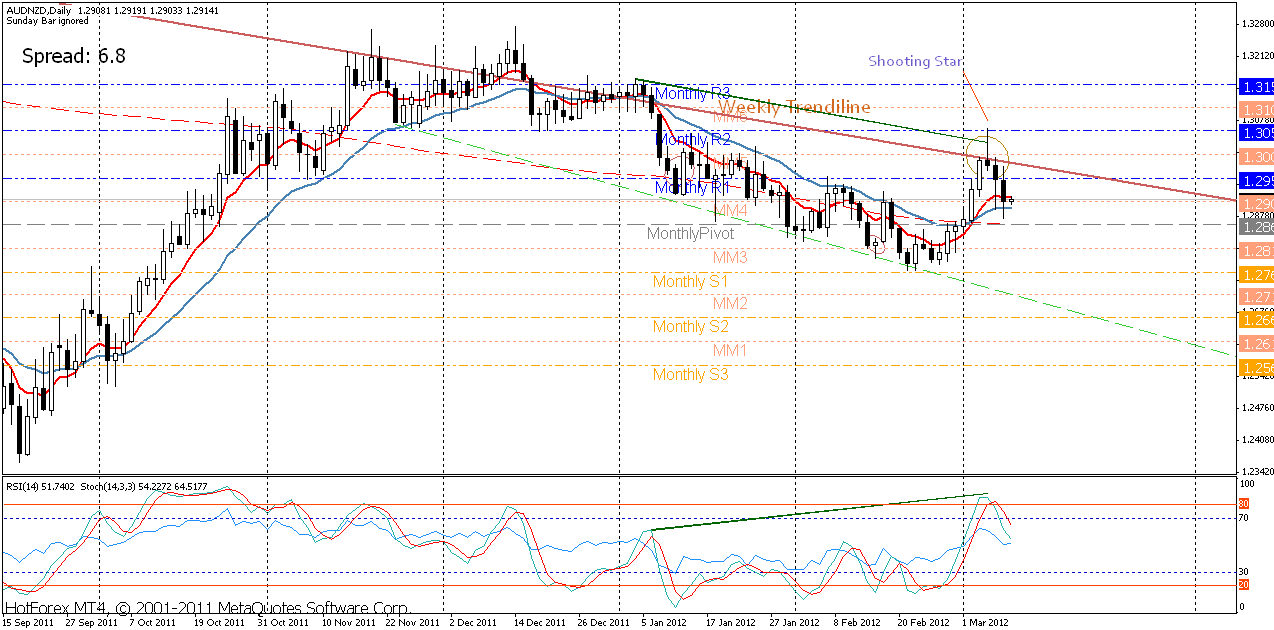
AUD/NZD chart, with a perfect confluence of a Shooting Star & Falling Trendline & Neg. Divergence, on top of that I had a nice R/R profile.
AUD/NZD chart, with a perfect confluence of a Shooting Star & Falling Trendline & Neg. Divergence, on top of that I had a nice R/R profile.
That looked like a nice setup indeed GicaEric. Nice shooting star at the top of the swing high, bounce off the 1.30500, fall back and close below the 1.30000, break of the uptrend from the previous swing low on the 27/02/12, with nice R:R, yup I like it.
Hello GicaEric… How you doin ?
Well, i have been searching for trading strategies, i have found some, but it wasn’t of my style. I cam back to your thread (the first thread which i have checked). I will be trading this strategy as it suits me much better ( set and forget style suits my trading style as i get frustrated with scalping and such strategies). And i would really like to tell you that i was amazed to see the previous charts, where i saw perfect reversal’s n continuation’s with candlestick patterns exactly at the S&R’s. They were perfect, what i learnt is that, let it be any strategy, all you need is patience and that’s all. I will be posting my charts here from monday. I would love to trade to trade under your mentorship…
I’m happy for you man. I’ll help you and everybody else as much as I can through my analysis and trade setups. But in any case I’m no proclaiming myself to be mentor or a teacher. I’m a Forex Trader that’s all. I post what I see and what I interpret. I won’t be 100% accurate, but I firmly believe that as long as a trader exercises money management rules, he/she shall be successful.
So for anybody following my trades, I suggest you don’t follow them unless you understand money management principles. Never in any case overleverage your accounts or you’ll perish.
My MM rules are simple:
Max. Risk Benchmark/Trade: [B]2.5%[/B]
Max. Risk at a given time: [B]20% of Balance[/B]
[B] Determine Risk/Reward profile. —[/B]
a) 1:3 - 1:(infinity) — [B]Golden Profile[/B]
b) 1:2 - 1:2.9 — [B]Silver Profile[/B]
c) 1:1 - 1:1.9 — [B]Bronze Profile[/B]
d)* 1:0.5 - 1:0.9 — [B]Losers Profile[/B]: Risk: [B]1%[/B] -If strong fundamental data confirmed
or Risk: [B]0.5%[/B] -If strong sentimental data confirmed
Then risk according to your Risk Benchmark. But I don’t suggest you risk more than 3% on any given trade and don’t exceed your overall risk exposure to [B]20%[/B]. That’s it.
Have fun and have a nice weekend. I hope next week we’ll have better chances.
Well, i have been searching for trading strategies, i have found some, but it wasn’t of my style. I cam back to your thread (the first thread which i have checked). I will be trading this strategy as it suits me much better ( set and forget style suits my trading style as i get frustrated with scalping and such strategies). And i would really like to tell you that i was amazed to see the previous charts, where i saw perfect reversal’s n continuation’s with candlestick patterns exactly at the S&R’s. They were perfect, what i learnt is that, let it be any strategy, all you need is patience and that’s all. I will be posting my charts here from monday. I would love to trade to trade under your mentorship…
Good for you gs8888. Some people never realize the importance of staying with a trading method and mastering it.
I myself trade a similar style to GicaEric using Support and Resistance, Trend Lines, Candlestick patterns (price action) with strict money management rules, and it has proved to be a profitable way of trading, for me anyway. As you have observed the setups are there and they work, with patience and practice you will get there.
Its not trading that’s hard, its following the rules that can be challenging. Discipline can be elusive, but it is something you require to be successful at trading. You have to understand there is no holy grail, as GicaEric has already pointed out, there will be times when the trade just does not go your way. This is part of the business. You have to stick with it through thick and thin. Discipline.
Hello GicaEric and Obie. Thnx for your valuable replies, that really helped me out. Well, i tried following some other strategy before, which is entering a trade on breakout,pullback and continuation theme. Though it was profitable, but it wasn’t of my style. Later on, as i said, i was in search of holygrail’s. Which dint work out at all.
Being a newbie, I have few general questions.
How often do you check your trades, whenever i enter a trade, i check that very frequently and whenever it is in negative, i feel so emotional and i close the trade. This happens everytime with me.
Are u a full time trader ? If so, wt do u do after u open a trade and when u have to wait all the day ? I study some tutorials or some blogs in my spare time or when i open a trade, out of curiosity i just wanted to know what senior traders like you do ?
what are all the pairs that you follow ? Is it all the pairs that are listed ?
are there any that we should follow during the time we execute a trade ? I mean during the major news release, it is always better to stay on the sidelines, so is there anything else that i should watch out for apart from the technicals ?
Do u usually enter a trade on Monady’s or Friday’s ? Causei heard that Monday is mostly a correction day and on friday, market is less volatile…
Nowadays, I heard a guy in America published a book about his findings. And what’s funny about it is that he’s certain that the Holy Grail is in America. Somebody may have brought it there during the 14th Century’s discoveries, maybe from Columbus or Vespuchi. Anyway I thought this is funny.
How often do I check my trades? - Since I’m trading on Daily Timeframe, I check them on the morning when London opens, around NY open and NY close. I mostly focus on the NY close and Melbourne open a couple of hours earlier to prepare my charts, make a list for the upcoming days news releases, read geopolitical discussions, look for GOLD & OIL prices, look for fundamental development, and if I have something on the line to trade, I then asses Risk Profiles. [I]One thing you should never do is place trades without Stop-Losses. Never ever do such a thing![/I] - Well the reason is obvious but, how could you determine risk exposure if you don’t put stops? - You just can’t! -So once you’ve entered a trade, you put your stop loss and then manage the trade. Only exit if you get a counter signal (which is very rare, recently happened on my last USD/CAD Sell trade, which I ignored a counter signals) or the fundamental arena have changed.
Yes I am a full time Forex trader. After a enter a trade, I do the routine stuff like in the answer (1), besides that, I manage the trade that I’ve put, if 1st target was hit, I put stop-loss to break-even, if the second target was hit, I put the stop-loss to the first target. But here is an interesting thing. If you trade in this manner, you’d have plenty of time. On average I spent 4 hrs max. on Forex. Well then you can say this isn’t full time, well it might not be, but since I don’t have any other job, this, I consider to be a full-time job for me. So what I do on the spare time? - I do just about anything I want, I’m a guitarist, I tend to spend a lot of time playing guitar, I have my family, spend time with them, go out and have fun etc etc.
I trade all the pairs that my broker provides. Normally you don’t wanna do that if you’re day trading or even mid-term trading, but Daily Timeframe gives you lots of flexibility. I consider trading from Daily timeframe like trading in Ultra-Slow-Motion, you know what I mean, Matrix style .
As I’ve said, I make a list of the upcoming news releases, and manage my trades accordingly. But, we’re talking about 100-200 Pips range, so normally, the majority of the releases don’t have that immediate impact 200 Pips spike. You just have to be careful around Non-Farms, Rate Decisions, GDPs, GBP’s Asset Purchase Target, Employment/Unemployment Changes. I’m talking about major releases. But believe me, Technical has the best insight.
Well, I enter trades whenever I see them fit. You may be right about Monday & Friday, but as far as I know, Statistically speaking, Wednesday is Reversal day, and Friday is Unpredictable Day. On some Fridays, market’s dead, on some other (like the last one) you see +150 pips spikes. So usually, I don’t have any particular day that I do or do not trade. I See a possibility, see if it’s in check with my rules and go for it.
the Red color line is the EMA(21) abd the blue line is EMA(8)…
Yellow line is 200 SMA
And yellow horizontal line ( support turned resistance)
Im able to plot the support and resistance zones whereas Im not able to locate the Monthly pivots with middle lines, could you provide me any link for the indicators or anything like that .
There you go. An MT4 Pivot Point plotter. Basically you load into your …/experts/indicators folder and use just like any other indicator. Pretty easy to use as well.
Just so you know, I haven’t made this indicator. I know for sure that I’ve downloaded it from this site, though I couldn’t find the guy’s name to give credit to. So thanks to whoever made this indicator.
 . Though be careful on
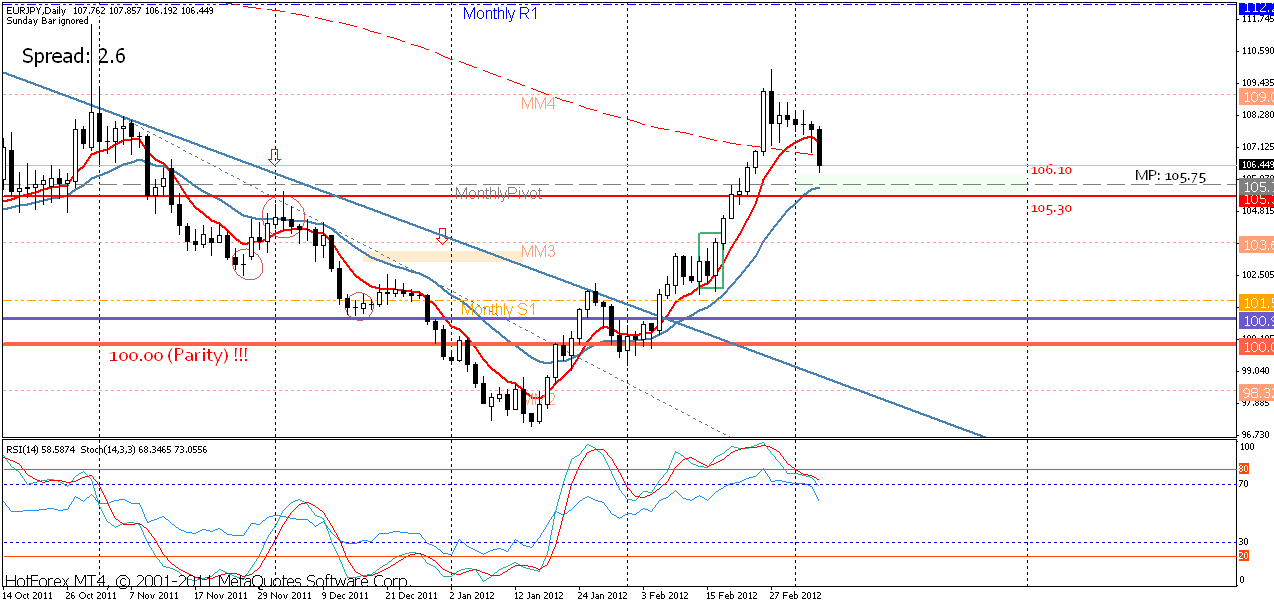


 .
.