Hi, its not my intention to hijack your thread, I wish to contribute where I can. A possible sell setup on the USDCAD D1. As you can see in the example there is a nice Pin bar, suggesting exhaustion, followed by a decent engulfing bar. The engulfing bar bounced off the R2 area, closed below the daily pivot point and the round number of 0.99500. Another reason to sell is the USD is weak against all other currencies today. What do your charts say GicaEric? Cheers
Sure thing obie, contribute as much as you can. Here is my analysis & setup for this pair.
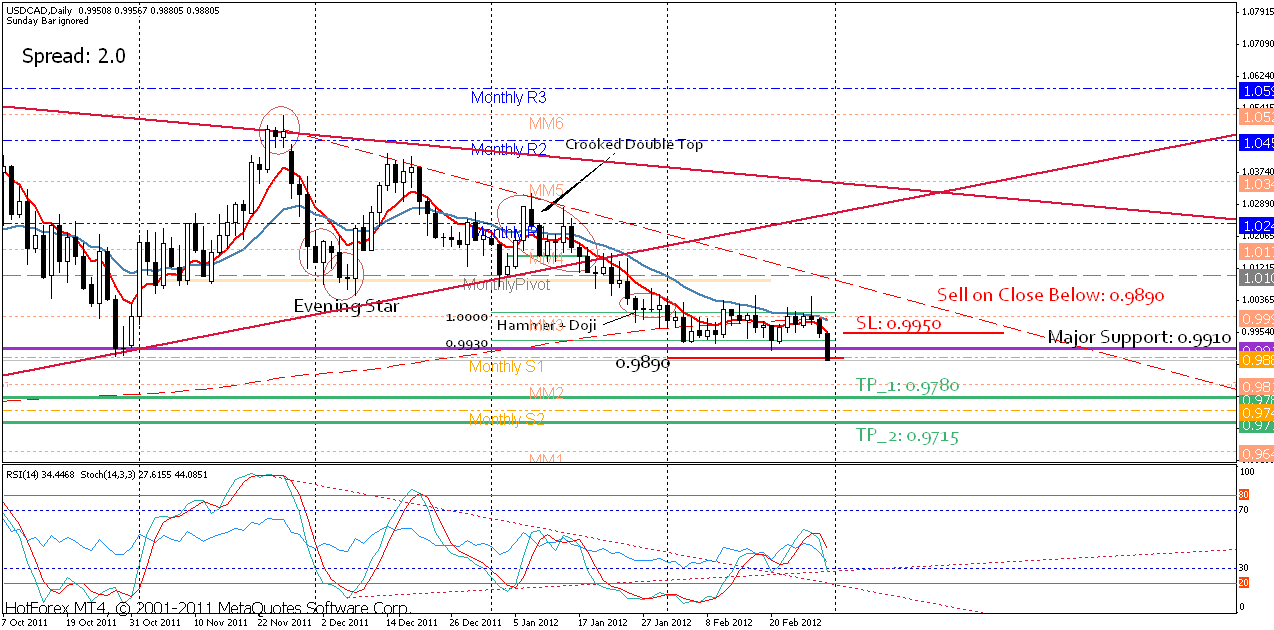
As we all know, the tension on the middle east put some pressure on USD due to unreliability of Oil Prices that may be flying if Israel decides to hit Iran (I hope not). Gold & Silver on the other hand, is flying since the beginning of 2012 which is negative Dollar indication. So I’m planning a short setup on USD/CAD.
Chart:
Setup:
Entry: Sell on Close Below 0.9890 (Alternatively you can wait for a pullback on 0.9890
SL: 0.9950 (If volatility is high, I might increase the SL to give us some room)
TP_1: 0.9780 (Significant Support Level)
TP_2: 0.9715 (Significant Support Level)
Risk: 2%
Risk/Reward: Depending on the entry, though it shouldn’t be more than 1:1
Have fun everybody. Thanks for your input Obie, please contribute more if you can.
Disclaimer: TRADE ON YOUR OWN RISK. THIS RECOMMENDATION IS MEANT FOR LEARNING PURPOSES ONLY.
A possible sell setup on the USDCAD D1. As you can see in the example there is a nice Pin bar, suggesting exhaustion, followed by a decent engulfing bar. The engulfing bar bounced off the R2 area, closed below the daily pivot point and the round number of 0.99500. Another reason to sell is the USD is weak against all other currencies today.
Price did certainly continue to move lower with a nice push through the 0.99000 area where it finally retraced and closed, just below the round number. I will be interested to see how much lower the price can go, GicaEric. Here’s hoping it will continue to push lower for ya!
A possible buy setup on the USDJPY D1. There is the formation of an Engulfing bar with the a previous form of exhaustion that bounced perfectly off the 80.000 round number. The USD is showing strength today and this may be a signal that the uptrend will resume.
Both targets hit! Didn’t they?  - Good Job.
Both targets hit! Didn’t they? - Good Job.
Hi mate, yeah full take profit area was hit, +44 pips or so. Thanks!
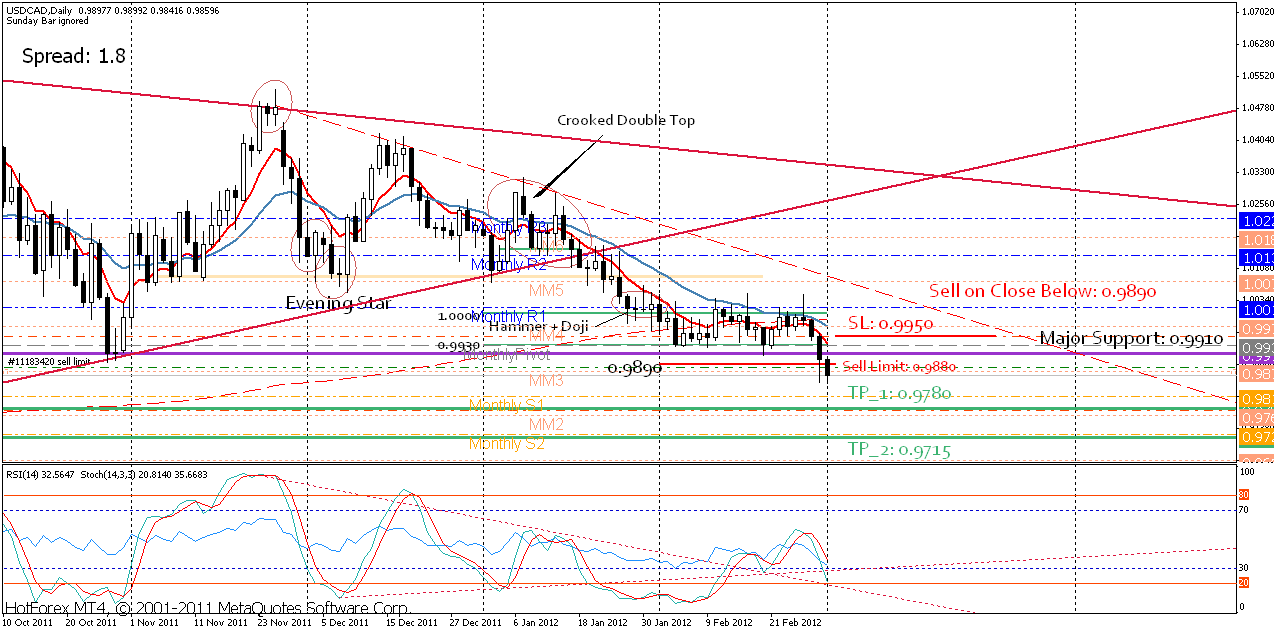
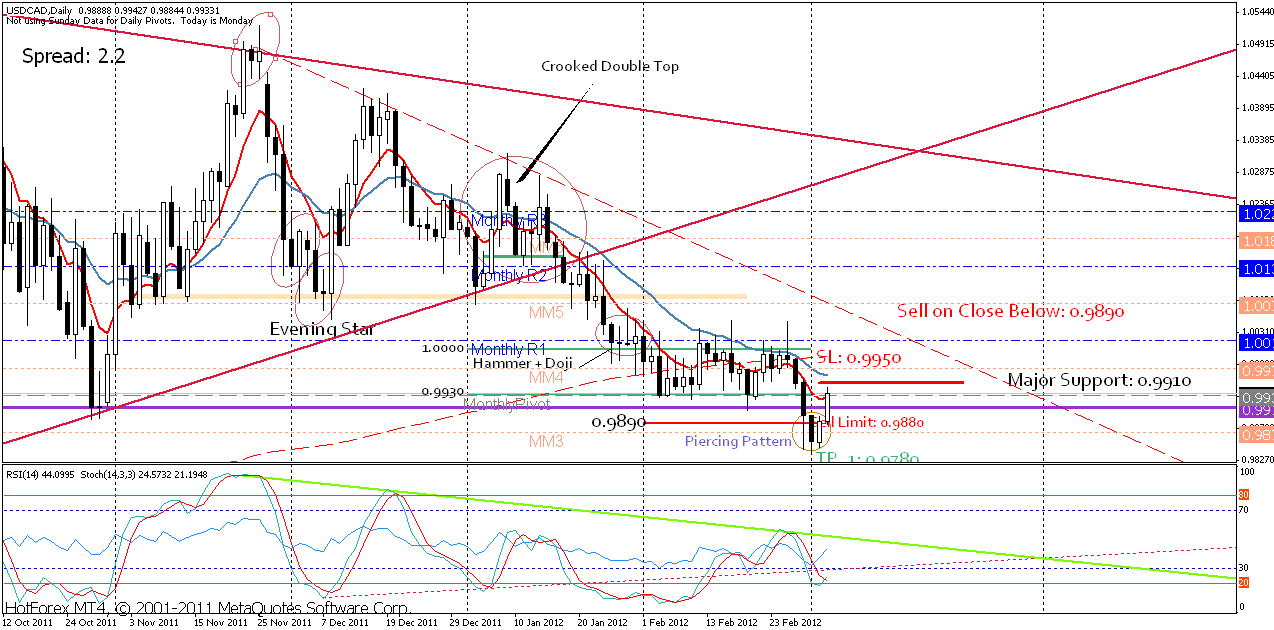
Finally seems like the 0.9910 Major Support Level broke. Here is the detailed setup.
Chart:
Entry: Sell Limit @ 0.9880
SL: 0.9950
TP_1: 0.9780
TP_2: 0.9715
Risk % = 2
Happy trading & have fun.
Disclaimer: TRADE ON YOUR OWN RISK. THIS RECOMMENDATION IS MEANT FOR LEARNING PURPOSES ONLY.
Just informing that the sell limit trigered @ [B]0.9880[/B].
Have fun.
Just informing that the sell limit trigered @ 0.9880.
It looks like price bounced off,retested, the 0.99000 area. This area may hold, here’s hoping, if you look to the left of the chart you can see the area acted as Support and Resistance with several bounces around the 0.99000 level. The CAD did end the week strong, which may help to push the price lower.
A possible buy setup on the USDJPY D1. There is the formation of an Engulfing bar with the a previous form of exhaustion that bounced perfectly off the 80.000 round number. The USD is showing strength today and this may be a signal that the uptrend will resume.
I closed this trade manually prior to the weekend, return of +73 pips or so. The pair had moved beyond its average range, 79 pips at the time of closing the trade, average about 61 pips. I think I missed the full TP area by about 10 pips or so. Anyway another good trade!
Looking forward to Monday GicaEric, lets see how it pans out…
Indeed Obie. Truth to be told I’ve missed a dozen of nice trades over this period. It was a nice opportunity on EUR/USD and USD/CHF a friend of mine made some nice profits, I’ve also missed the GBP/JPY rally. My health is bullying me for over a month now, I haven’t been able to focus. I’m afraid I won’t to be fully engaged for a couple of weeks.
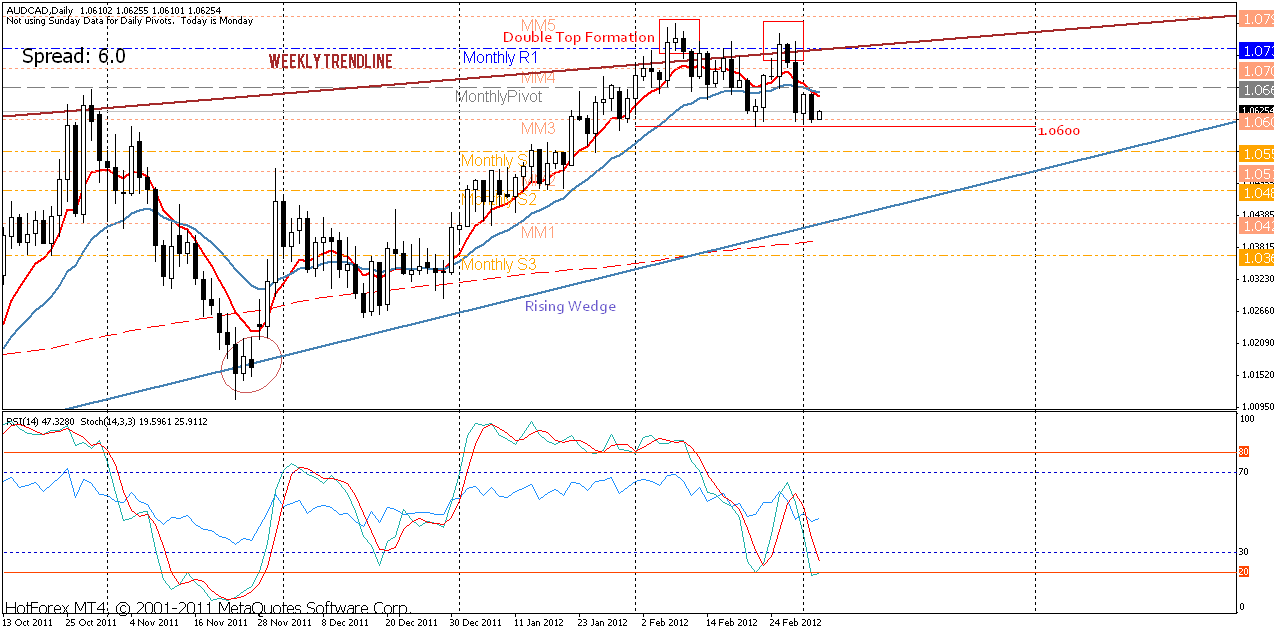
Anyways, this is what I’ve been looking out lately. AUDCAD has completed a nice Double Top formation. I’m waiting for a break under 1.0600 for a bearish trade. Further setup details later.
Have fun and get sharp guys.
P.s. Good job on USD/JPY. I think your targets met If I’m not mistaken.
Seems like tha price has retraced and in the direction of hittin SL…is this because of the bernake’s speech ?
CAD showed some strength n friday closing but USD gaining against CAD.
It could be, however I don’t think the Bernake’s speech made any huge impact fundamentally speaking. He didn’t say much either. But who knows fur sure?!
Technically speaking, for the moment the [B]0.9910[/B] level seems to be holding. And as a sideways note usually prices tend to retrace on Monthly Pivot rather frequently. I strongly believe that the Pivot Line will become support to the downside. So, fingers crossed, let’s see how things play out.
Though if you have any additional info about the Bernake’s speech, please inform us. Thanks.
Have fun.
Interesting thread, I have been lurking for a few days. Just to put one thought into the USD/CAD discussion - I went long this morning, at 0.9902, based on the inside bar on the Daily, divergence on the 240, few other things, it’s a counter-trend trade but I’m thinking (hoping lol) that we get some sort of retracement, for what it is worth. This Pair has been choppy, recently, though so I have not traded it much.
ST
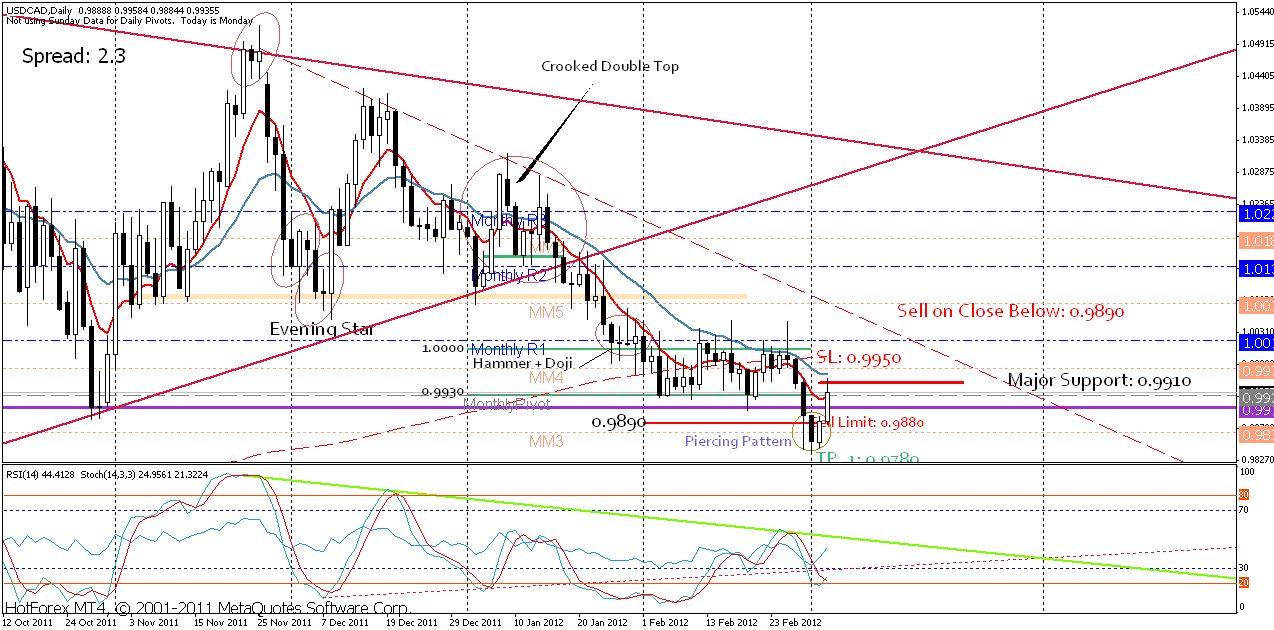
Actually you did very good. The Thursday & Friday Candles formed a nice Bullish Piercing Pattern. For a short term trade the idea is golden I think. Good job.
Have fun.
price has hit my SL…trade closed
USDCAD Sell trade hit the stop. The price is being congested in that 0.9900 - 1.0000 area. Maybe we’ll get the chance to get back on-board on the short side depending on the price action.
Entry: 0.9880
SL: 0.9950 — (-70 pips x 2 separate orders = -140 pips, account wise -2%.
Chart:
Cheers.
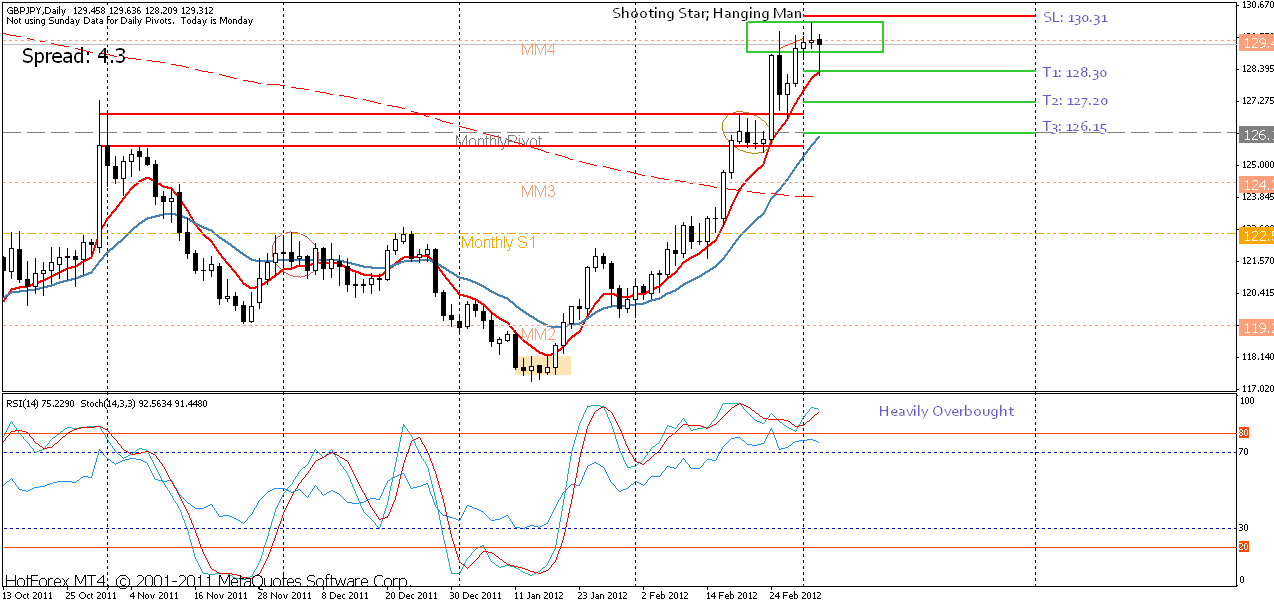
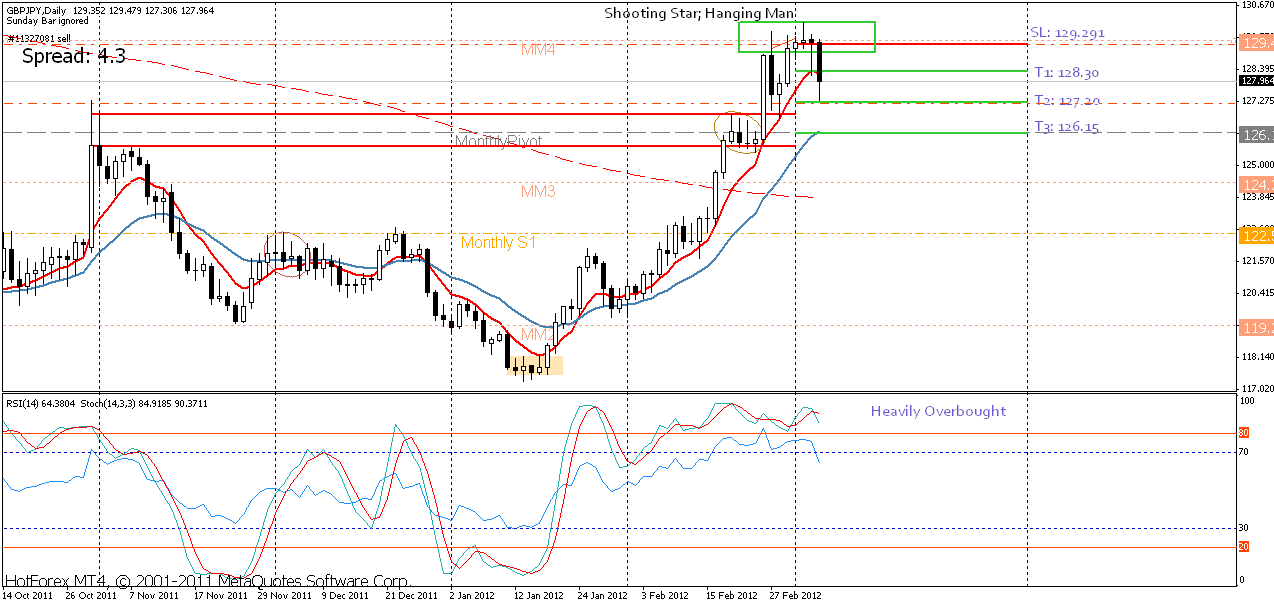
This is my latest trade. Price seemed to have stalled thus forming a couple of Candlestick Patterns. A Shooting Star & Hanging Man signaling a reversal maybe ahead. I’ve entered a short trade immediately @ 129.29. If you want to wait for confirmation that’s up to you. Though this is just a suggestion.
Entry: 129.29
SL: 130.31
TP1: 128.30
TP2: 127.20
TP3: 126.15
Risk: 2%
Chart:
Cheers.
Disclaimer: TRADE ON YOUR OWN RISK. THIS TRADING RECOMMENDATION IS MEANT FOR LEARNING PURPOSES ONLY.
USDCAD Sell trade hit the stop. The price is being congested in that 0.9900 - 1.0000 area. Maybe we’ll get the chance to get back on-board on the short side depending on the price action.
Entry: 0.9880
SL: 0.9950 — (-70 pips x 2 separate orders = -140 pips, account wise -2%.
As long as you are following your rules then this was a good trade!
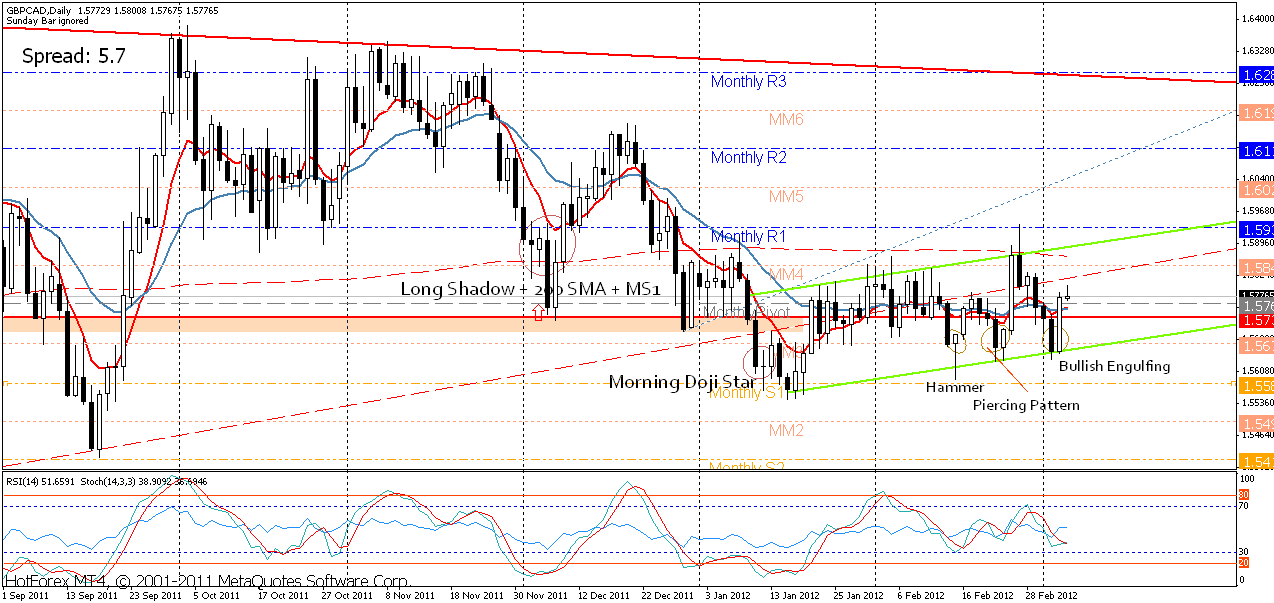
Possible buy trade on the GBPCAD, a nice looking engulfing pattern with a bounce off the 1.56500 round number. My main concern is the 1.58000 round number being near to the close of the engulfing candle, price may find resistance in this area.
I went long this morning, at 0.9902, based on the inside bar on the Daily
Price did bounce nicely off the 98.500 round number and form an inside bar at the bottom of the swing low. Again the round number is coming into play and price may have trouble breaking the 0.99500 area. Either way your trade should be in the profit area, good job!
About USD/CAD. Truth to be told Obie, I though of closing my half of position on Friday evening because of that Piercing Pattern (Inside Candle) looked very suspicious of a possible reversal. But then the 0.9910 was broken even though now I realized that Wednesday & Thursday candles had the same lows thus a Tweezers Bottom formation, on top of that, the Thursday & Friday candle made a nice Inside Candle which played the reversal pretty well. FOCUS! At least I’ve learned something.
GBP/CAD on the other hand, since that Morning Star formation, the price has been locked on a congestive band area and sure as hell looks very messy. Although the upper band line seems to coincide with the 200 SMA in which case I think that would be a nice target or it would be nice area to put some shorts around 1.5850 - 1.5880. Personally, I’m aside this opportunity. It’s true there couple of reasons to go long, but the RISK/REWARD profile is ugly I think.
Thanks Obie for your insights.
Have fun.
Hi Eric,
Thank you for the response. I’m still in the USD/CAD long, it’s running well, sorry this Pair gave you a hit, I could see the case for both directions. Your response prompts a question, though, if you don’t mind: how would you define a ‘Piercing Pattern’? I had a number of reasons to enter the trade, and am a technical trader, but I have not come across that term before.
ST
GBP/JPY as expected triggered a nice dip. Target 1 hit @ 128.30 (+99.1 Pips. SL moved to break even @ 129.291. The priced moved and almost hit the second target as well for 10.6 pips. Anyways no reason to close our deals for now.
Chart:
Have fun.
