Cocoa (or cocoa bean) is one of soft commodities, along with sugar, coffee, orange juice and cotton. The bean is the fully dried and fermented seed, wherefrom cocoa solids and cocoa butter can be extracted. Cocoa beans are the basis of the chocolate. One can trade Cocoa futures at ICE owned New York Board of Trade in contracts of 10 metric tons each under the ticker CC #F. Also, there are similar contracts at CME owned NYMEX under the ticker CJ #F.
Currently, we see other soft commodities like coffee and sugar turning higher after a long period of depressed prices. Based on the correlation within group of softs, the cocoa seed is expected to turn higher as well. In particular, wave structure of CC #F supports that bullish view. Will the rally in the cocoa make the chocolate less affordable for the broad population?
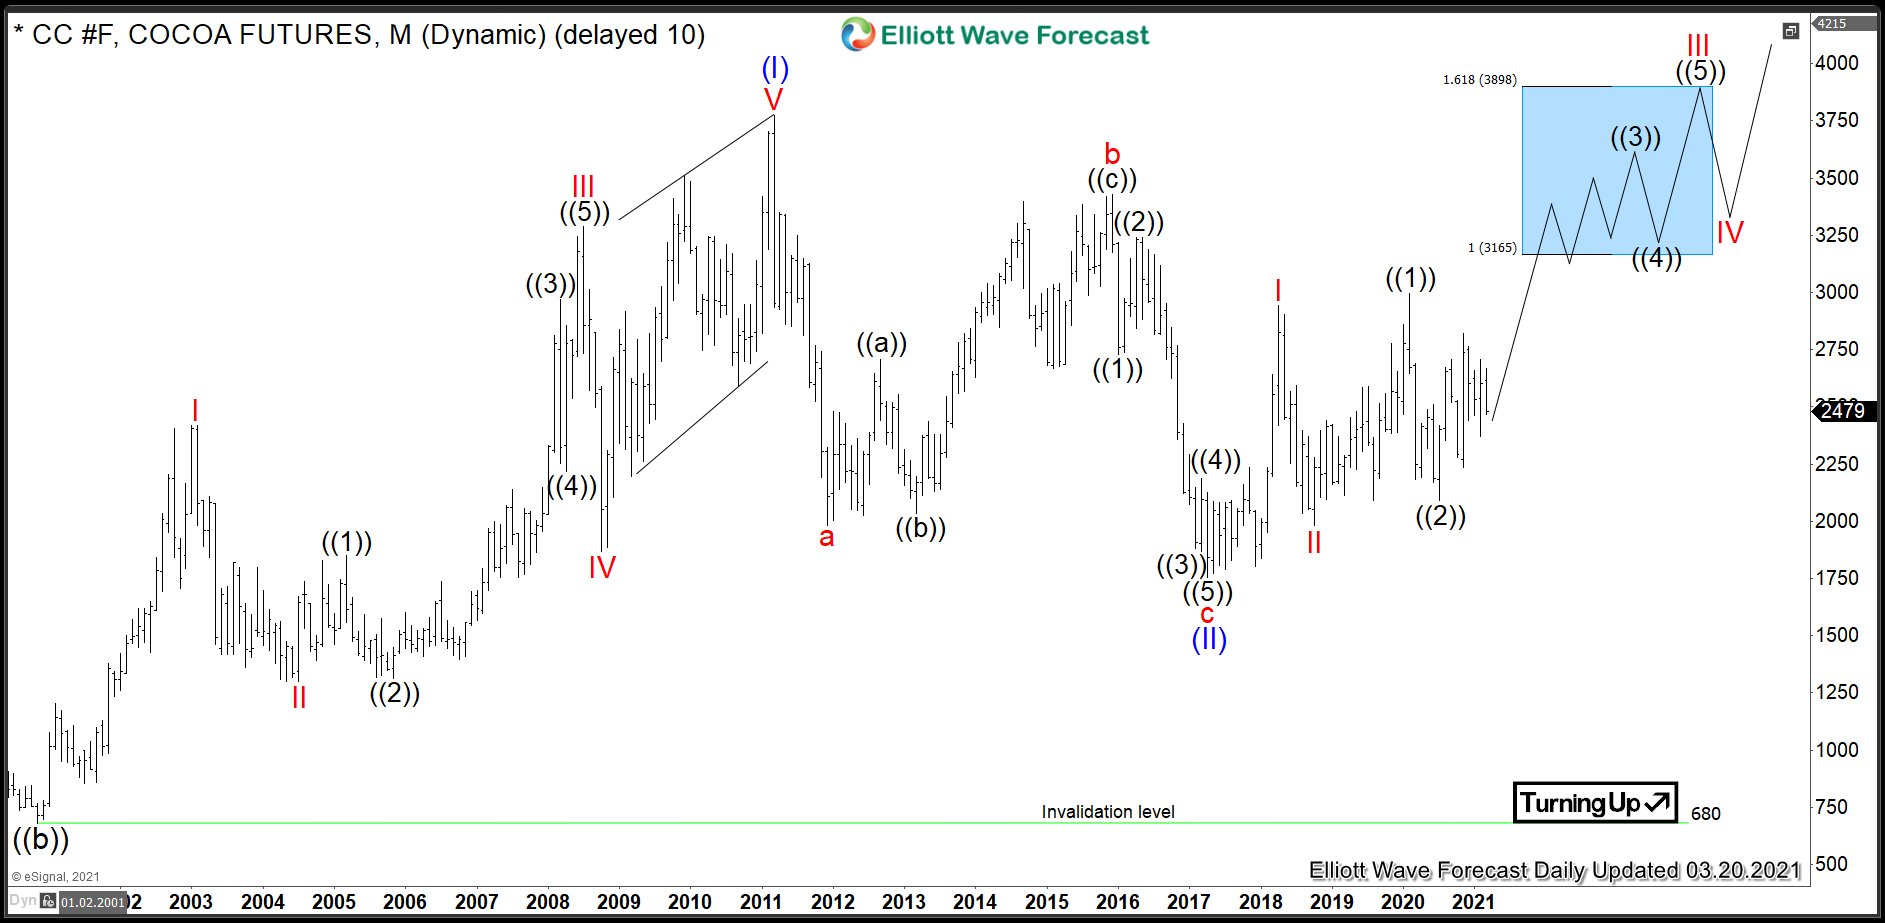
Cocoa Monthly Elliott Wave Analysis 03.21.2021
The monthly chart below shows the cocoa seed front contract CC #F at NYBOT. From the important low in November 2000, the prices have developed a cycle higher in blue wave (I) of a super cycle degree. Hereby, wave (I) has demonstrated a leading diagonal pattern and has ended in March 2011 at 3775. From the all-time highs, a correction lower in wave (II) has unfolded as an Elliott Wave zigzag pattern. In 6 years, CC #F has become cheaper by more than 50% reaching 1756 level. It is the preferred view that an important bottom on April 2017 has been set and the correction has ended. From the lows, a new rally in prices within blue wave (III) may have started.
For 2021-2030, the expectations are to break to the new all-time highs. The target for wave (III) will be 4842-6753 area. From current levels, the cocoa seed can, therefore, double in price.
From the April 2017 lows, the advance higher is showing red waves I and II. Then, a higher high within a new cycle in red wave III, so far in black wave ((1)), has not reached yet the equal legs extension area towards 3165-3898. Therefore, while the price remains above 1982, the bullish sequence will push the price higher.
In shorter cycles, waves ((1)) and ((2)) have ended. Currently, wave ((3)) of III may be already in progress.
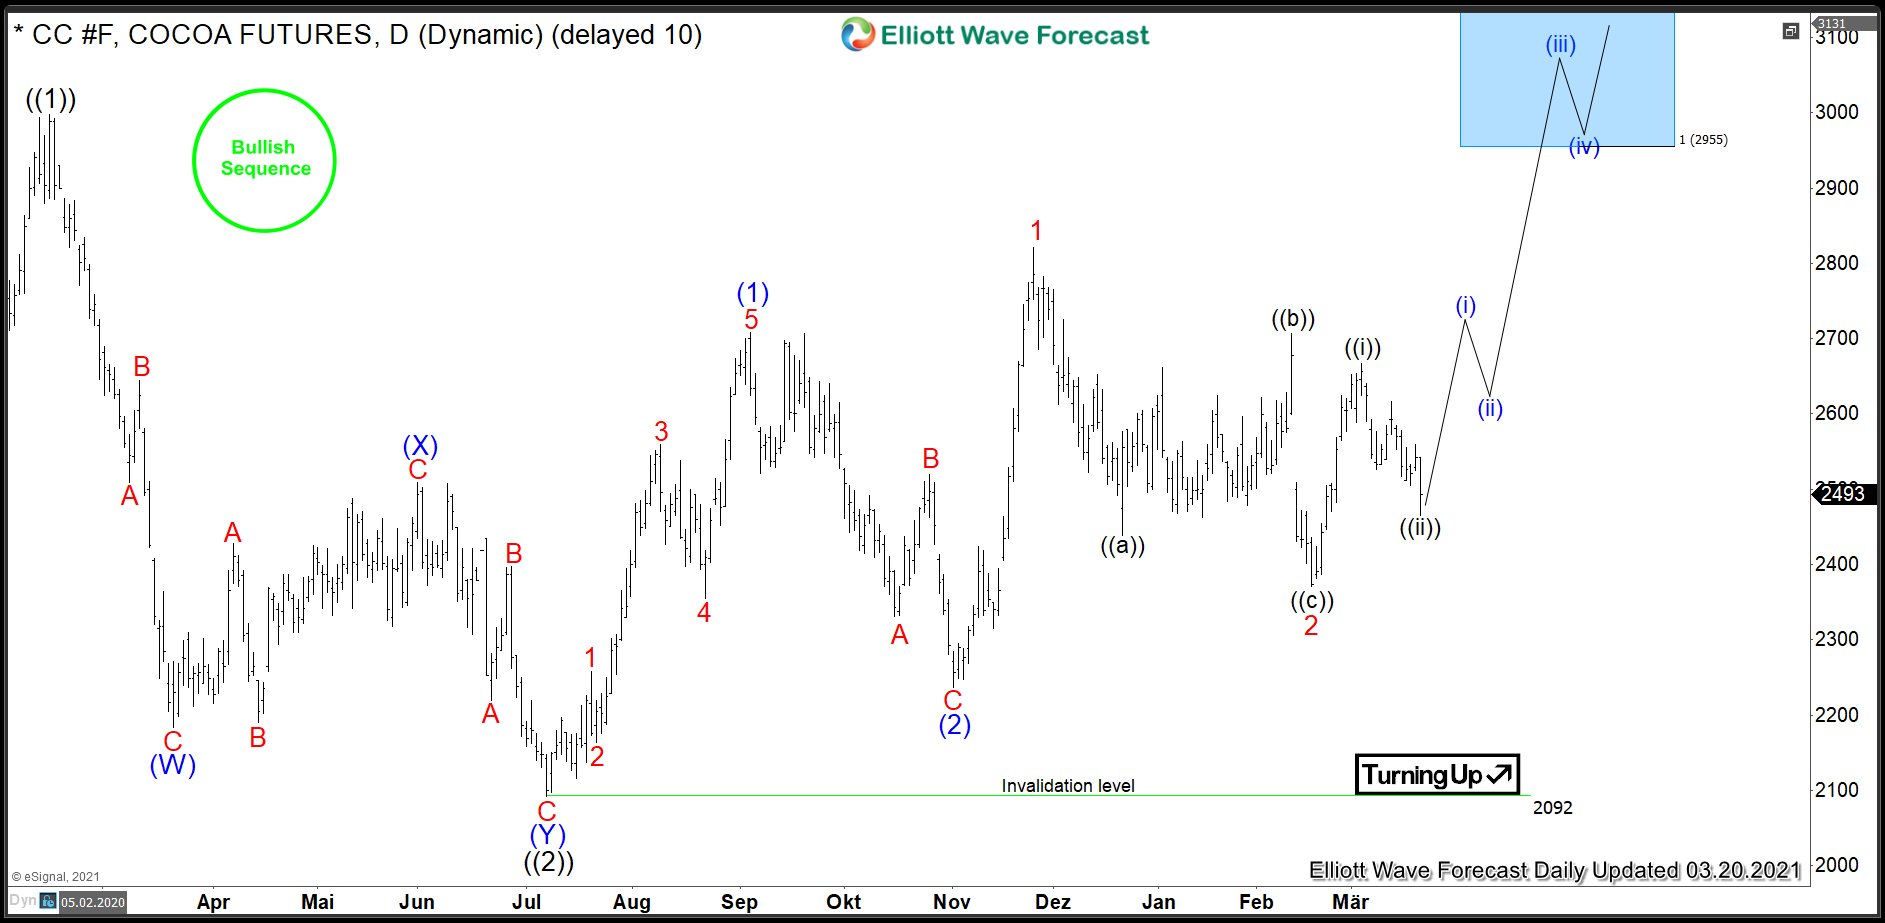
Cocoa Daily Elliott Wave Analysis 03.21.2021
The daily chart below shows in more detail the advance from the July 2020 lows where wave ((2)) has ended. From the bottom at 2092, one can obeserve two nests higher building another bullish sequence. Now, while above 02.17.2021 lows at 2371, red wave 3 can reach towards 2955-3317 area and even beyond.
Investors and traders can be, therefore, looking to buy pullbacks in 3, 7 or 11 swings from the extremes. The targets are 2955-3317 in short term, 3165-3898 in medium term and 4842-6753 in a long run.
Source: $CC #F: Bullish Sequence to Push Cocoa Prices Higher