Cocoa (or cocoa bean) is one of soft commodities, along with sugar, coffee, orange juice and cotton. The bean is the fully dried and fermented seed, wherefrom cocoa solids and cocoa butter can be extracted. Cocoa beans are the basis of the chocolate. One can trade Cocoa futures at ICE owned New York Board of Trade in contracts of 10 metric tons each under the ticker CC #F. Also, there are similar contracts at CME owned NYMEX under the ticker CJ #F.
Currently, we see other soft commodities like orange juice, coffee and sugar in a new large cycle higher after a long period of depressed prices. Based on the correlation within group of softs, the cocoa seed is expected to accelerate higher as well. Since then, the price has continued oscillations in a narrow range bound market. From practical perspective, it provided a great opportunity to accumulate long position in cocoa beans before inflation will start. As a matter a of fact, prices have found an important bottom within mentioned blue box area and rallied to new all-time highs. We present the updated view, discuss cycles, sequences and price targets…
Cocoa Monthly Elliott Wave Analysis 10.28.2023
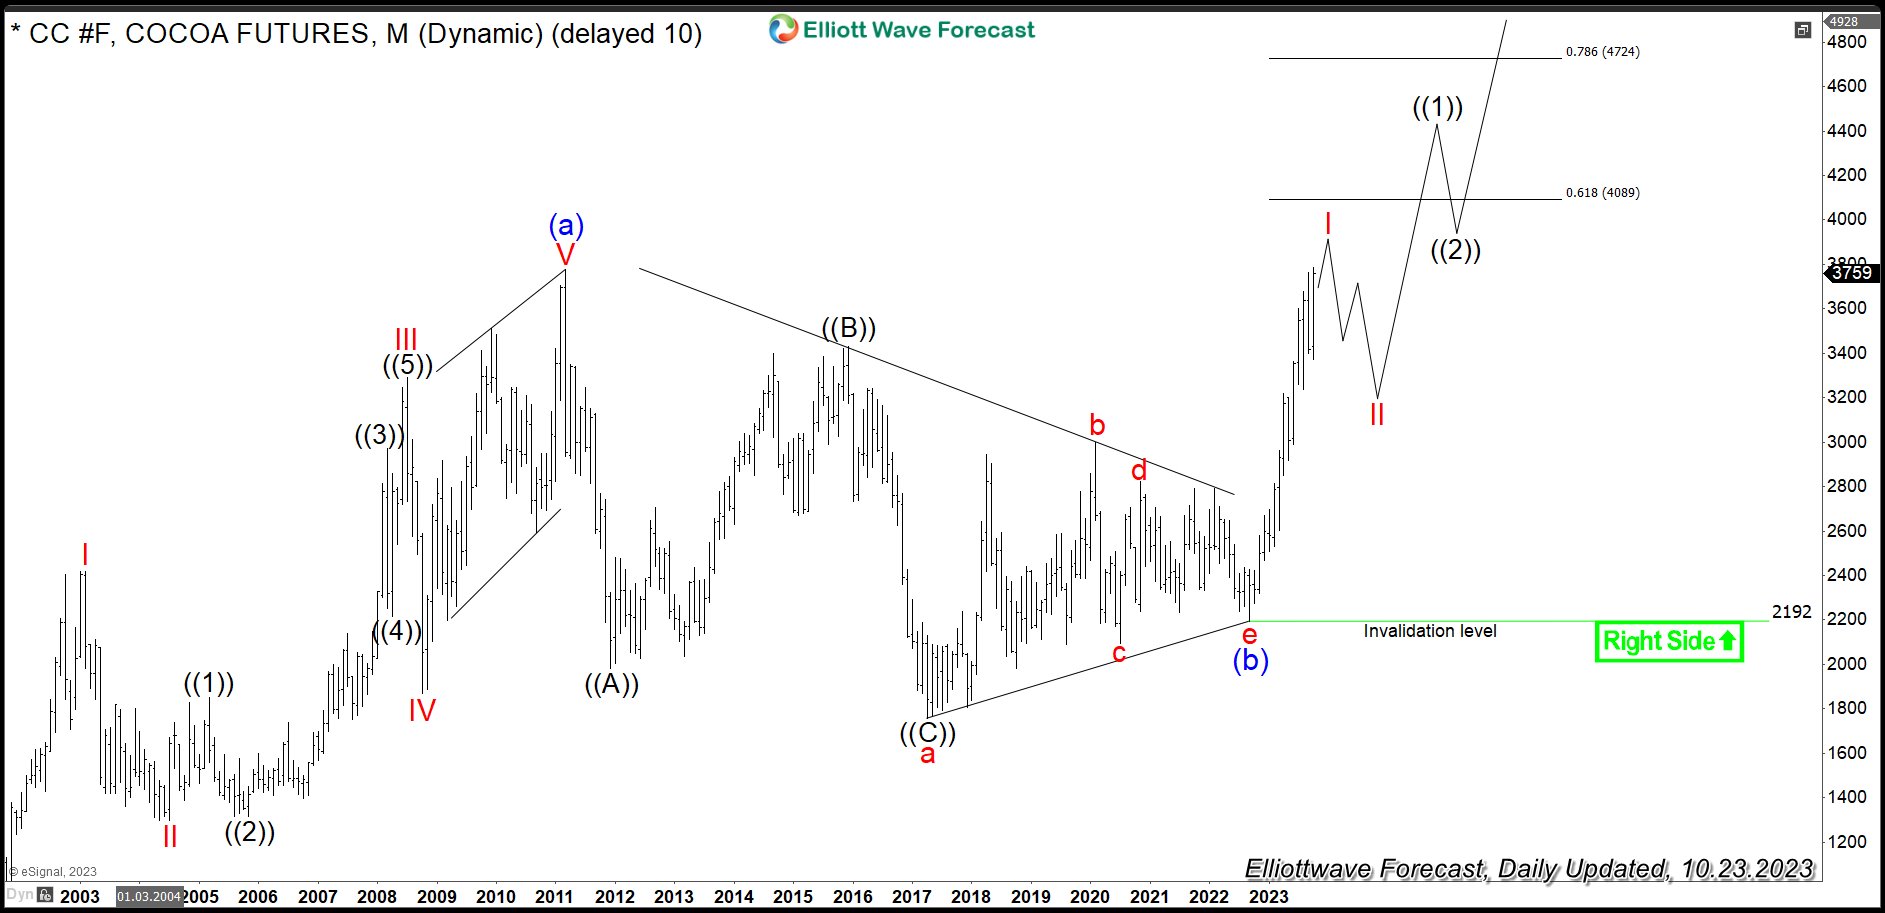
The monthly chart below shows the cocoa seed front contract CC #F at NYBOT. From the all-time lows, the prices have developed a cycle higher in blue wave (a) of a super cycle degree. Hereby, wave (a) has demonstrated a leading diagonal pattern and has ended in March 2011 at 3775. From the all-time highs, a correction lower in wave (b) has unfolded as an Elliott Wave triangle pattern being 3-3-3-3-3 structure. It is the preferred view that an important bottom on September 2022 has been set and the correction has ended. From the 2192 lows, a new rally in prices within blue wave (c) has started. Break above 3775 highs has confirmed that opening up a bullish sequence. Now, pullbacks should remain supported in 3, 7 swings against 2192 lows.
For 2024-2030, the expectations are to extend higher. The target for wave (c) will be 5532-7865 area. From current levels, the cocoa seed can, therefore, double in price.
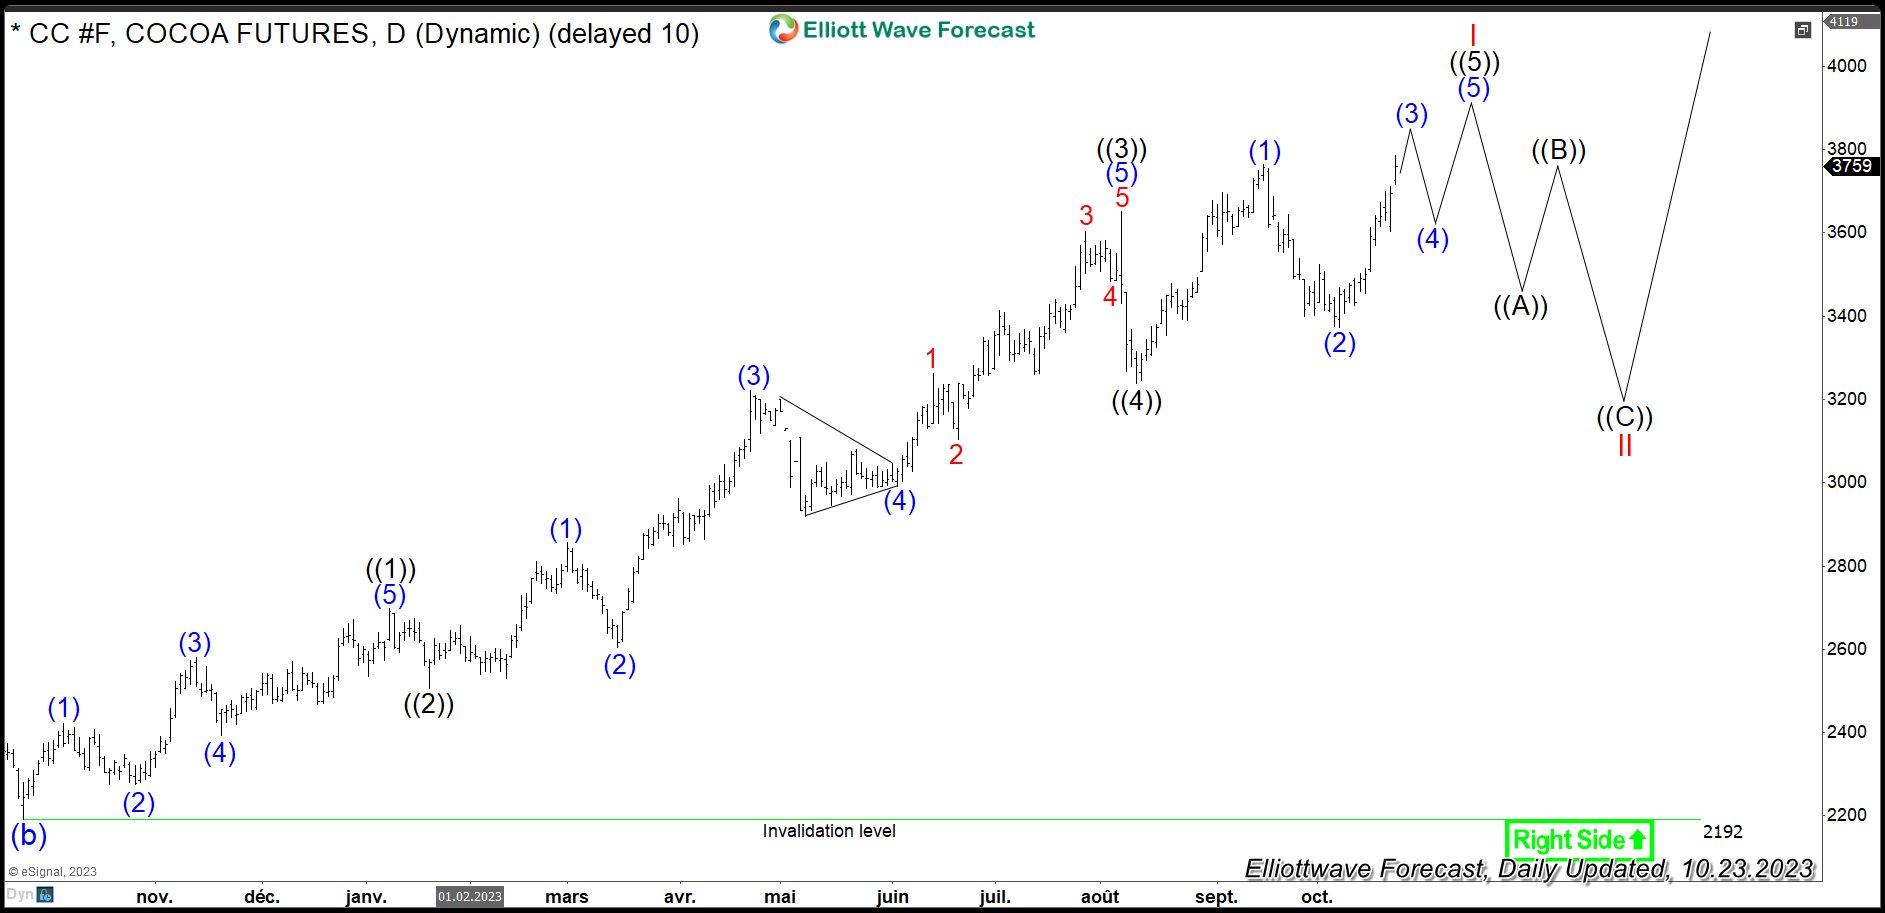
Cocoa Daily Elliott Wave Analysis 10.28.2023
The daily chart below shows in more detail the advance from the September 2022 lows where triangle in blue wave (b) has ended. From the bottom at 2192, one can observe an initial impulse in red wave I building up. Firstly, wave ((1)) has pushed higher and ended in January 2023 at 2699. Secondly, consolidation in wave ((2)) has set a low in the same month at 2507. Thirdly, an extended black wave ((3)) has reached beyond 2.0x of the wave ((1)). It has ended in August 2023 at 3652 highs. Fourthly, short-term pullback has set a bottom at 3237. Now, while above there, wave ((5)) is in progress and should unfold 5 subwaves higher to end red wave I. Once finished, red wave II should retrace part of the rise.
Investors and traders can be, therefore, looking to buy red wave II in a pullback against 2192 lows in 3, 7 swings. The target range is 5532-7865 area in medium- to long-term .