Chevron Corporation (ticker: CVX), commonly known as Chevron, is one of the world’s largest multinational energy corporations. The company operates in all aspects of the oil, natural gas, and geothermal energy industries. This includes exploration, production, refining, marketing, and transportation. The stock is bullish in larger degree. However, in shorter cycle, it is still correcting cycle from 3.19.2020 as a flat.
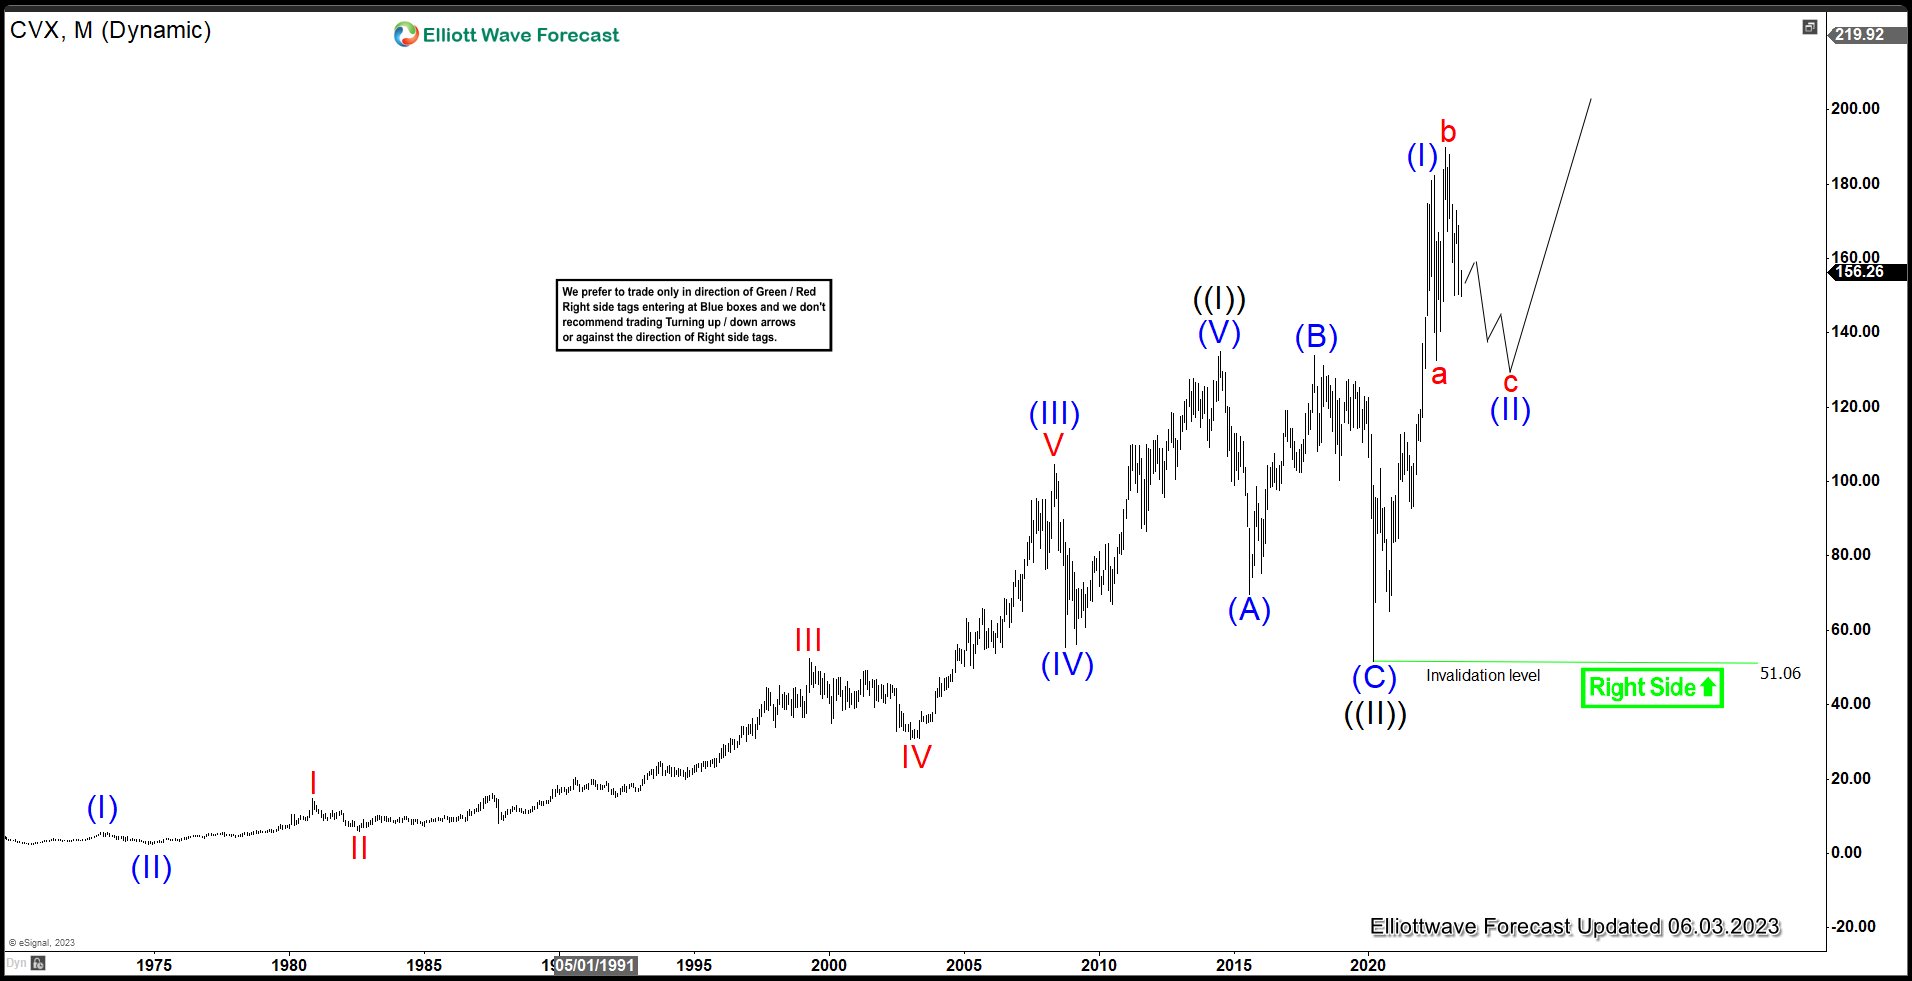
Chevron Monthly Elliott Wave Chart
 Monthly Elliott Wave of Chevron (CVX) shows that the stock has ended wave ((II)) super cycle correction at 51.06 in the year 2020 and resume to a new high. Up from wave ((II)), wave (I) ended at 182.4 and wave (II) pullback is in progress as expanded/running flat to correct the rally from 3.1.2020 low before the the stock resumes higher again. As long as pivot at 51.06 low stays intact, expect pullback to find support in 3, 7, 11 swing for further upside.
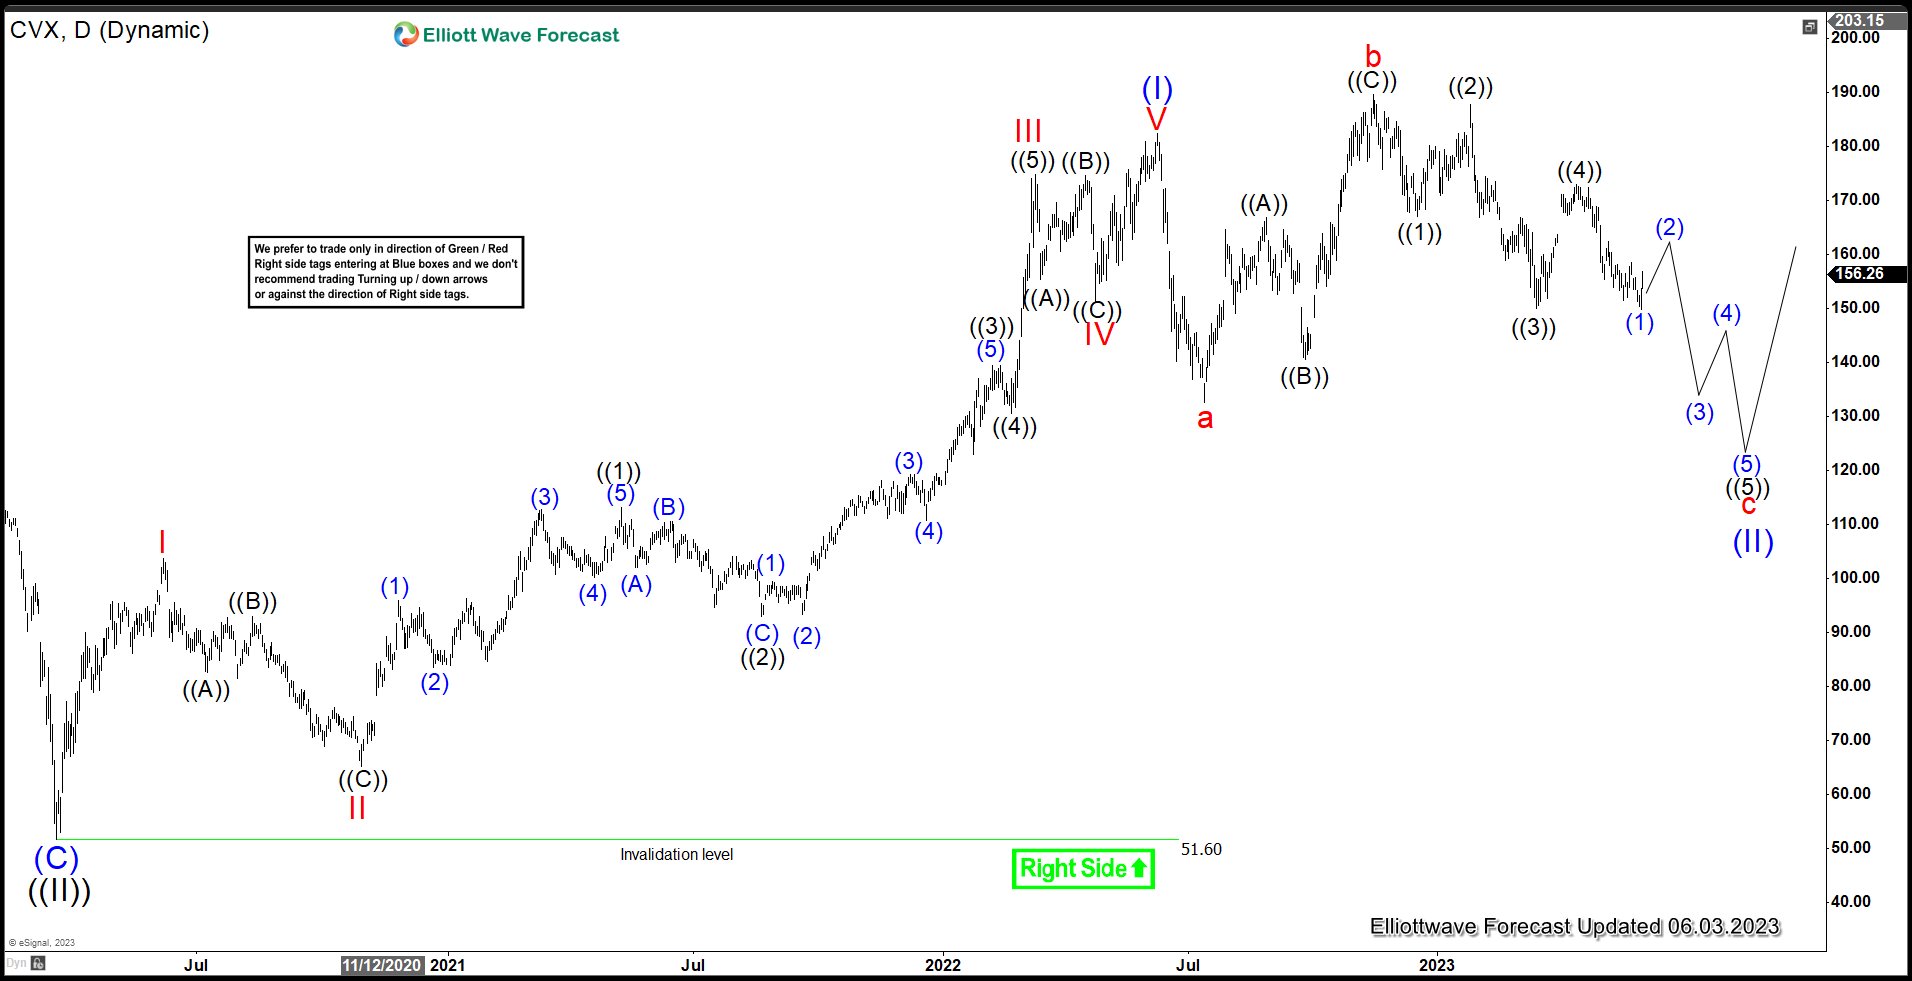
Chevron Daily Elliott Wave Chart
Daily Elliott Wave view in Chevron above shows that wave (II) pullback is in progress as a flat structure to correct cycle from 3.20.2020 low before the next leg higher. Stock still has scope to correct lower further before ending wave (II) and resumes higher.
