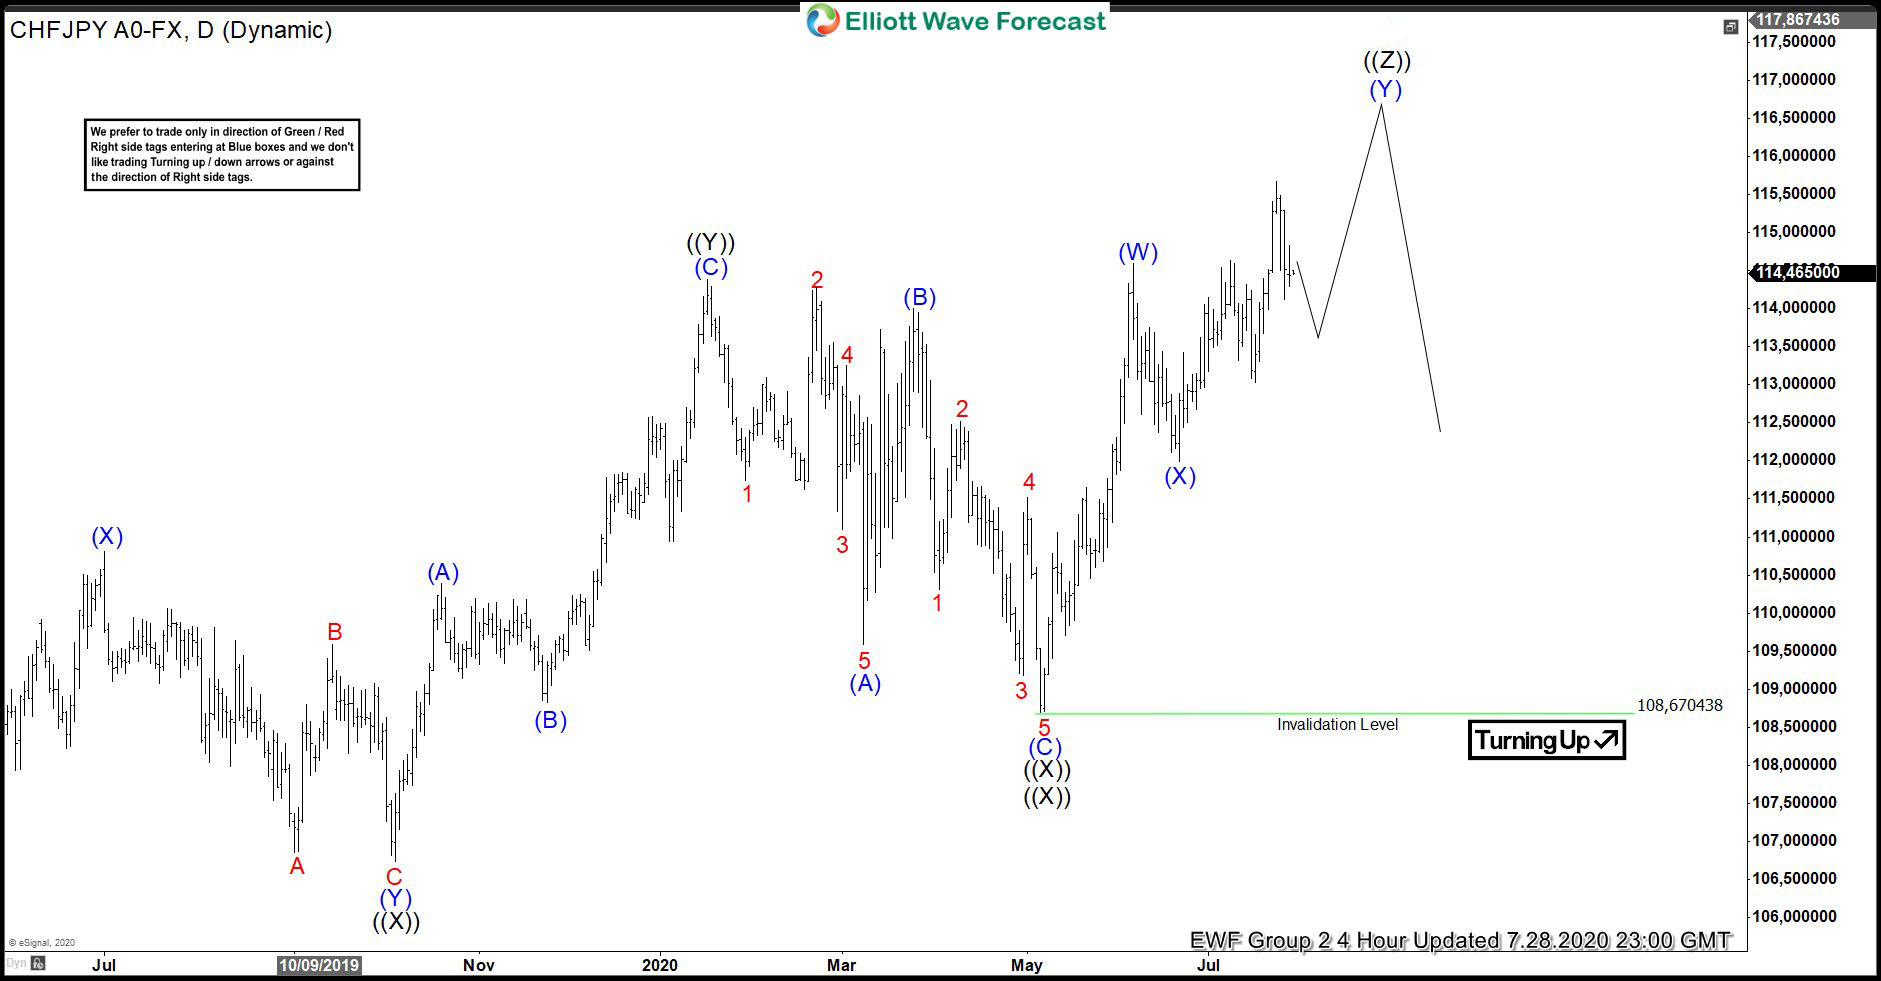
In this blog, we are going to take a look at the Elliott Wave chart of CHFJPY. The Daily chart update below shows that the pair has continued to extend higher from October 4, 2019 low. Up from that low, the pair ended wave (A) at 110.39 high. The pullback in wave (B) ended at 108.82 low. Wave © then ended at 114.38 high. This ended wave ((Y)) in the larger degree. Afterwards, the pair did a pullback in wave ((XX)), which ended at 108.67 low. From wave ((XX)) low, the pair has extended higher in wave (W), which ended at 114.59 high. The rally higher has broken above previous wave ((Y)) high, creating an incomplete sequence to the upside. The 100% - 123.6% extension of wave ((Y))-((XX)) where ((Z)) can potentially end is between 116.38-118.19 area.
CHFJPY Daily Elliott Wave Chart
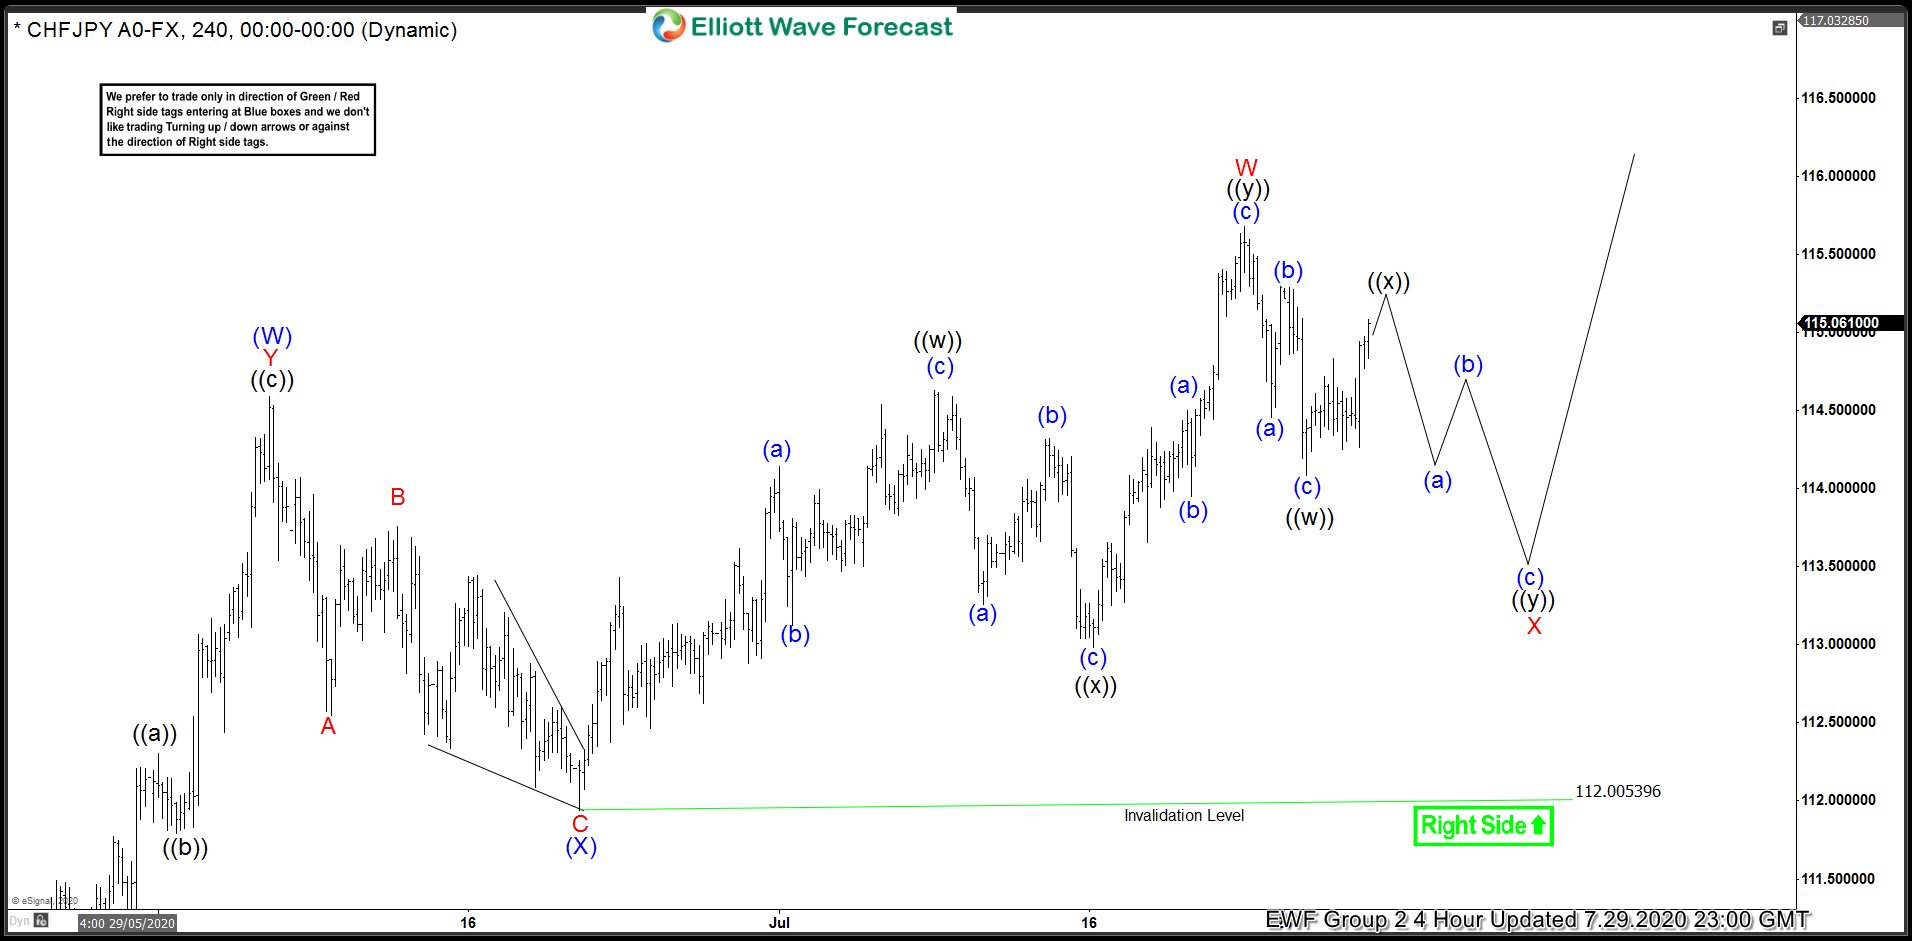
The 4 hour chart from July 29 shows that down from wave (W) high, the pair corrected lower in wave (X). The pullback ended at 112.00 low. Currently, wave (Y) remains in progress and is unfolding as a double three Elliott Wave Structure. The rally higher in wave W ended at 115.67 high. This rally broke above previous wave (W) high. The pair is now also showing another incomplete bullish sequence targeting more upside. The 100% - 123.6% extension of wave (W)-(X) where (Y) can potentially end is between 117.92-119.32 area. As long as the low at 112.00 stays intact, the pair is favored to see more upside and the pullback in 3,7, or 11 swing is expected to find support.
CHFJPY 7.29.2020 4 Hour Elliott Wave Chart