Cisco Systems, Inc., commonly known as Cisco (CSCO), is an American-based multinational digital communications technology conglomerate corporation headquartered in San Jose, California. Cisco develops, manufactures, and sells networking hardware, software, telecommunications equipment and other high-technology services and products.
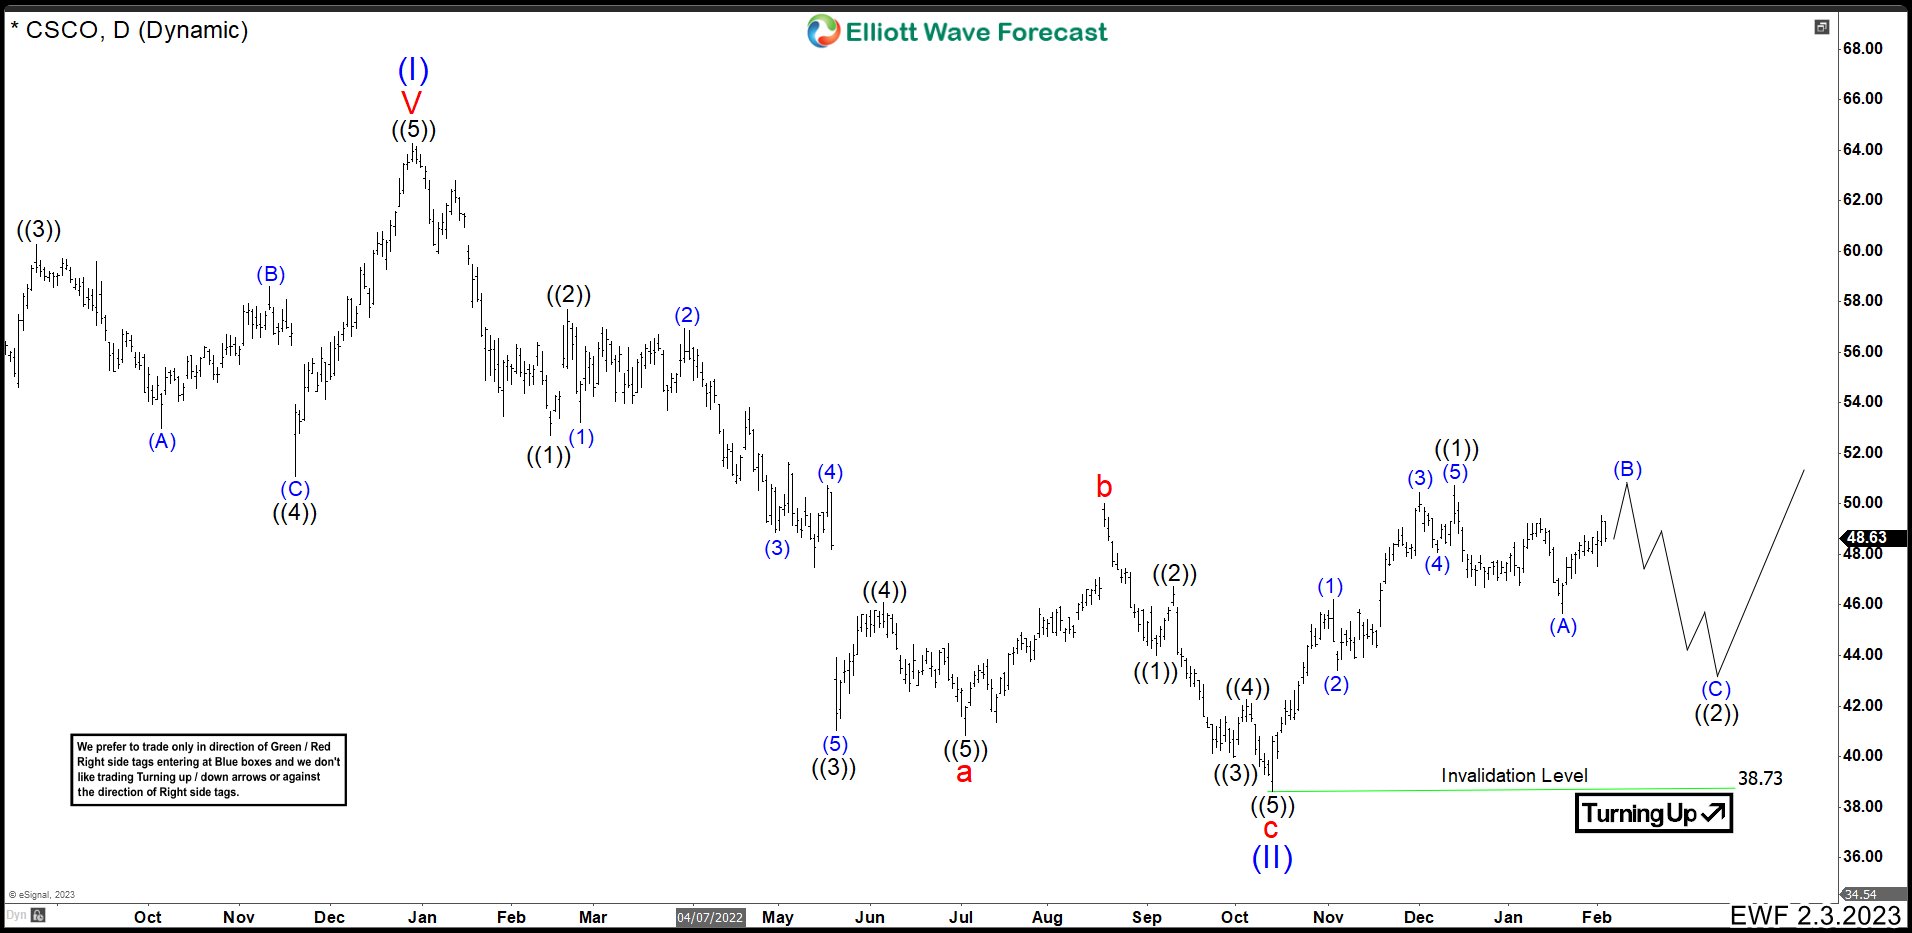
CSCO Daily Chart February 2023
 At the end of 2021, Cisco finished an impulsive structure at 64.33 which we called wave (I). From this high, CSCO has been down nearly a year. We can see a zig zag 5-3-5 structure. The first bearish impulse ended at $40.81 as wave a. Wave b bounced and ended at $50.05. To complete the corrective structure, we had another push that fell to $38.73 to end wave c and wave (II). Since October 2022 low, the stock has been moving to the upside reaching an important high in December. This high we call wave ((1)) and we were expecting to complete wave ((2)) before resuming the rally.
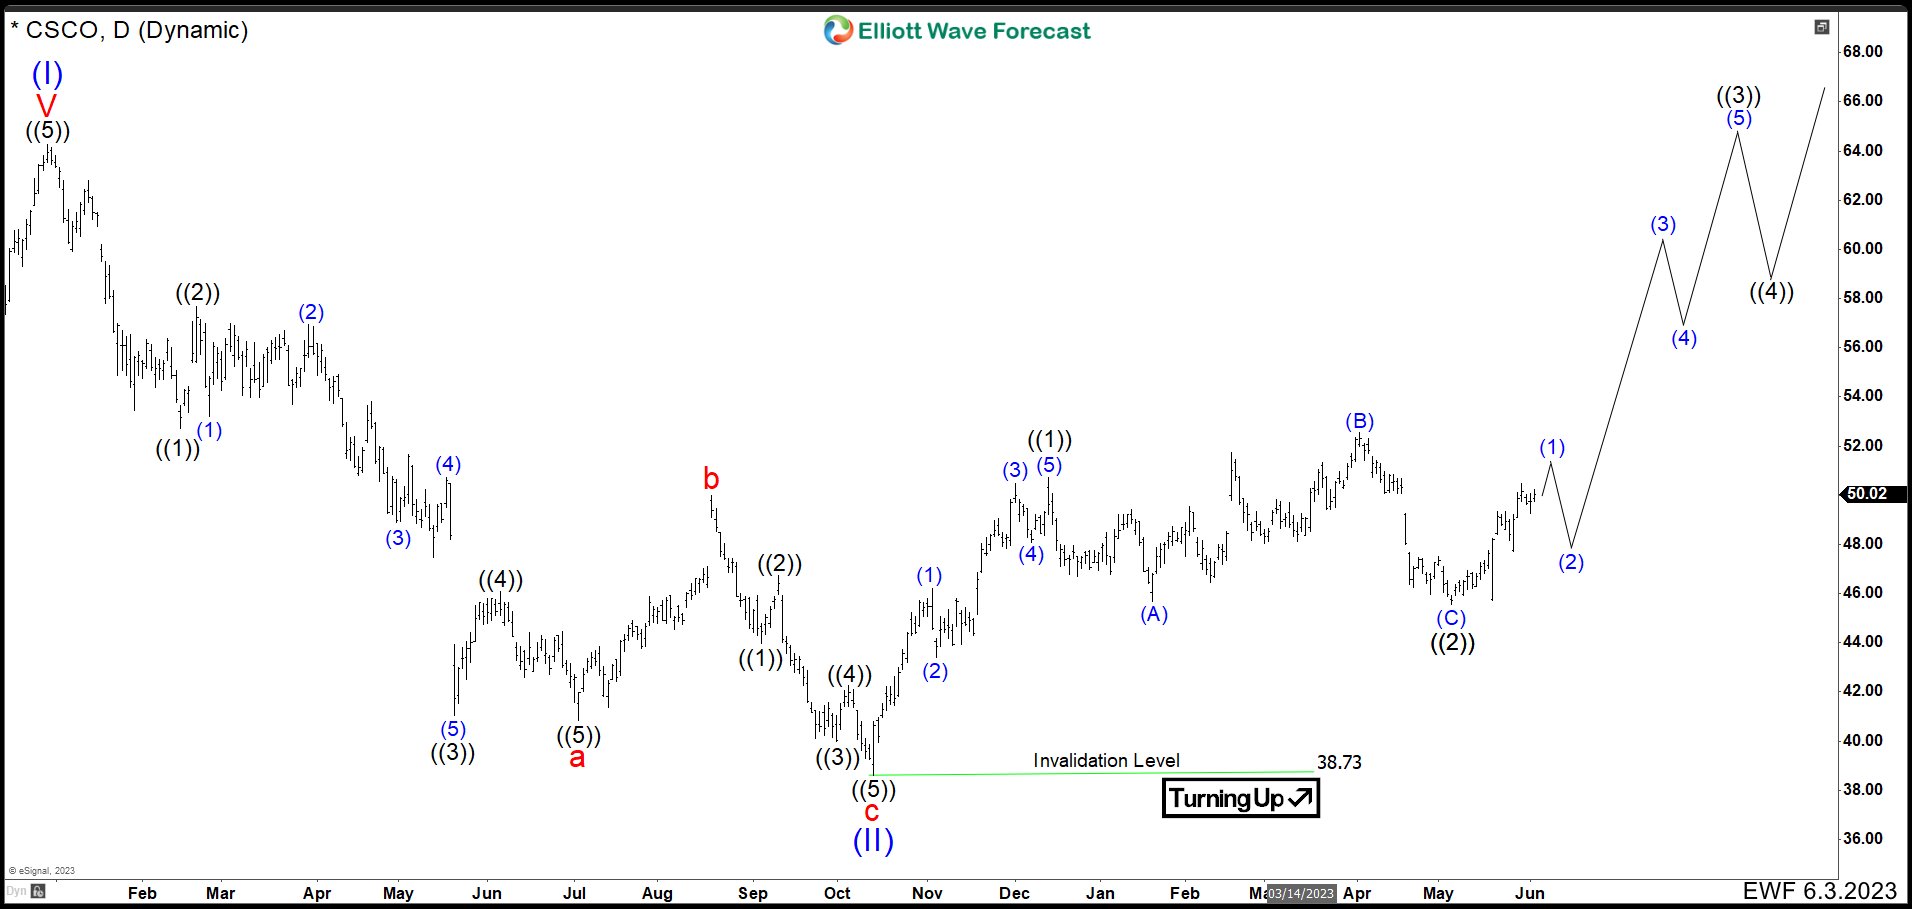
CSCO Daily Chart June 2023
 After ending wave ((1)) at $50.74, the market made an expanded flat as wave ((2)). We can see 3 swings lower to end Wave (A) of ((2)) at $45.65. Then, 3 swings higher as wave (B) ending at $52.60 and wave (C) impulse lower at $45.53. Completing a 3-3-5 flat structure and wave ((2)). CSCO continued the rally again and until now looks like is developing an impulse. While price action stays above $45.53 the rally should keep going to finish wave ((3)).
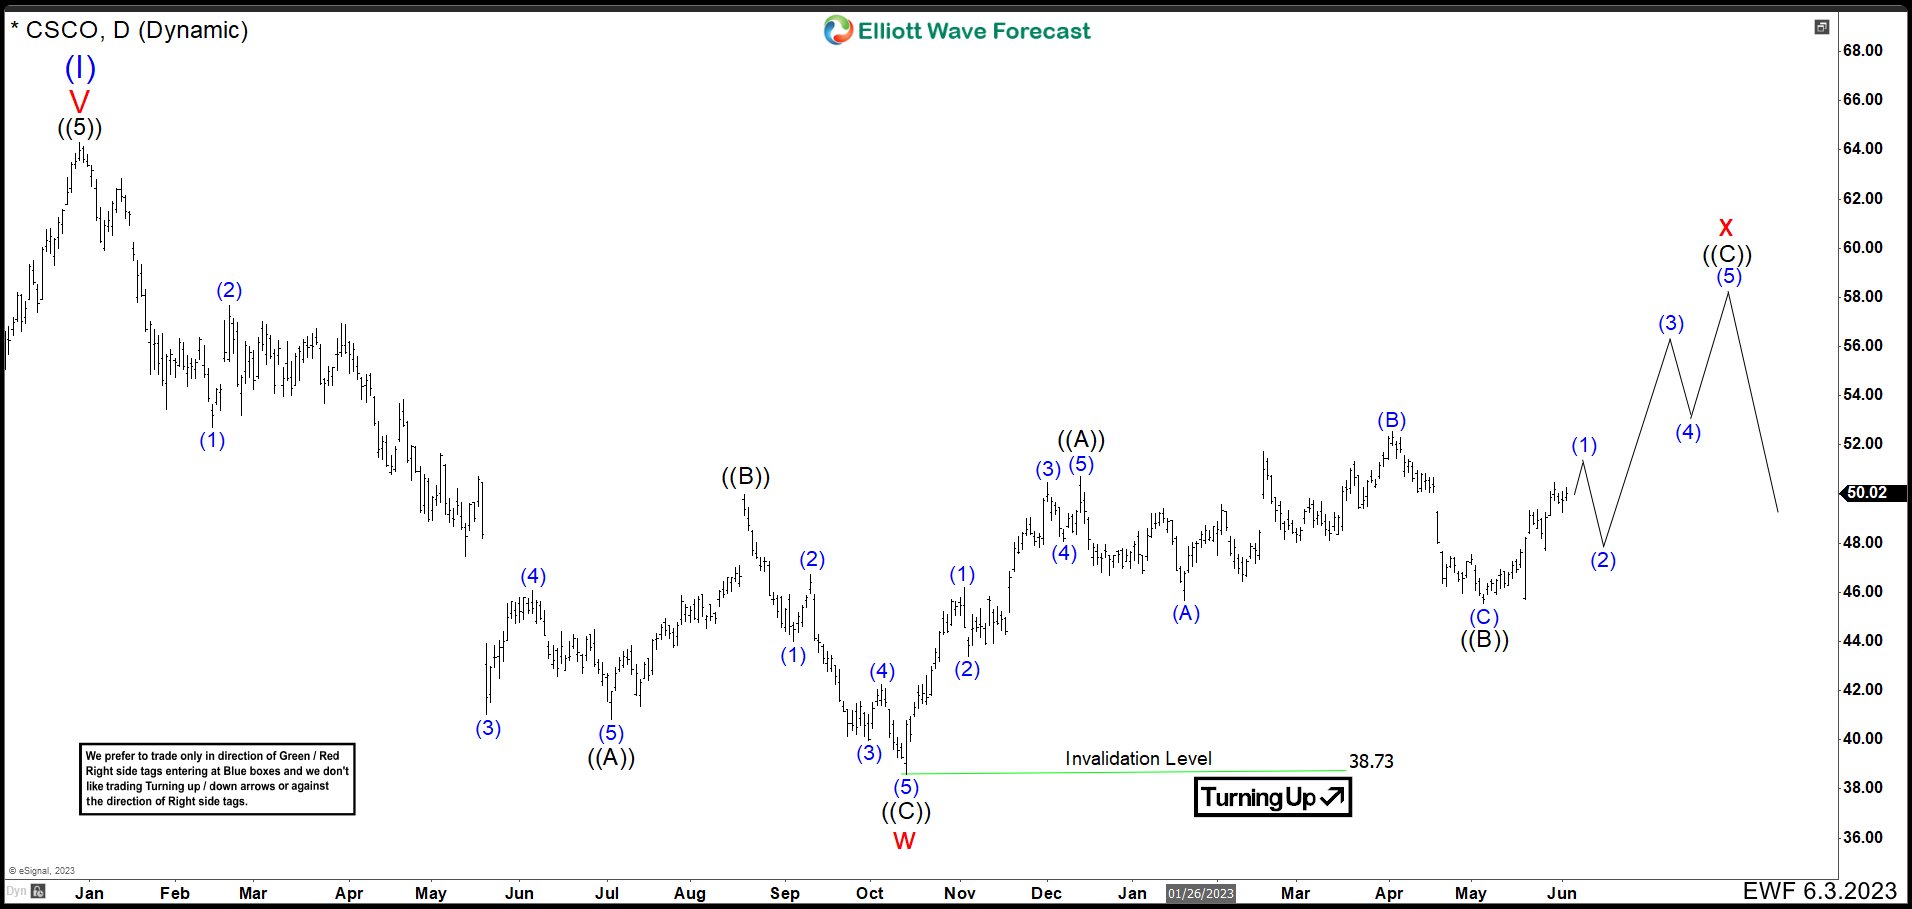
CSCO Alternative Daily Chart June 2023
 An alternative to this view is that wave (II) has not finished and it makes a double correction. For this, the CSCO share price should continue to rise to the 57.66 – 60.52 area. Thus, the price should be rejected from this zone opening the possibility of a double correction that sends the price below $38.73.