In this blog, we will take a look at the price action and Elliott wave structure of Crude Oil since December 24, 2018 low. Understanding the structure of initial rally up from December 24, 2018 low reveals that Oil is taking the form of a zigzag Elliott Wave structure and also highlights the ideal target zone for the current rally to end.
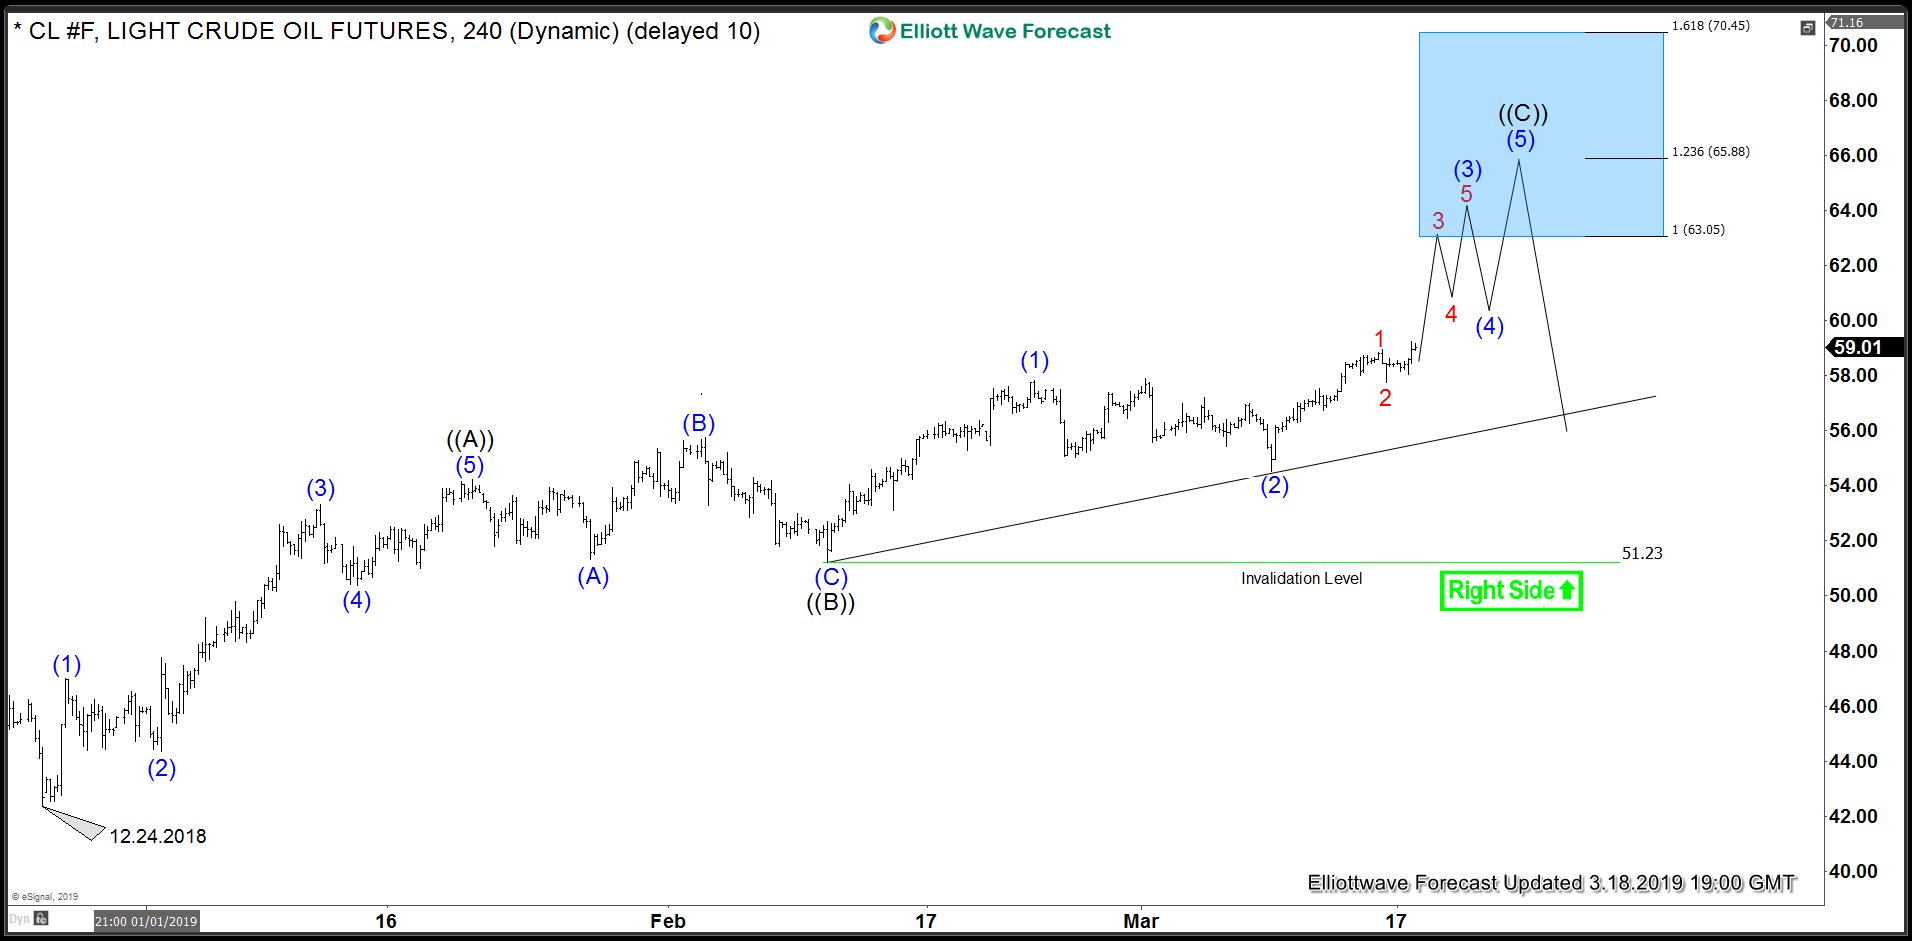
Initial rally from December 24, 2018 (42.36) to January 21, 2019 (54.24) unfolded as a regular Impulse wave when wave (1) ended at 47.00, wave (2) ended at 44.35, wave (3) ended at 53.31, wave (4) ended at 50.38 and wave (5) ended at 54.24. We have labelled this as wave ((A)). This was followed by an irregular correction to complete wave ((B)) at 51.23 after which Oil rallied again in 5 waves to 57.81, break above 54.24 confirmed wave ((B)) completed at 51.23 and wave (©) higher is in progress to complete a Zigzag Elliott Wave Structure. Within wave (©) rally to 58.95 completed wave 1 of (3) and wave 2 of (3) is also proposed to be over at 57.74. As dips hold above this level, expect Oil to continue higher in wave (©) towards 63.05 - 65.88 area and in extension 70.45 to complete a Zigzag Elliott wave structure up from December 24, 2018 low.
If 57.74 low breaks, that could mean wave 2 of (3) has unfolded as an irregular correction and thus, as far as price stays above the up trend line (currently at 55.50) and more importantly as far as it stays above 54.52 low, expect Oil to continue higher towards 63.05 - 65.88 area. Only a break of the distribution pivot at 51.23 low would suggest cycle from December 24,2018 low ended already without reaching the ideal extension target at 63.05. If price breaks above 70.45, then wave (©) would become wave ((3)) and rally from December 24,2018 low could then be viewed as an incomplete Impulse structure.
Crude Oil Chart showing structure of rally from December 24,2018 low