In this technical blog, we are going to take a look at the past performance of 1 hour Elliott Wave Charts of Coffee ticker symbol $KC_F. In which, the rally from 15 June 2020 low unfolded as impulse structure favored more strength to take place. Also, the right side tag pointed higher & favored more strength. Therefore, we advised our members to buy the dips in Coffee in 3, 7, or 11 swings at the blue box areas. We will explain the structure & forecast below:
Coffee 1 Hour Elliott Wave Chart
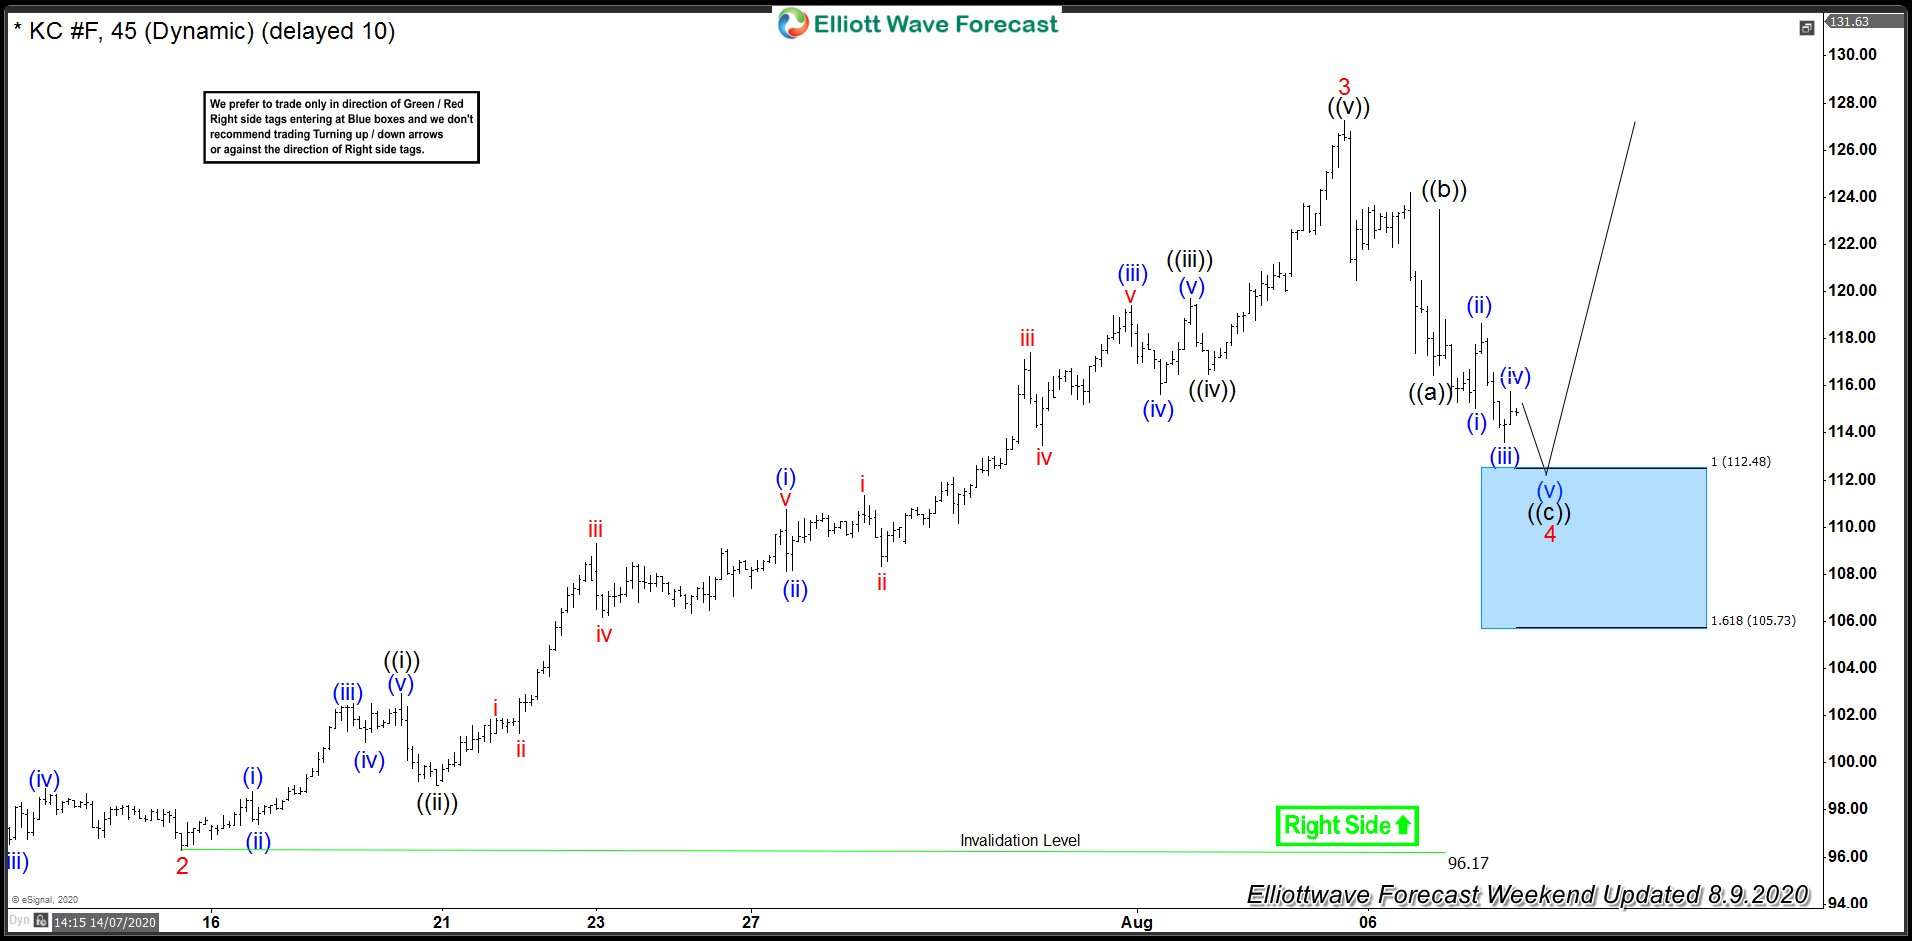
Above is the 1 Hour Elliott Wave Chart from 8/09/2020 Weekend update. In which, the pullback to $96.17 low ended wave 2. Up from there, the rally higher took place as impulse structure where wave ((i)) ended at $102.95 high. Wave ((ii)) ended at $99.05 low, wave ((iii)) ended at $119.70 high, wave ((iv)) at $116.50 low. While wave ((v)) ended at $127.25 high, which also completed wave 3. Down from there, Coffee made a 3 wave pullback in wave 4 to correct the cycle from 7/15/2020 low ( $96.17). The internals of that pullback unfolded as Elliott wave Zigzag structure where wave ((a)) ended at $116.45 low. Wave ((b)) ended at $123.50 high and wave (©) was expected to reach $112.48- $105.73 100%- 161.8% Fibonacci extension area of ((a))-((b)). From there, buyers were expected to appear for more upside or for 3 wave reaction higher at least.
Coffee 1 Hour Elliott Wave Chart
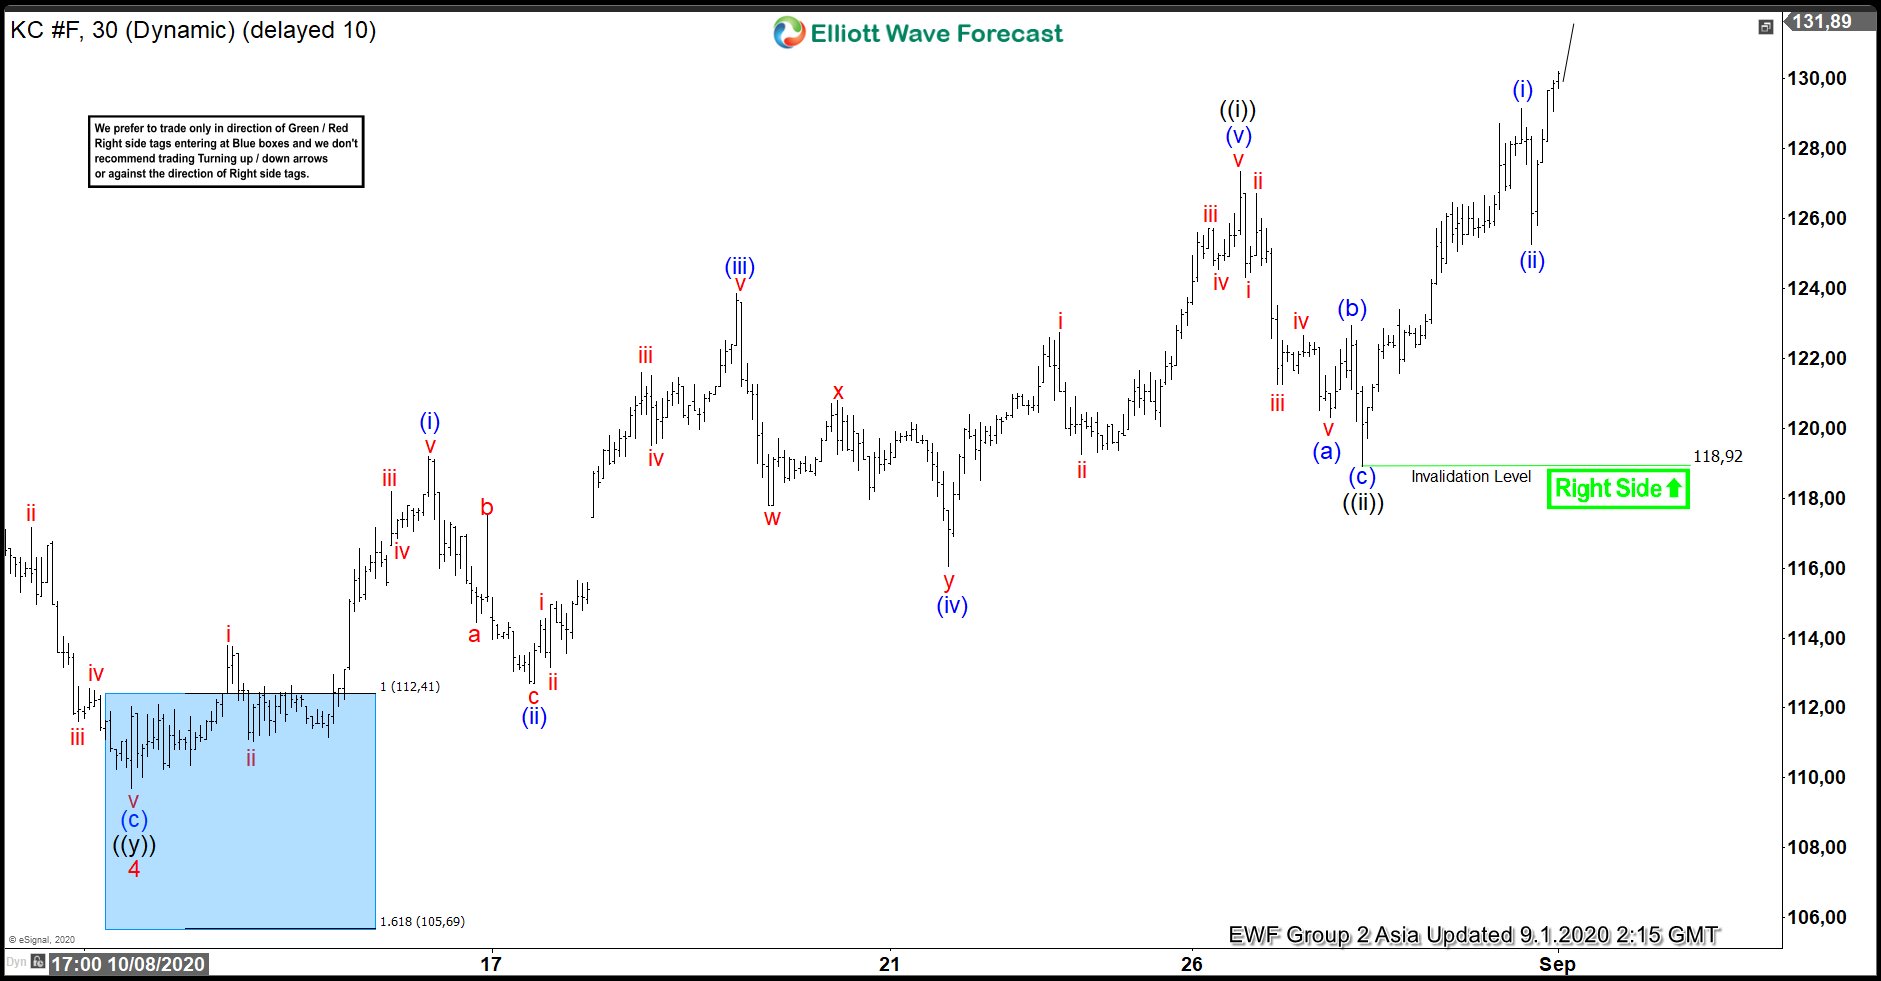
Here’s the Latest 1 Hour Elliott Wave Chart From 9/01/2020 Asia update. Showing Coffee reaching the blue box area & reaction higher from the blue box area. Allowed members to create a risk-free position shortly after taking the longs at $112.48- $105.73 blue box area.