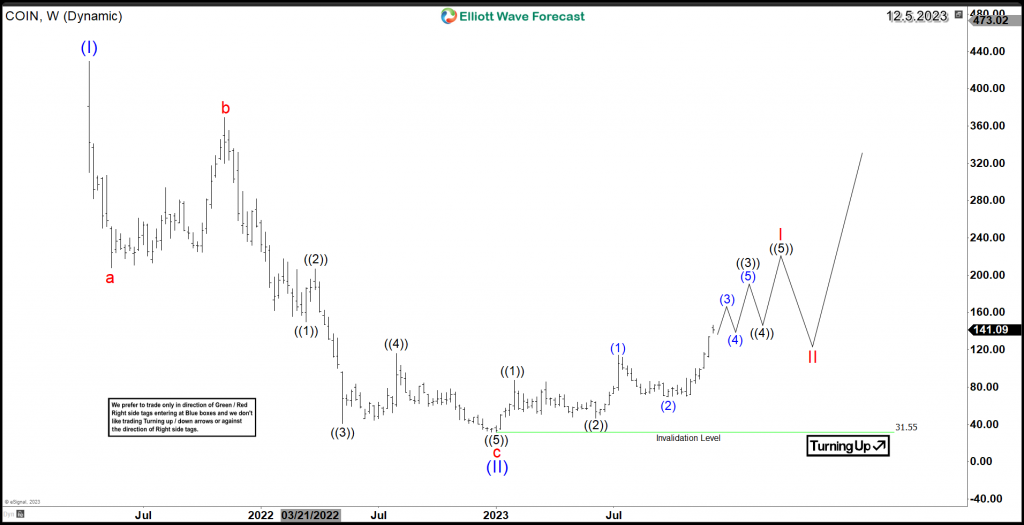
Coinbase Global (NASDAQ: COIN) went public on April 14, 2021 with its Initial Public Offering (IPO) and the stock reached its peak on the same day. Subsequently, the cryptocurrency sector was hit hard by the bear market, causing COIN to lose 90% of its value over the following 21 months . Since the beginning of this year, Coinbase has shown an impressive rally of +350% 12. Let’s take a look at the Elliott Wave Structure to explore the potential path for the coming years.
As we can see on the following weekly chart, COIN’s decline since 2021 unfolded as a corrective 3 waves ZigZag structure labeled in wave (II) at $31.55. The initial rally from the lows is showing 5 swings to the upside, which is considered a bullish structure suggesting continuation to take place.
COIN has two options at this stage :
-
It can extend the rally within wave I as the internal cycle could be nesting within a strong wave ((3)). After ending the extended 5 waves structure, a 3 waves pullback will take place in wave II above $31.55. Then the stock will be able to resume the new bullish cycle.
-
It can soon end the current 12-month rally because it’s already showing a 5 waves advance in wave ((1)). Then a wave ((2)) pullback will take place to correct the cycle in 3, 7, or 11 swings. After that, a new rally will take place within wave ((3)).
Coinbase (NASDAQ: COIN) Weekly Chart 12.5.2023
As discussed in the above scenarios, both ideas are based on the bullish 5-swing showing since January 2023 low. Consequently, COIN is expected to remain supported during the next pullback as the stock is in the process of starting a new multi-year bullish trend, and it’s only the start of wave (III). Therefore, investors will be looking to accumulate/buy the stock during daily pullbacks.
