When i draw a important levels on big timeframes “MN,W”
I have headache from confuse about this level" refer by red arrow"should i take this level as potential R\S cause in the past it were a crucial level?
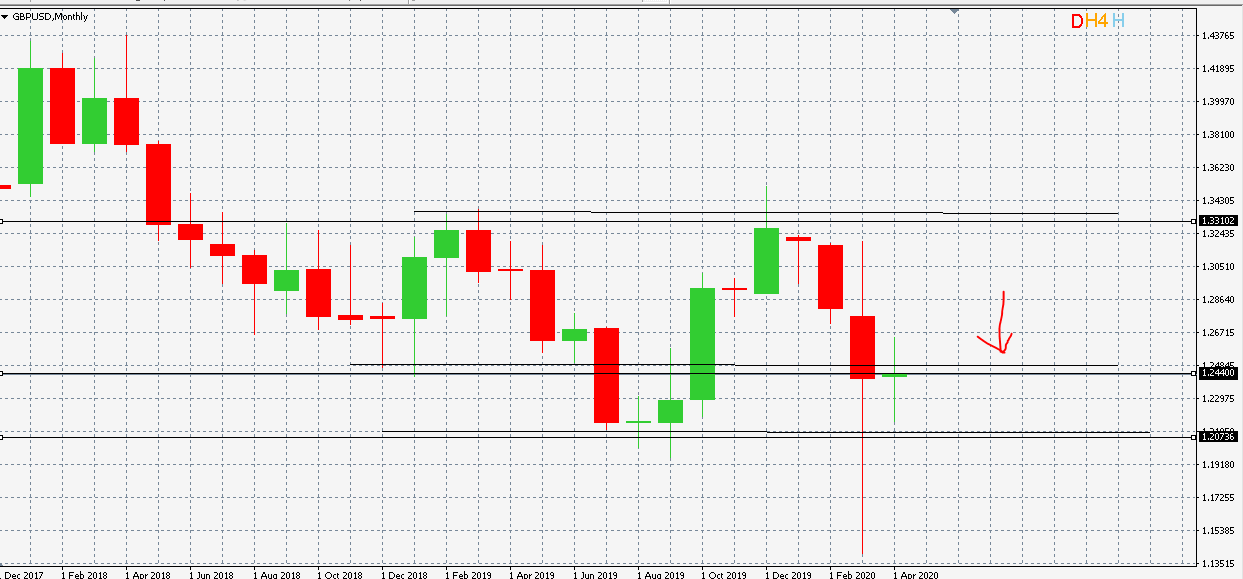
When i draw a important levels on big timeframes “MN,W”
I have headache from confuse about this level" refer by red arrow"should i take this level as potential R\S cause in the past it were a crucial level?
If the price has “violated” a certain support/resistance level many times, in both directions up and down, it is better to delete this level from your charts
Isnt the price still in the middle of a range? Would you not wait till the price moves to the support at 1.20736 and see if it tests it again? If it bounces off it then that might be the official support and be ranging.
Just my thoughts, im probably wrong, still learning myself
A bit off topic here but I remember a hilarious experiment done by Big Mike from futures.io where he just randomly drew lines and price “reacted” to them. I believe he was discussing it with Steve Burns who also did a similar experiment. I think it was Steve Burns.
Yes I am believer too that horizontal lines on charts are randomness. Incidentally we can plot weather patterns and other non supply demand data and see the same chart patterns us traders use
Food for thought
S/R lines are not magic sticks that the currency pair somehow has to react to. If they were then we would never break out of them.
It is worth remembering that such lines are, to a certain extent, self-fulfilling simply because TA is so wide spread amongst market participants. If certain TA things are commonly looked at, such as Fib retracements, trend lines, S/R lines, MAs, etc, then it inevitably draws a lot of market activity closer to those levels, e.g. entry orders, stops, scaling in/out and so on.
Whilst this may have a short term impact, it is the underlying fundamental supply/demand for the actual currency pair that decides how the market continues from these levels.
But the concrete activity in the actual currency is not so precise as a S/R line might suggest. It is the speculative communtiy that tightens a zone into a single line.
Three examples of concrete underlying currency activity that is zone sensitive:
Commodities: Countries and companies are constantly buying commodities for consumption or as raw materials in production (e.g. steel for cars). These commodities are often priced in, e.g. USD and therefore certain USD rate levels are attractive for buying supplies in order to keep the domestic currency price of finished goods competitive. Therefore companies will tend to purchase whenever the exchange rate is at that level.
Import/export businesses: These companies are constantly buying and selling goods internationally and exchange levels levels are a critical factor in being able to offer goods to retailers at competitive prices. And because they are in the market continuously, they will order whenever the rate is at a particular zone.
Investment/pension funds: These institutions do not only invest in currencies. Their money is distributed strategically amongst nationals, companies, other institutions, etc and their income is from interest rates, bond values, company dividends, share values, etc. These investments are international and therefore the currency exchange rates when making investments and when domiciling returns are again a critical factor. If they are looking to expand investments in a particular class of industry or a national then the currency rate when making that investment has a big impact on the overall return on time.
This is a very simplified overview, but does offer some reasons why certain exchange rate regions will stimulate activity, and those areas tend to be sharpened into more defined values when the speculative community sees them appearing in past action (i.e. translated into candles on a longer term chart.)
Naturally, this overview also suggests that S/R from intraday charts and short TFs is purely speculatively driven and mainly self-fulfilling to a smaller or even larger extent.
A detailed response and one I totally agree with. But the question needs to be asked, if as many agree they are not as accurate as we are often led to believe why bother with them?
Dont we need tools that are as accurate as possible.
I find that many price action patterns display a level of accuracy that is just not prevalent with SR.
I know that there are some who think only take price action signals at confirm SR or trendlines.
Many times this works well, but there are many other times just taking the price action signal even if there is no confluence works equally as well.
I do like Tom Demark trendlines - because it depicts the most recent relationship between swing points, which are highly tradeable but personally I’ve found that extending lines way back into ancient history serves little purpose other than cluttering a chart.
I also agree with this and I do not put specific S/R lines, mainly for the reasons detailed in my last post. But I do take note of earlier clusters/groupings of candles that suggest a lot of activity in that region.
I think one factor that tends to create erratic performance with horizontal S/R lines is that we all break up what is continuous market action into even, but arbitrary, time bar segments. The real, underlying concrete market is not acting “every-hour-on-the-hour” so to speak, but that is how we break it down and analyse it.
But if one is looking at an area for other reasons, but that happens to also contain, or be close to, such a S/R level, then it may well be useful for fine-tuning the price at which one puts an order, simply because of any self-fulfilling reactive movement. But, again, personally, I would only bother with more meaningful levels off a long term chart otherwise, I agree, the clutter can be really distracting, even harmful.