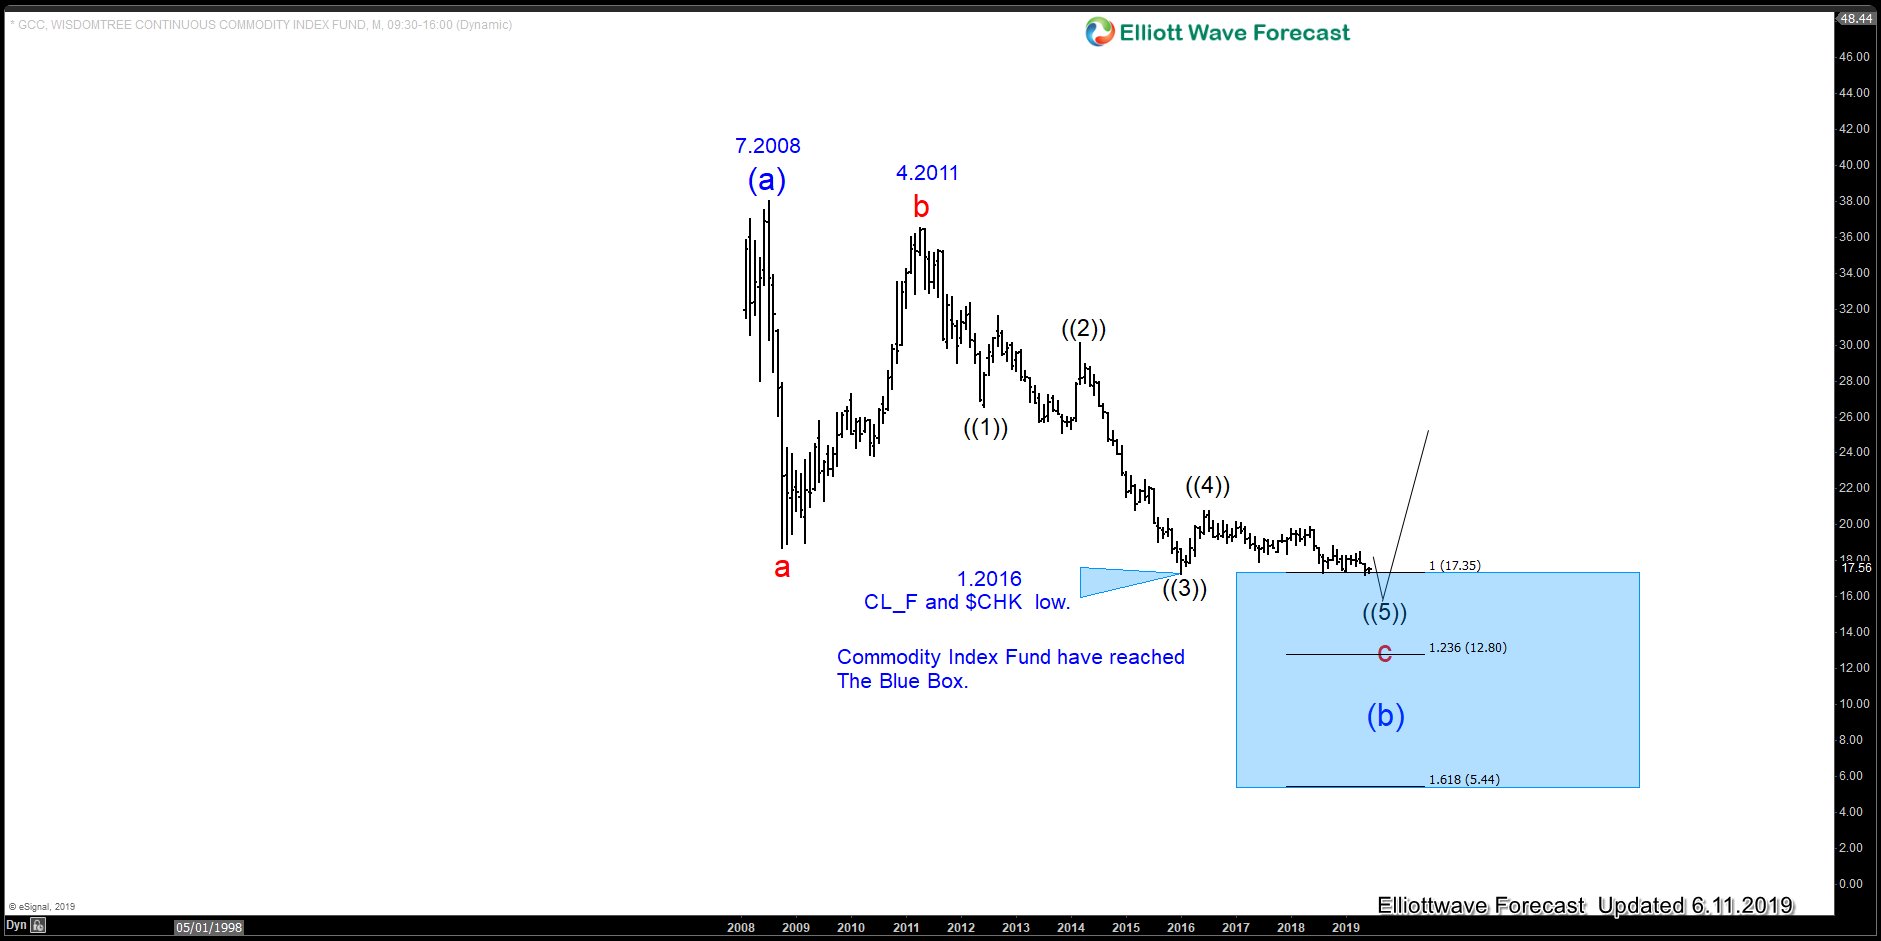
The Wisdomtree Continuous Commodity Index (GCC) has reached our long-term investor buying area (Blue Box). The Index is ending an ABC pullback from its July 2008 peak.
The minimum target to the downside was $17.35 and at this moment in time, we can count 5 waves from the April 2011 peak and consequently the price target which is the Blue Box has been reached as the chart below is showing.
GCC Elliott Wave Monthly View 6.11.2019

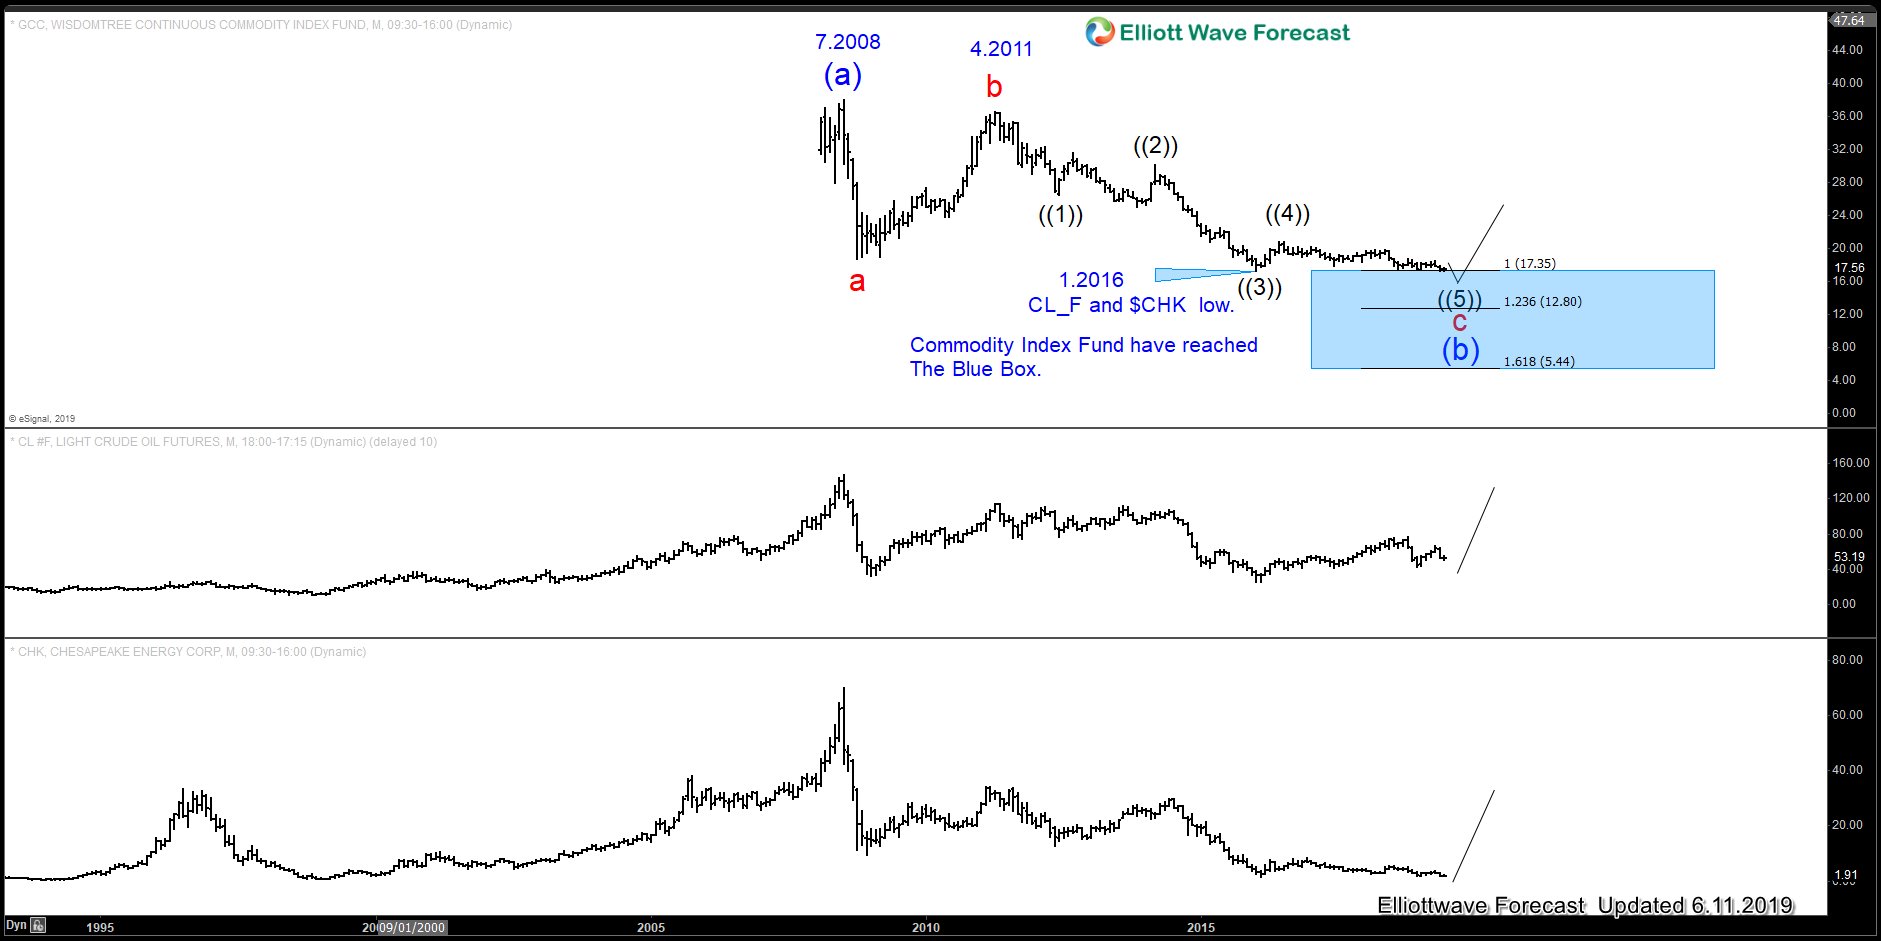
Now as we always do, we relate the instruments to each other. Today, we will relate the GCC with the Chesapeake Energy Corporation stock (CHK). The Index has a strong relationship with the CHK stock and also with Oil Futures. It can be seen in the chart below.
GCC overlay with Oil and CHK 6.11.2019

We can see how they agree in highs and lows. It is very interesting to see that all of them bottomed in 2016 and already the Index has taken the lows whereas Oil and CHK are missing the break lower.
However, this does not mean that CHK and Oil need to make new lows but we are in a process of a long term turn higher and the Index breaking it can open the downside in CHK. At this stage, it comes to the Traders Identity.
If you are a long term investor your trade should be for several months or years. The Index reached a long term buying area (Blue box). But if you are a short term trader you can still look to sell it against its April 2019 peak in 3-7 or 11 swings. It is simple how to operate in this market but sometimes traders lack and make things too complicated. The following video explains the view and goes into more detail and provides the ideas for both types of trades.