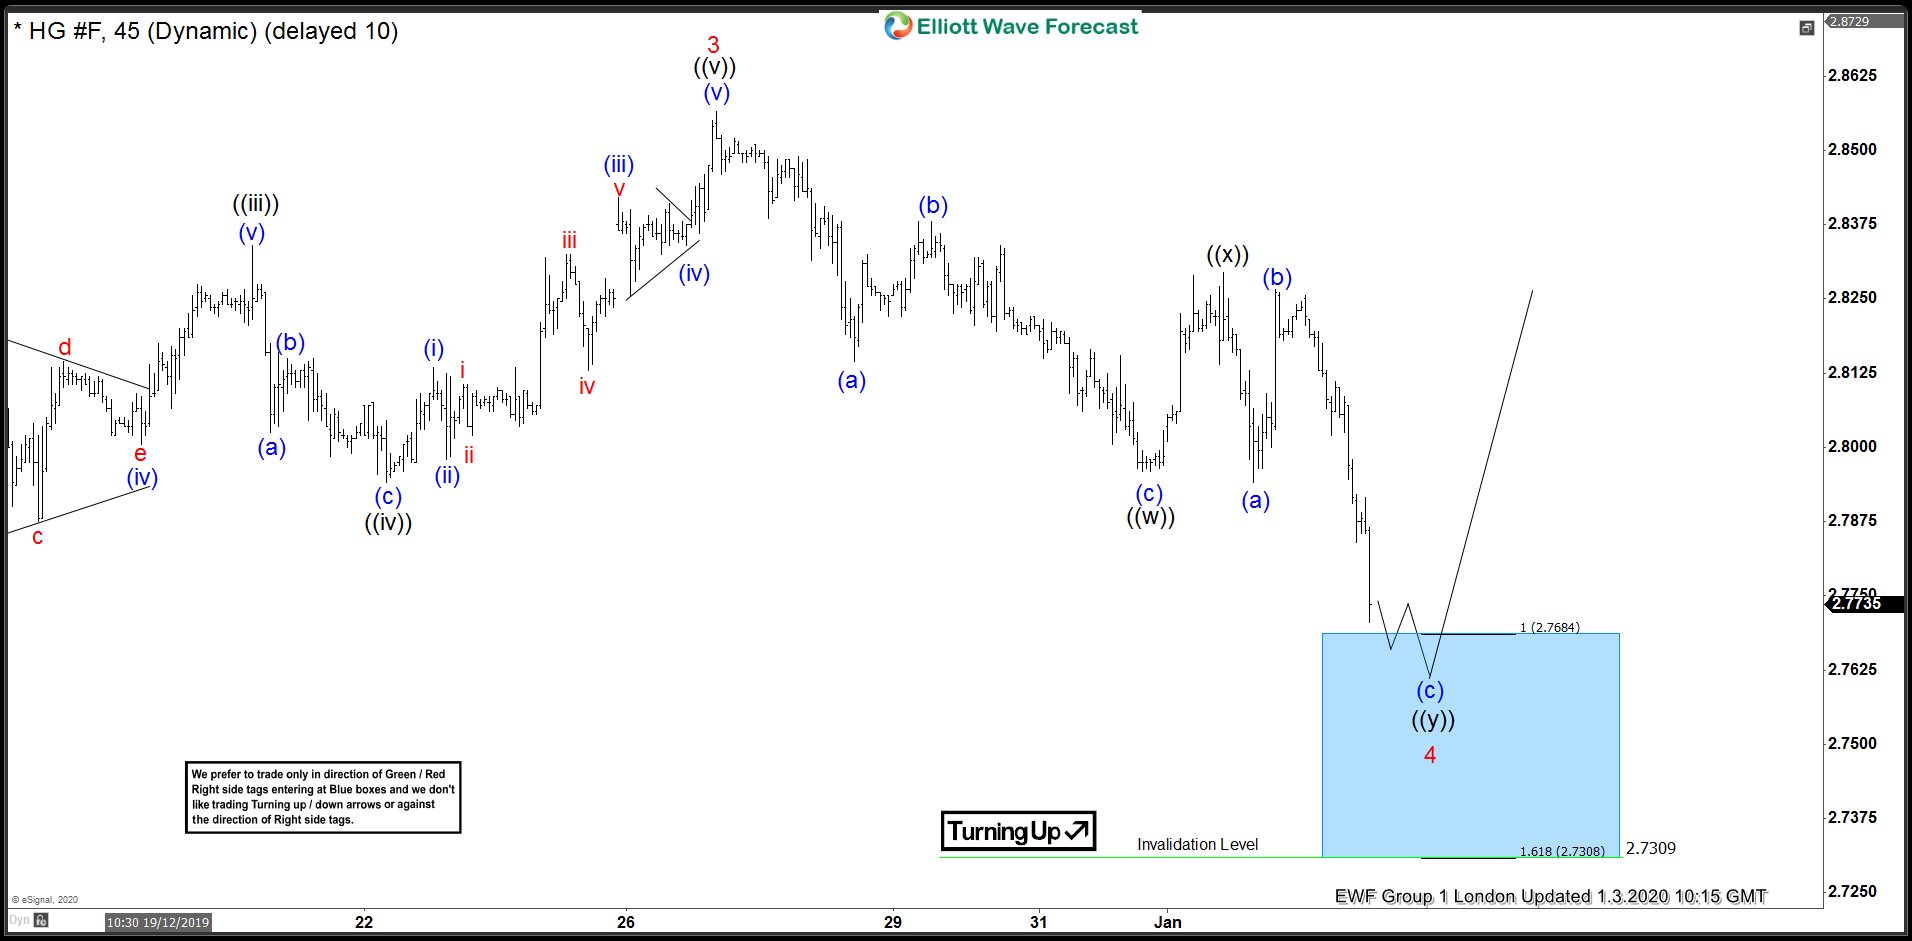
In this blog, we’re going to take a quick look at the Elliott Wave chart of copper. The chart from 1.3.2020 update showed that copper ended the cycle up from 11.15.2019 low at 2.6130 to 12.26.2019 high at 2.8565 as 5 waves impulse structure. Copper then did a pullback from the high, which unfolded as a double three correction. Wave (a) of ((w)) ended at 2.8145 low and wave (b) of ((w)) ended at 2.8380 high. Wave © of ((w)) ended at 2.7960 low, which completed wave ((w)). Afterwards, it bounced in wave ((x)) and reached 2.8295 high. The 100%-161.8% Fibonacci extension of ((w))-((x)) where wave ((y)) can end is between 2.7308-2.7684. This area was highlighted with a blue box. The blue box area is the area where we expect buyers to appear for an extension higher or 3 waves bounce at least.
HG_F 1.3.2020 1 Hour London Elliott Wave Update
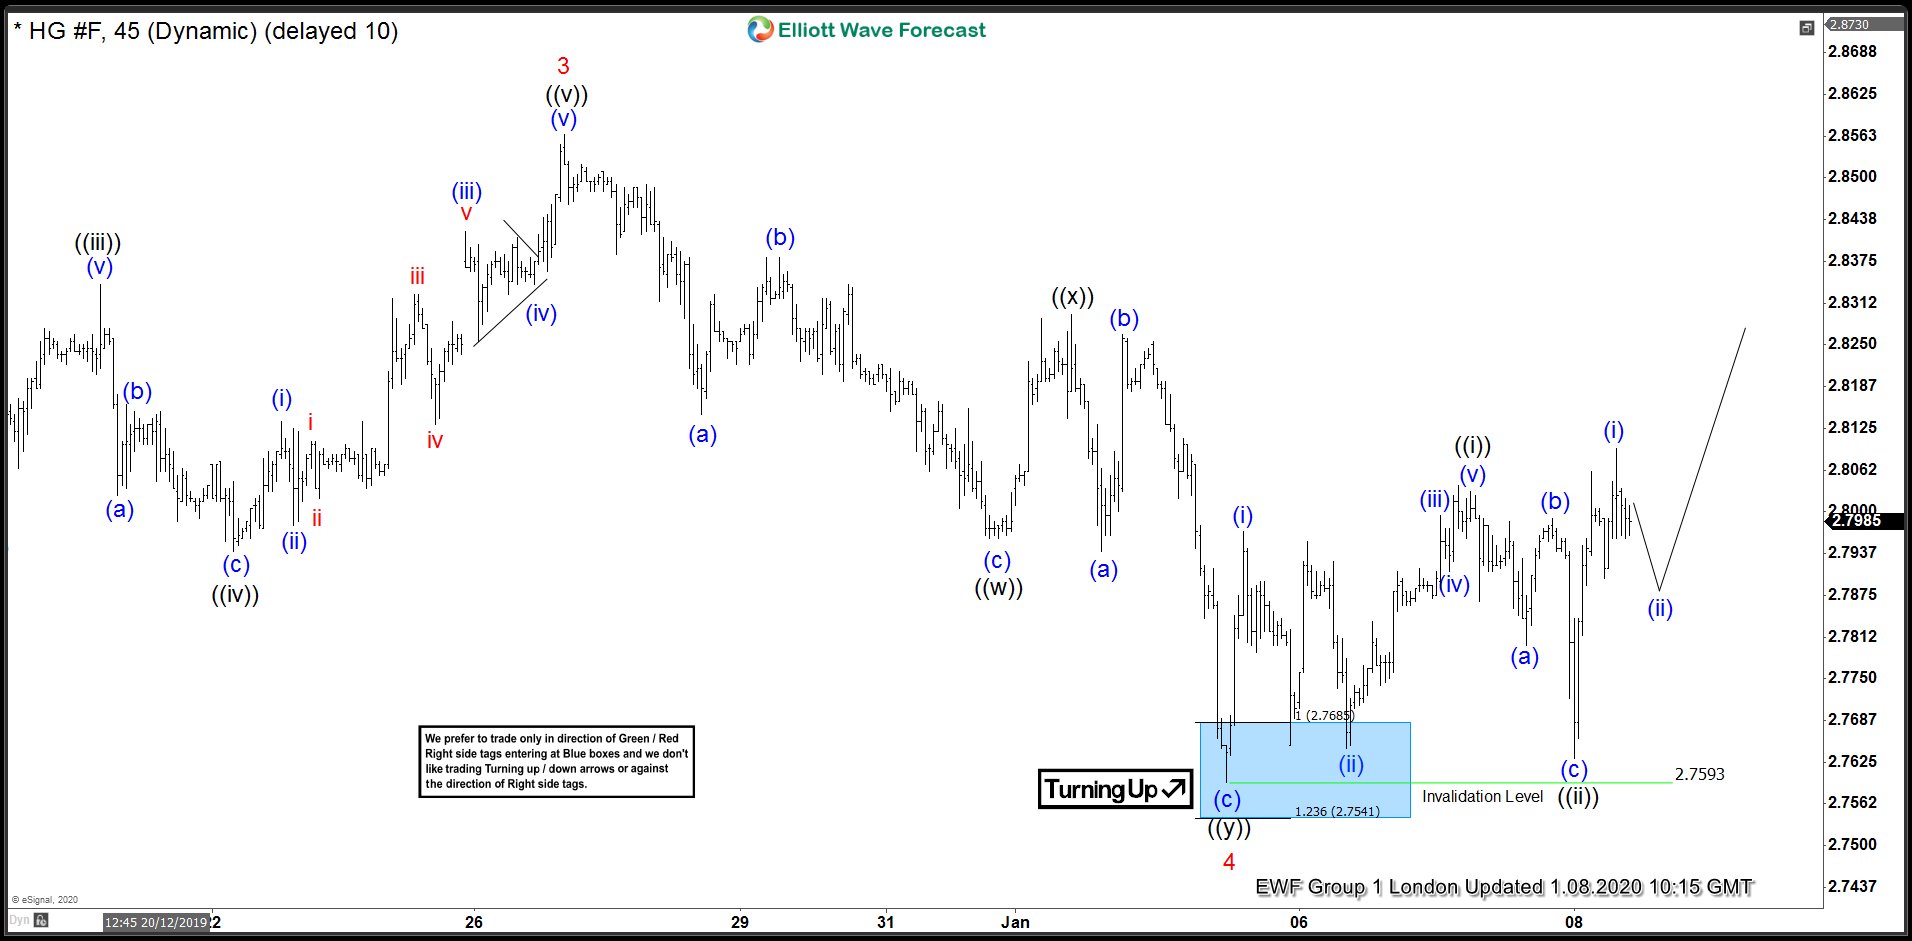
In the chart below from 1.8.2020 update, the pair reached the blue box area and ended wave 4 pullback at 2.7593 low. From there, the pair got a nice reaction and rallied higher. This allow members who bought from the blue box area a risk free position. As far as 2.7593 pivot stays intact, expect copper to extend higher for more upside.
HG_F 1.8.2020 1 Hour London Elliott Wave Update