Hello fellow traders. In this technical blog we’re going to take a quick look at the charts of COPPER ( $HG_F ) published in members area of the website. As our members know, COPPER has given us recovery against the January 16th peak that unfolded as Elliott Wave Double Three Pattern. We advised clients to avoid buying the commodity,while favoring short side and reaction lower from the Blue Box.
In the charts below, we’re going to explain the Elliott Wave structure and forecast.
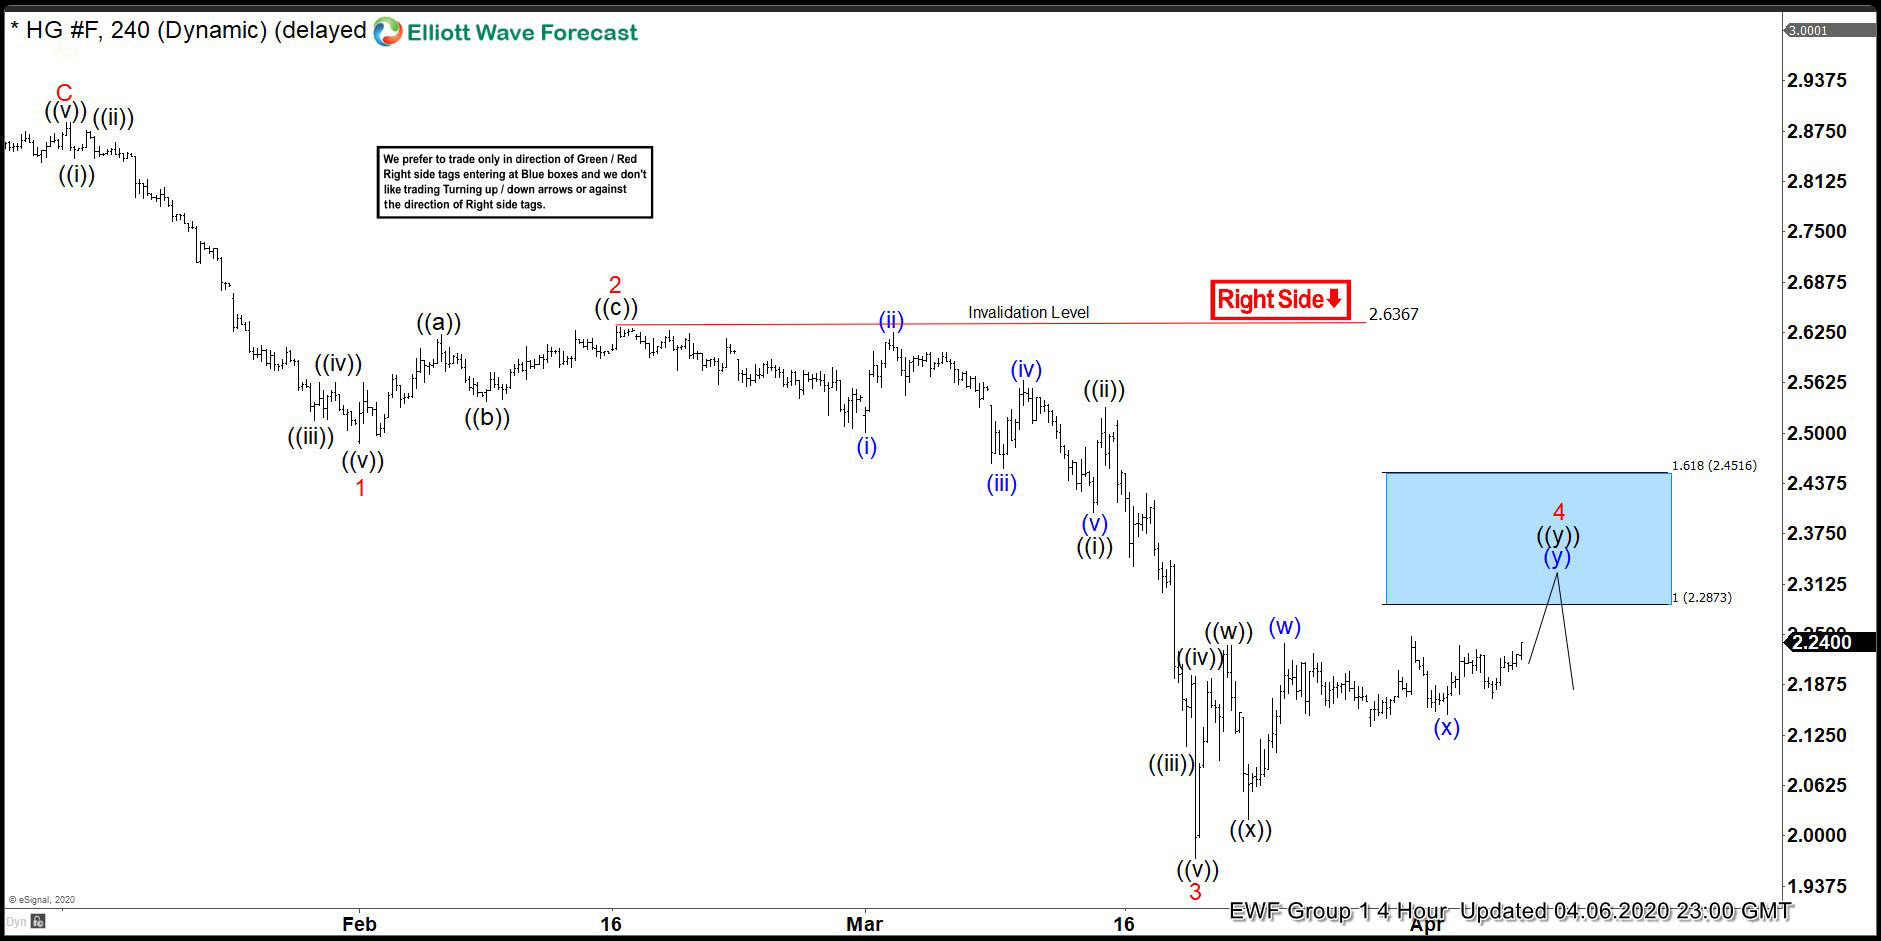
COPPER Elliott Wave 4 Hour Chart 4.6.2020
Current view suggests The Commodity is correcting the cycle from the 2.6367 peak. Recovery is having form of Elliott Wave Double Three. At this moment correction is incomplete, showing higher high sequences from the low. Consequently we are calling for more short term strength toward 2.2873-2.4516 area. At the Blue Box area we expect sellers to appear for decline toward new lows or 3 waves pull back at least. Invalidation of the sell trade would be break above 1.618 fib extension:2.4516. Once the price reaches 50 fibs against the ((x)) black low, we should make short positions risk free.
As our members know Blue Boxes are no enemy areas , giving us 85% chance to get a bounce.
You can learn more about Elliott Wave Double Three Patterns at our Free Elliott Wave Educational Web Page .
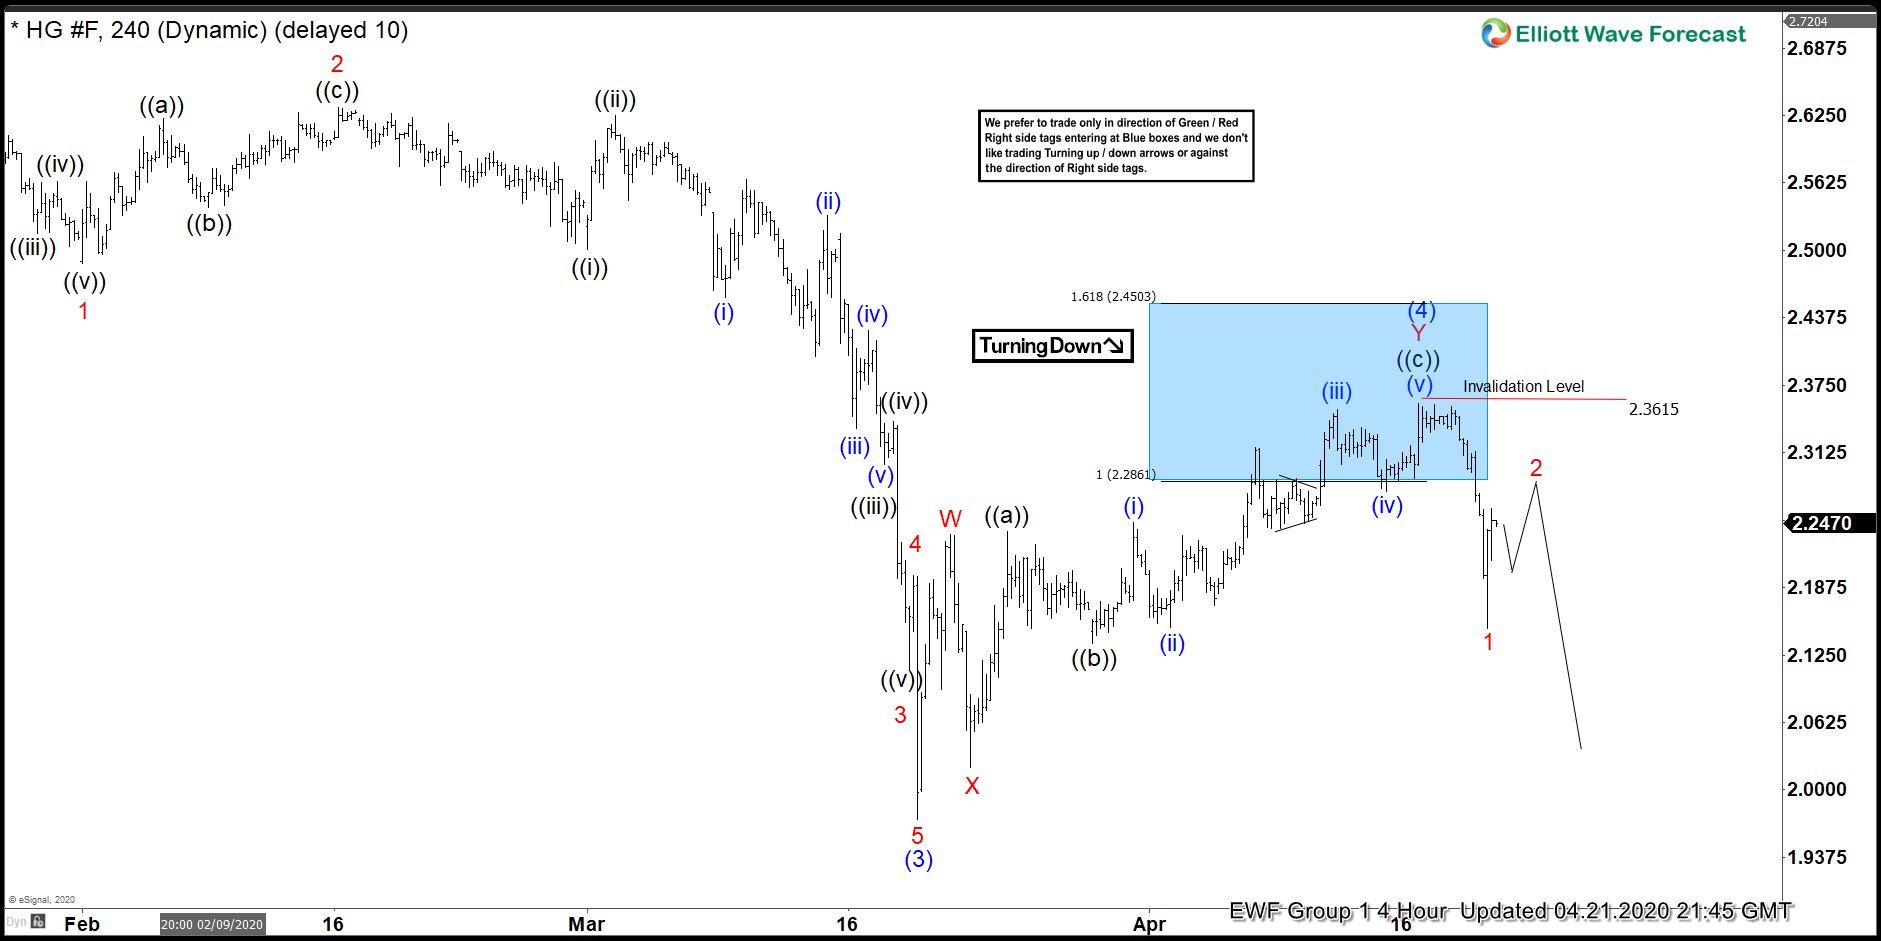
COPPER Elliott Wave 4 Hour Chart 4.21.2020
Eventually , COPPER gave us leg up toward blue box. It found sellers right at the blue box area : 2.2873-2.4516 and gave us decline from there . At this stage we see wave (4) recovery completed at the 2.3615 peak. Members who sold the pair should be already risk free. Now, COPPER is correcting short term cycle from the 2.3615 low. As far as the price holds below that high , we could have wave (4) completed there and the commodity can resume trading lower. Otherwise break above 2.3615 would mean we are doing larger bounce that can see 2.52-2.61 area, which is next set of equal legs from the March 19th low.
Keep in mind market is dynamic and presented view could have changed in the mean time. You can check most recent charts in the membership area of the site. Best instruments to trade are those having incomplete bullish or bearish swings sequences.We put them in Sequence Report and best among them are shown in the Live Trading Room .
Elliott Wave Forecast