Since bottoming in January 2016 low at Copper $1.93, Copper has traded in a narrow range between $1.9 - $3.3. Earlier this year, the red metal collapsed to the lowest in more than 4 years at $1.9725. This happened due to the Covid-19 breakout around the world which dampens global growth. However, despite the extremely challenging environment in global economy, the metal has climbed back 50% in the past few months.
Several factors contribute to this rally: China’s economic recovery, massive stimulus by global central banks, and lower US Dollar. As China’s economy begin to recover in the second quarter of 2020, Copper started to climb its way up. Robust growth in China’s industrial and service sectors have supported the price of the metal, while other nations continue to combat the pandemic. Despite the resurgence of the virus, China’s factory activities continue to improve for fifth consecutive month in July 2020. China’s official manufacturing PMI rose to 51.1 in July 2020, beating the market expectation of 50.7.
The massive stimulus package by major central banks around the world to counter the economic fallout also set the floor and continue to support the price of the metal. Solid growth demand in China together with eventual revival in the manufacturing sectors of major economies can see Copper price to trade higher in the coming months.
Copper Monthly Chart
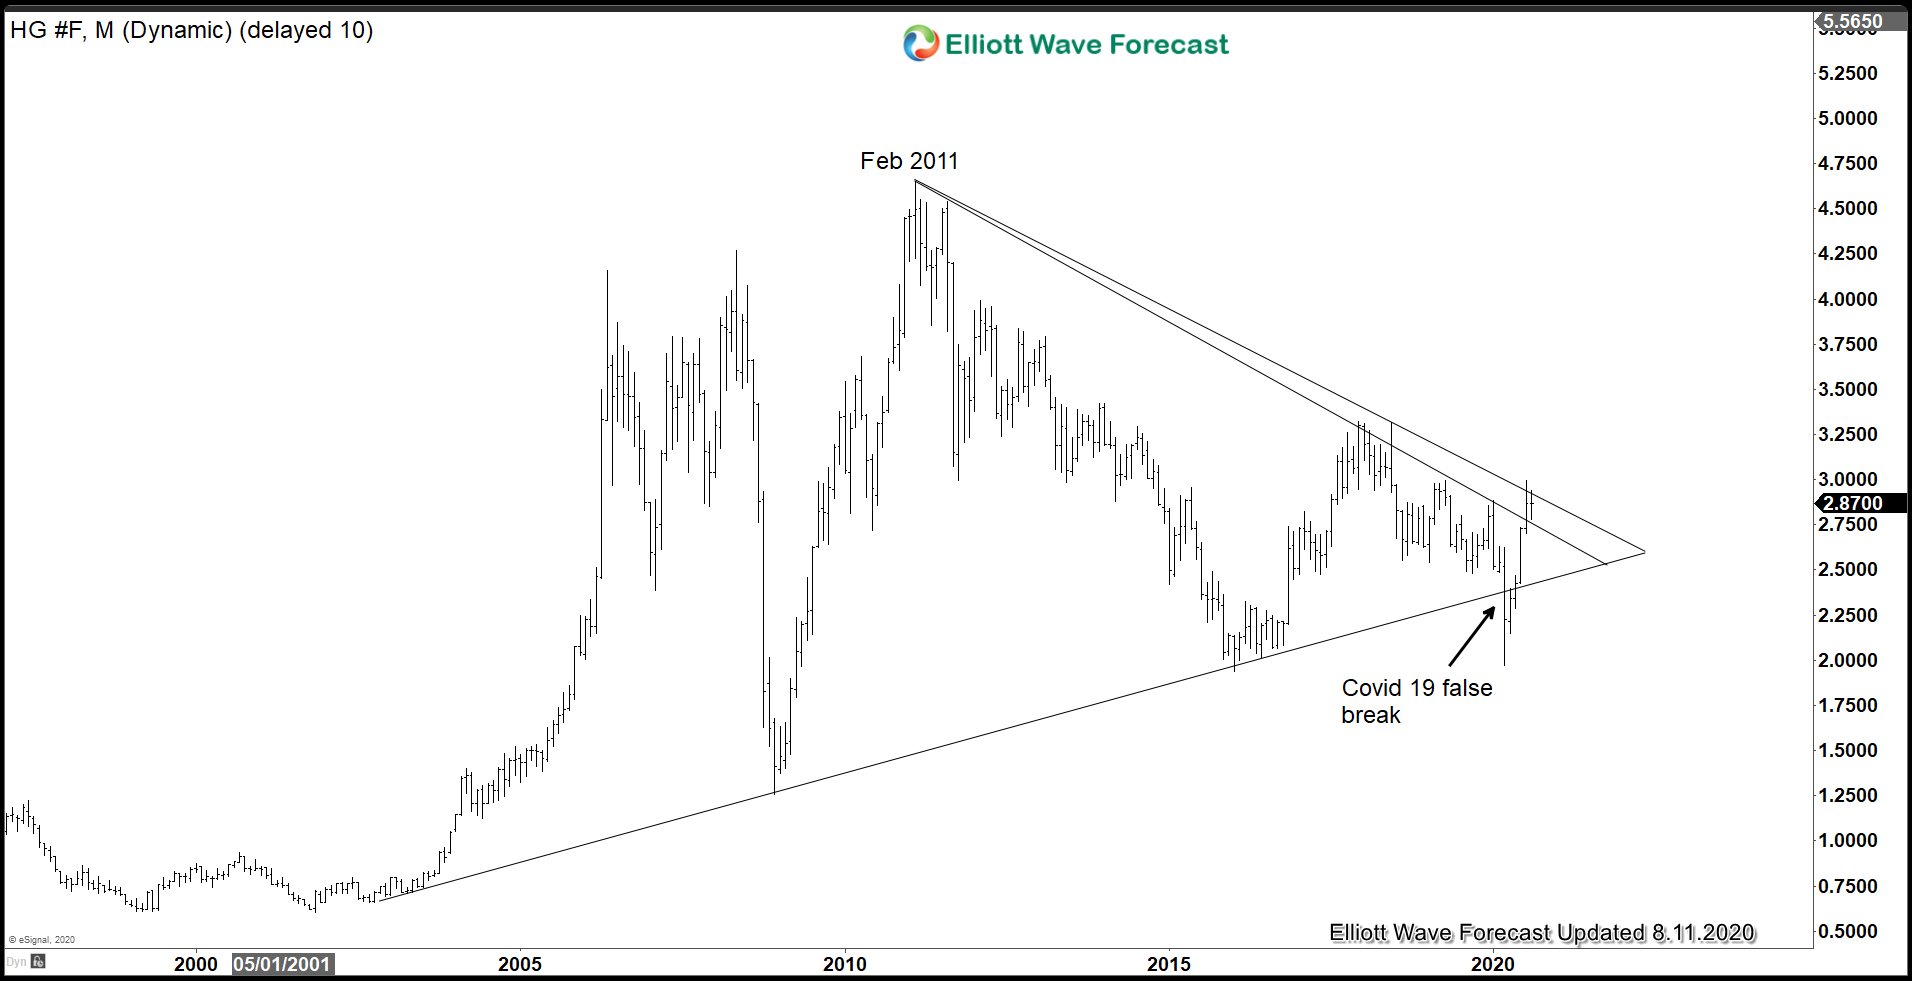
Monthly chart of Copper above shows the metal has traded in a narrowing range since 2002 low. The metal broke below the ascending trend line from 2002 low in March 2020 this year. However, the breakout was brief and the metal has since recovered. Currently, it’s pushing against the bearish trend line from Feb 2011 high. A break above the descending trend line can start a new bullish market for the metal.
Copper Weekly Elliott Wave Chart
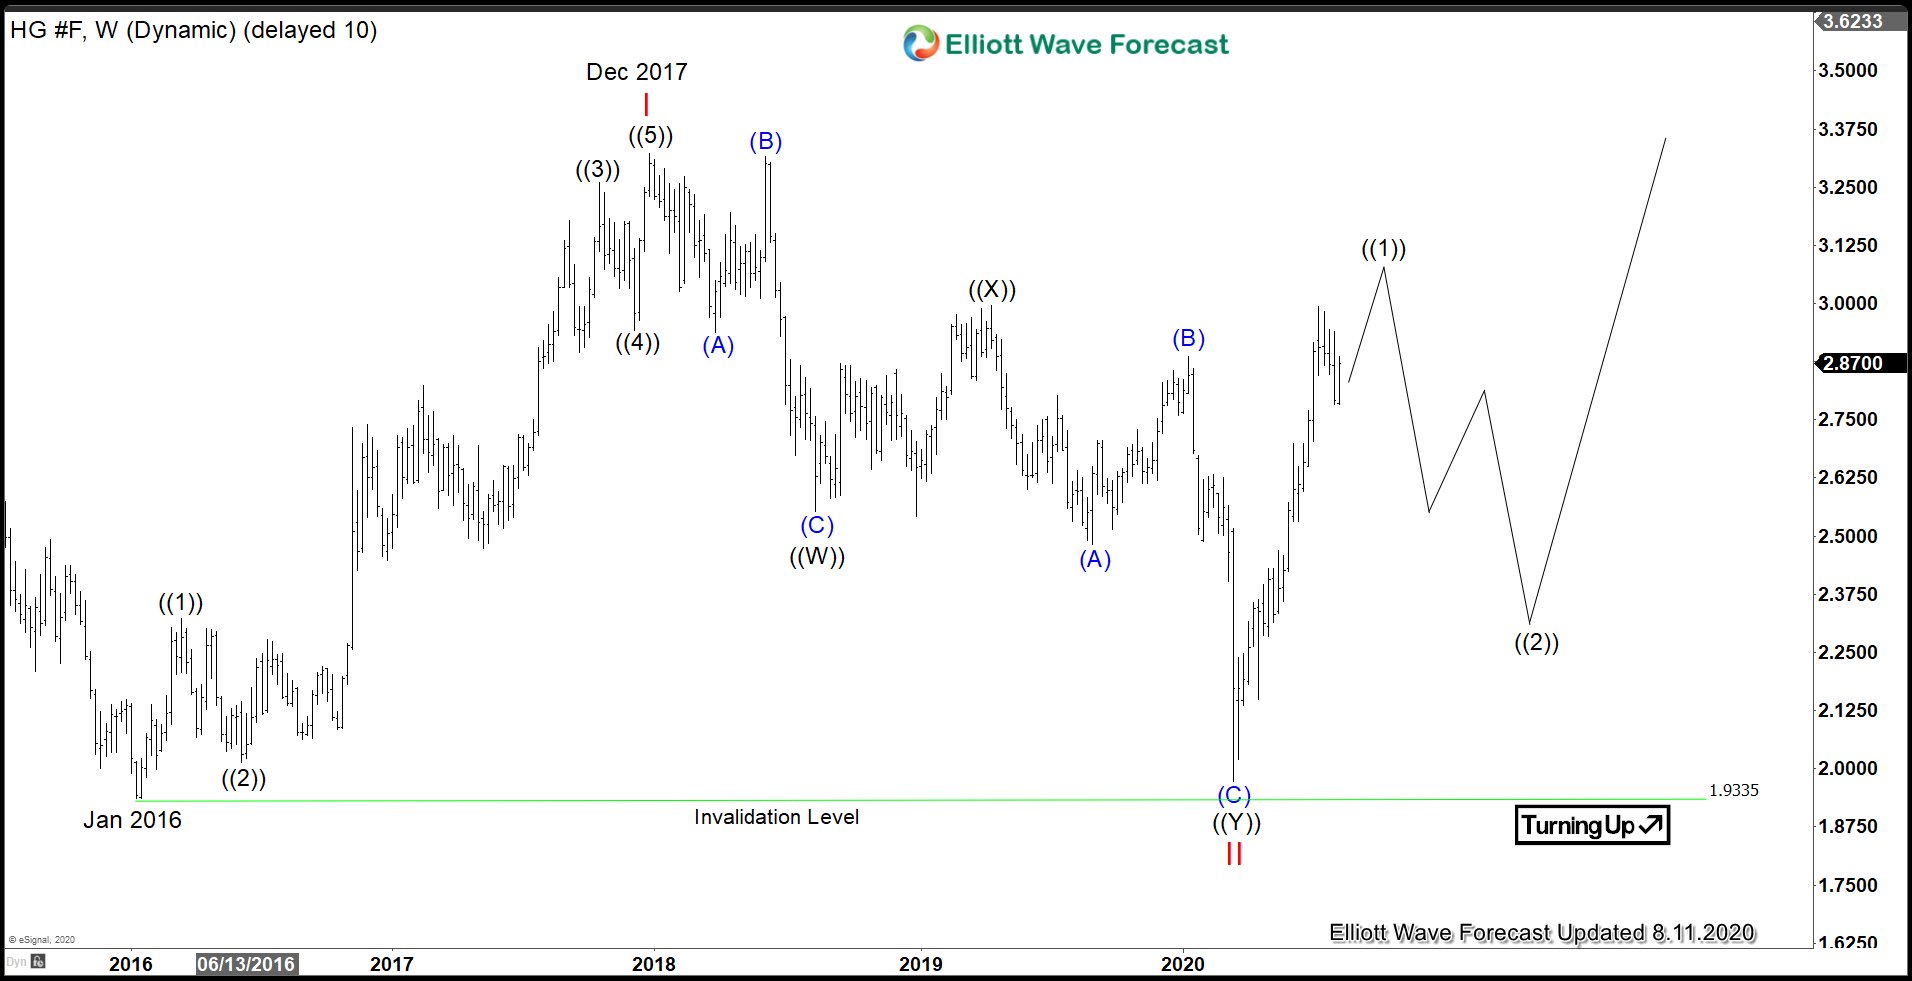
Weekly Elliott Wave Chart of Copper above shows the rally from January 2016 low (1.932) as 5 waves impulse, which ended either wave I or wave A. Then the pullback to $1.972 in March 2020 earlier this year ended wave II or B. The metal has since rallied higher within wave III. The rally from March 2020 low also looks impulsive and soon should end wave ((1)). Afterwards, it should pullback in wave ((2)) to correct the rally from March low in 3, 7, or 11 swing before the rally resumes.