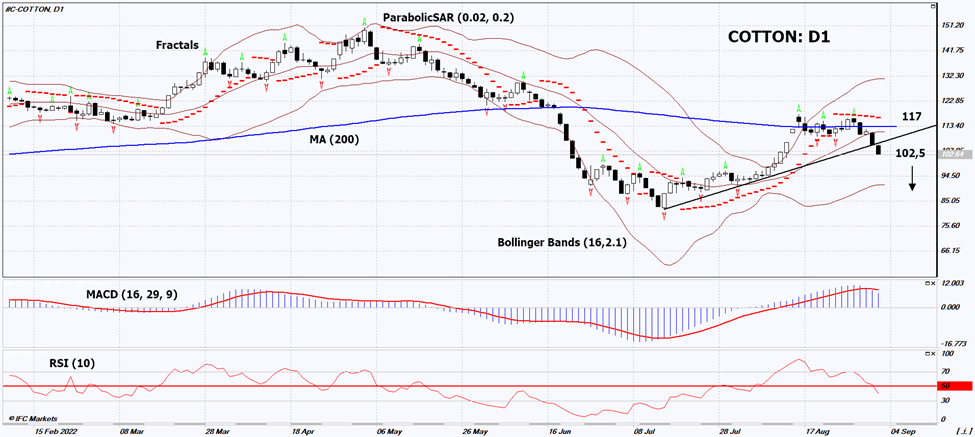
Cotton Technical Analysis Summary
Above 102,5
Buy Stop
Below 117
Stop Loss
| Indicator | Signal |
|---|---|
| RSI | Neutral |
| MACD | Sell |
| MA(200) | Neutral |
| Fractals | Sell |
| Parabolic SAR | Sell |
| Bollinger Bands | Neutral |
Cotton Chart Analysis
Cotton Technical Analysis
On the daily timeframe, COTTON: D1 has broken through the uptrend support line and the double top. A number of technical analysis indicators formed signals for further decline. We do not rule out a bearish movement if COTTON: D1 falls below the latest low: 102.5. This level can be used as an entry point. The initial risk limit is possible above the last upper fractal, 200-day moving average line and Parabolic signal: 117. After opening a pending order, we move the stop following the Bollinger and Parabolic signals to the next fractal high. Thus, we change the potential profit/loss ratio in our favor. The most cautious traders, after making a trade, can switch to a four-hour chart and set a stop loss, moving it in the direction of movement. If the price overcomes the stop level (117) without activating the order (102.5), it is recommended to delete the order: there are internal changes in the market that were not taken into account.
Fundamental Analysis of Commodities - Cotton
US cotton consumption has declined. Will the COTTON quotes continue to decline?
According to USDA, US cotton consumption in July 2022 amounted to 607 bales or 301 thousand pounds, which is 2 times less compared to July 2021 and 8% less than in June 2022. Note that earlier USDA predicted a reduction in cotton consumption for the entire 2022/2023 season by only 10% compared to the 2021/2022 season. Meanwhile, against the background of declining demand, US cotton stocks in July 2022 also doubled compared to July last year and amounted to 2.04 million pounds. The US is the 3rd largest cotton producer in the world (after China and India) and recently became the 1st largest cotton exporter in the world thanks to the US-China Trade Agreement.