Crude Oil Hunter #20250217
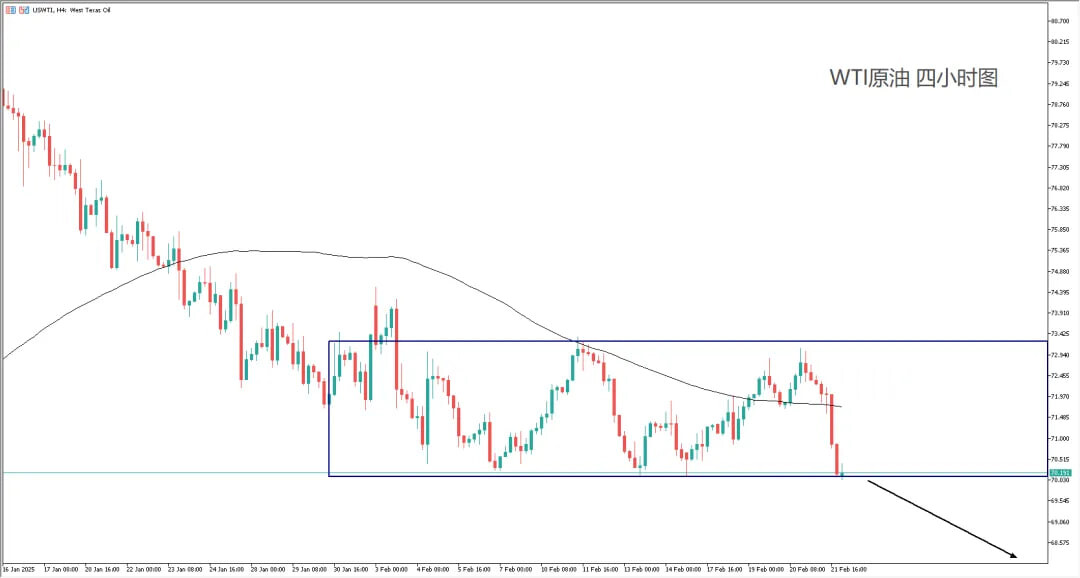
The 100-day moving average is moving downward, showing strong bearish momentum like gold ![]() , but before breaking the key previous low support of 70, the view of oversold rebound in oil prices
, but before breaking the key previous low support of 70, the view of oversold rebound in oil prices ![]() is still maintained. The trading strategy is mainly based on small stop loss and buying on dips.
is still maintained. The trading strategy is mainly based on small stop loss and buying on dips.
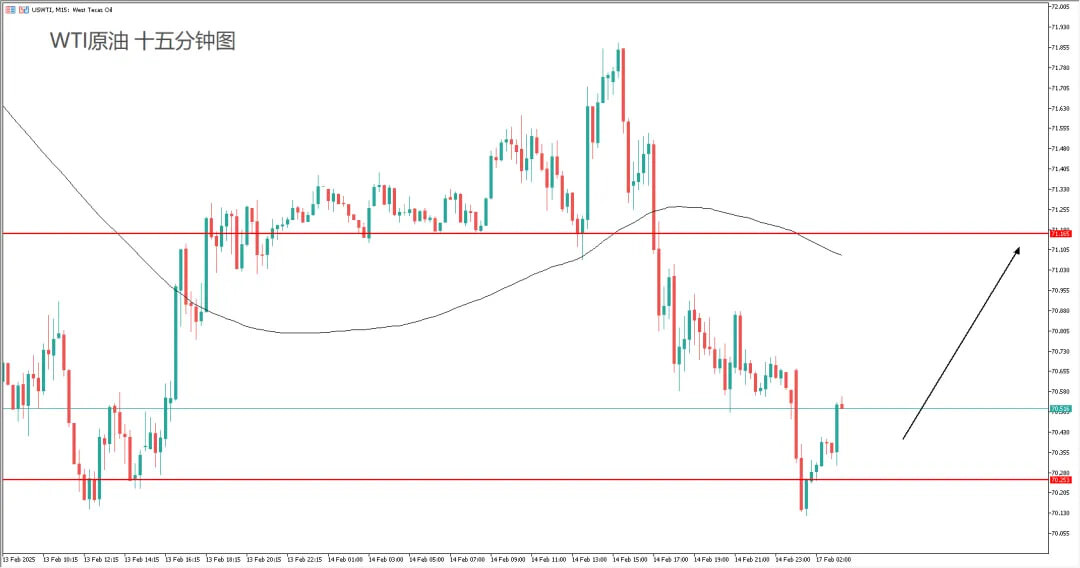
![]() Trading strategy: (mean reversion) Buy on dips above 70.25
Trading strategy: (mean reversion) Buy on dips above 70.25
![]() Resistance reference: 71-71.15
Resistance reference: 71-71.15
![]() Support reference: 70.25-70.5; 70 (break stop loss)
Support reference: 70.25-70.5; 70 (break stop loss)
![]() USWTI 30-minute chart
USWTI 30-minute chart ![]()
![]()