Cotton is one of soft commodities, along with sugar, coffee, orange juice and cocoa. In early centuries, Alexander the Great has brought cotton from Pakistan to Europe. Much later and finally, it has obtained the dominance in textile manufacturing during the British industrial revolution in the 18th century. It was so critical that at times of Civil War in North America the Confederate bonds sold in Europe were backed by cotton. Today, the largest producers and, at the same time, the largest consumers of cotton are China and India. One can trade Cotton futures at ICE owned New York Board of Trade in contracts of 50’000 pounds each under the ticker CT #F. Also, there are similar contracts at CME owned NYMEX under the ticker TT #F.
Currently, we see other soft commodities like orange juice, coffee and sugar turning higher after a long period of depressed prices. Based on the correlation within group of softs, the cotton is expected to turn higher as well. In particular, weekly wave structure of CT #F supports that bullish view. Will the rally in the cotton prices make it reality that an average person will be able to afford only 2-3 new clothes per year?
From May 2021, we have forecasted a strong initial wave higher. From March 2020 until May 2022, the cotton prices have trippled. Then, in June 2022, we forecsted a short-term pullback to provide an opportunity to join the rally. However, market has decided for a larger zigzag structure lower. Now, we see the channel break to the upside and price nesting action. In the current article, we provide with an update: discussion of the wave structure, next targets and support areas.
Cotton Quarterly Elliott Wave Analysis 10.01.2023
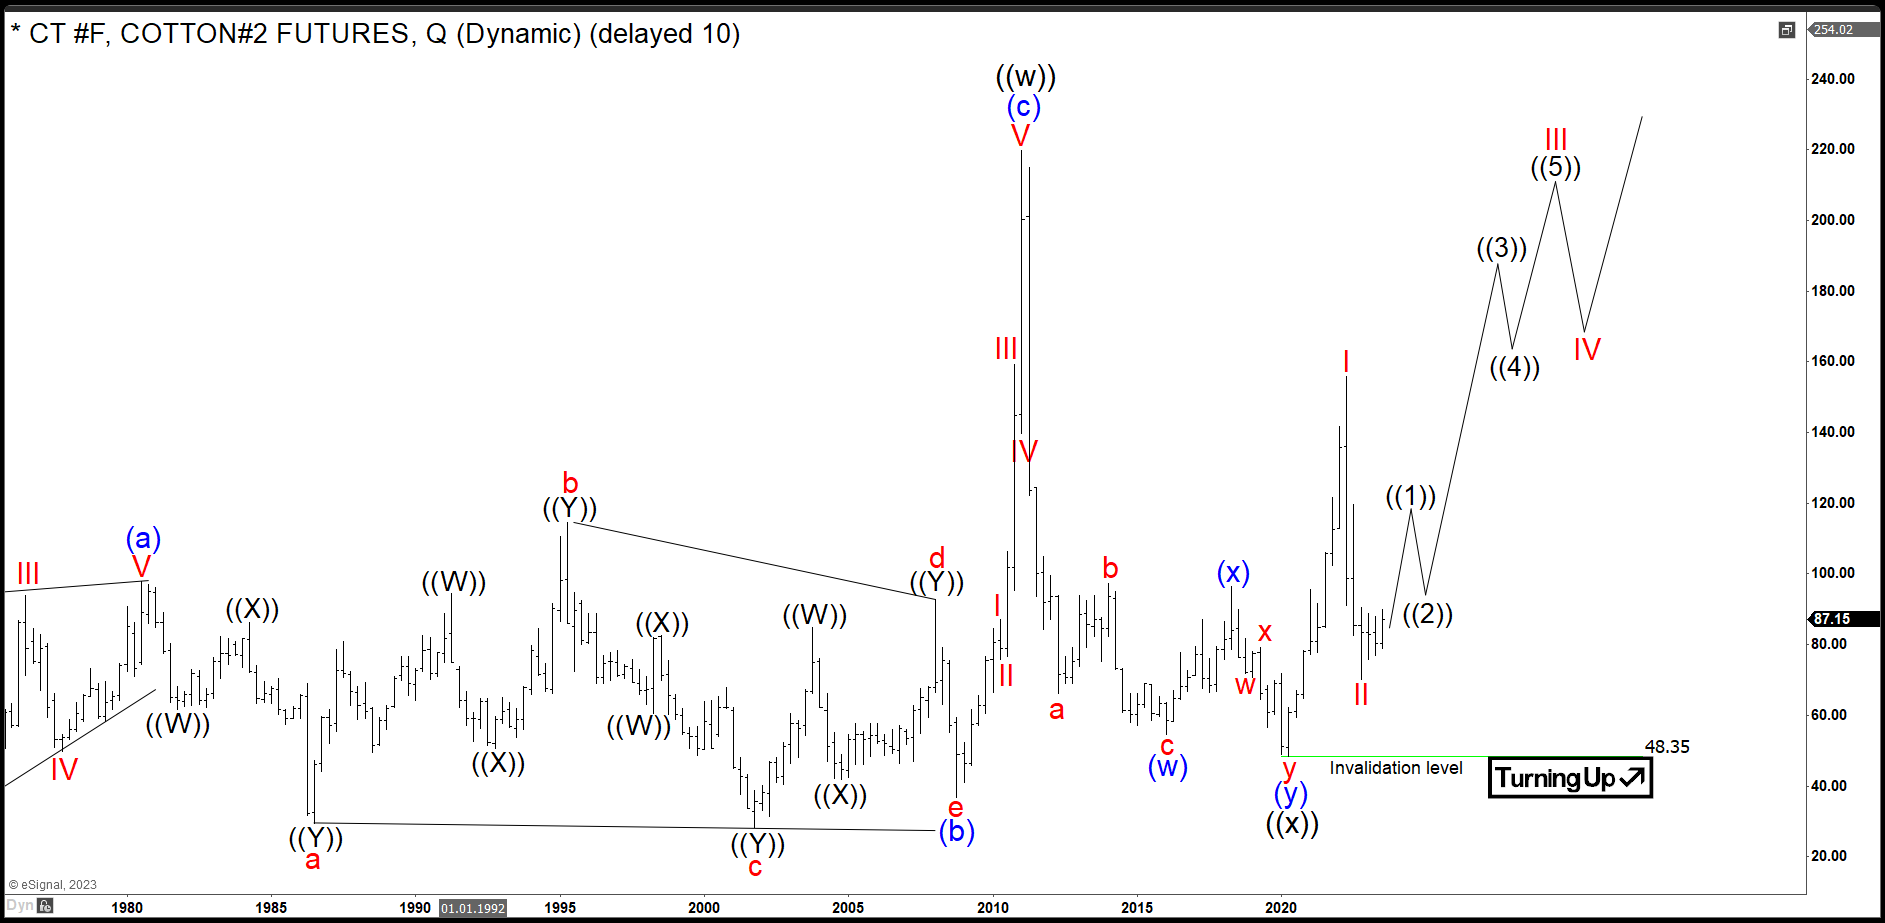
The quarterly chart below shows the cotton front contract CT #F at NYBOT. Historically, cotton has been traded at New York Cotton Exchange since 1870. Later, it moved to NYBOT and the chart data shows cotton prices from 1972 on. From the lows, the prices have developed a corrective cycle higher in black wave ((w)) of a grand super cycle degree. One can see it as an Elliott Wave zigzag pattern. Hereby, blue wave (a) has demonstrated a leading diagonal structure and has ended in 3rd quarter of 1980. From there, a running triangle in wave (b) has caught the market in range bound oscillations until the 4th quarter of 2008. From there, the sideways market has resolved into an acceleration higher within an impulsive move in wave (c). Hereby, cotton has made 6x in price and saw the all-time highs in the 1st quarter of 2011 at 219.70.
From the all-time highs in 2011, a correction lower in wave ((x)) has unfolded as an Elliott Wave double three pattern. In 9 years, CT #F has become cheaper by 78% reaching 48.35 level. It is the preferred view that an important bottom on March 2020 has been set and the correction has ended. From the lows, a new multi-decade cycle within black wave ((y)) may have started.
For 2024-2040, the expectations are to retest if not to break above the all-time highs. The target for wave ((y)) will be 268-404 area. From current levels, the cotton should, therefore, double to tripple in price.
Cotton Weekly Elliott Wave Analysis 10.01.2023
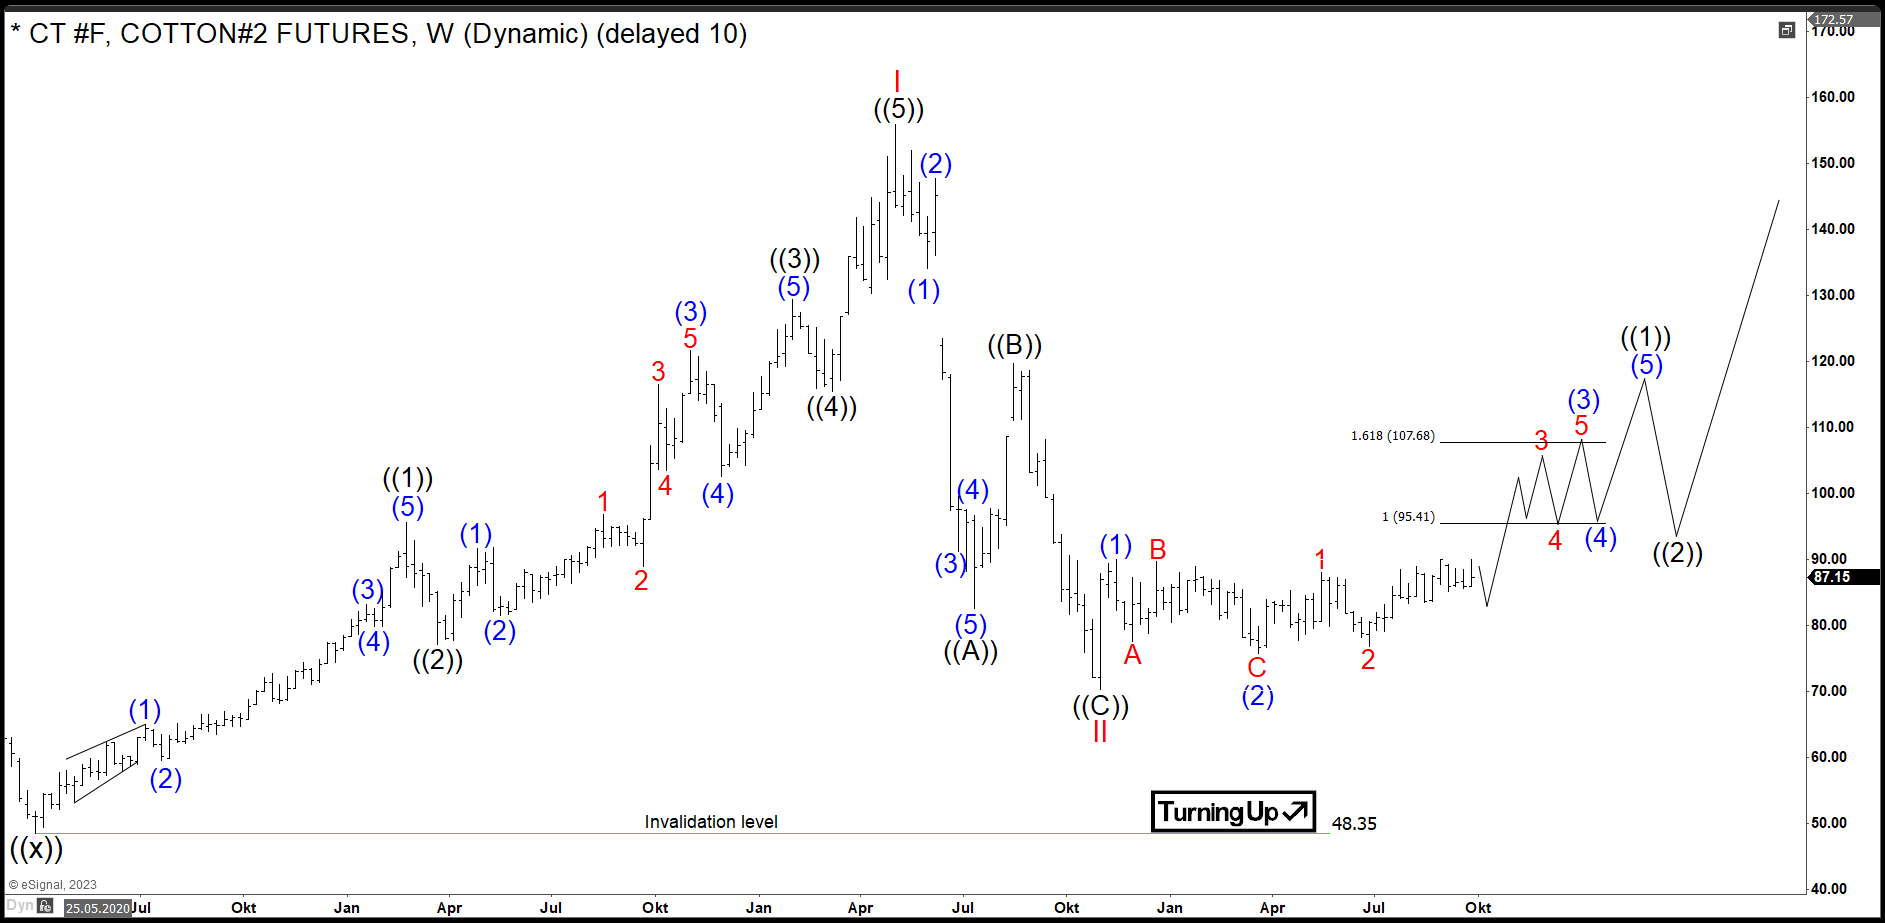
The weekly chart below shows in more detail the first stages of the new cycle within grand super cycle in black wave ((w)). From March 2020 lows, a clear impulse in red wave I has printed a top in May 2022 at 155.95. A pullback in wave has developped an Elliott wave zigzag pattern. Firstly, black wave ((A)) has set a low in July 2022 at 82.54. Secondly, bounce in black wave ((B)) has set a connector in August 2022 at 119.59 highs. Thirdly, price has broken 82.54 lows confirming next extension lower. However, black wave ((C)) has not reached the 100% extension. Hereby, it has truncated at 0.618-0.786 extension area. As a matter of fact, the sideways move has broken the descending chanel. It is the preferred view that red wave II has ended in October 2022 at 70.21 lows and new bullish cycle in red wave III is in progress. The target for red wave III is 177.75-244.18 area and even beyond.
In shorter cycles, blue waves (1)-(2) of black wave ((1)) of red wave III have ended and blue wave (3) has been confirmed. Indeed, price action broke 89.92 highs. Now, based on the bullish sequence, wave (3) should reach 95.41-107.68 area and even higher. Investors and traders can, therefore, be looking to buy any clear pullback in 3,7 swings against 70.21 lows expecting accelereation higher to take place.