Currency Strength & Weakness without Indicators!

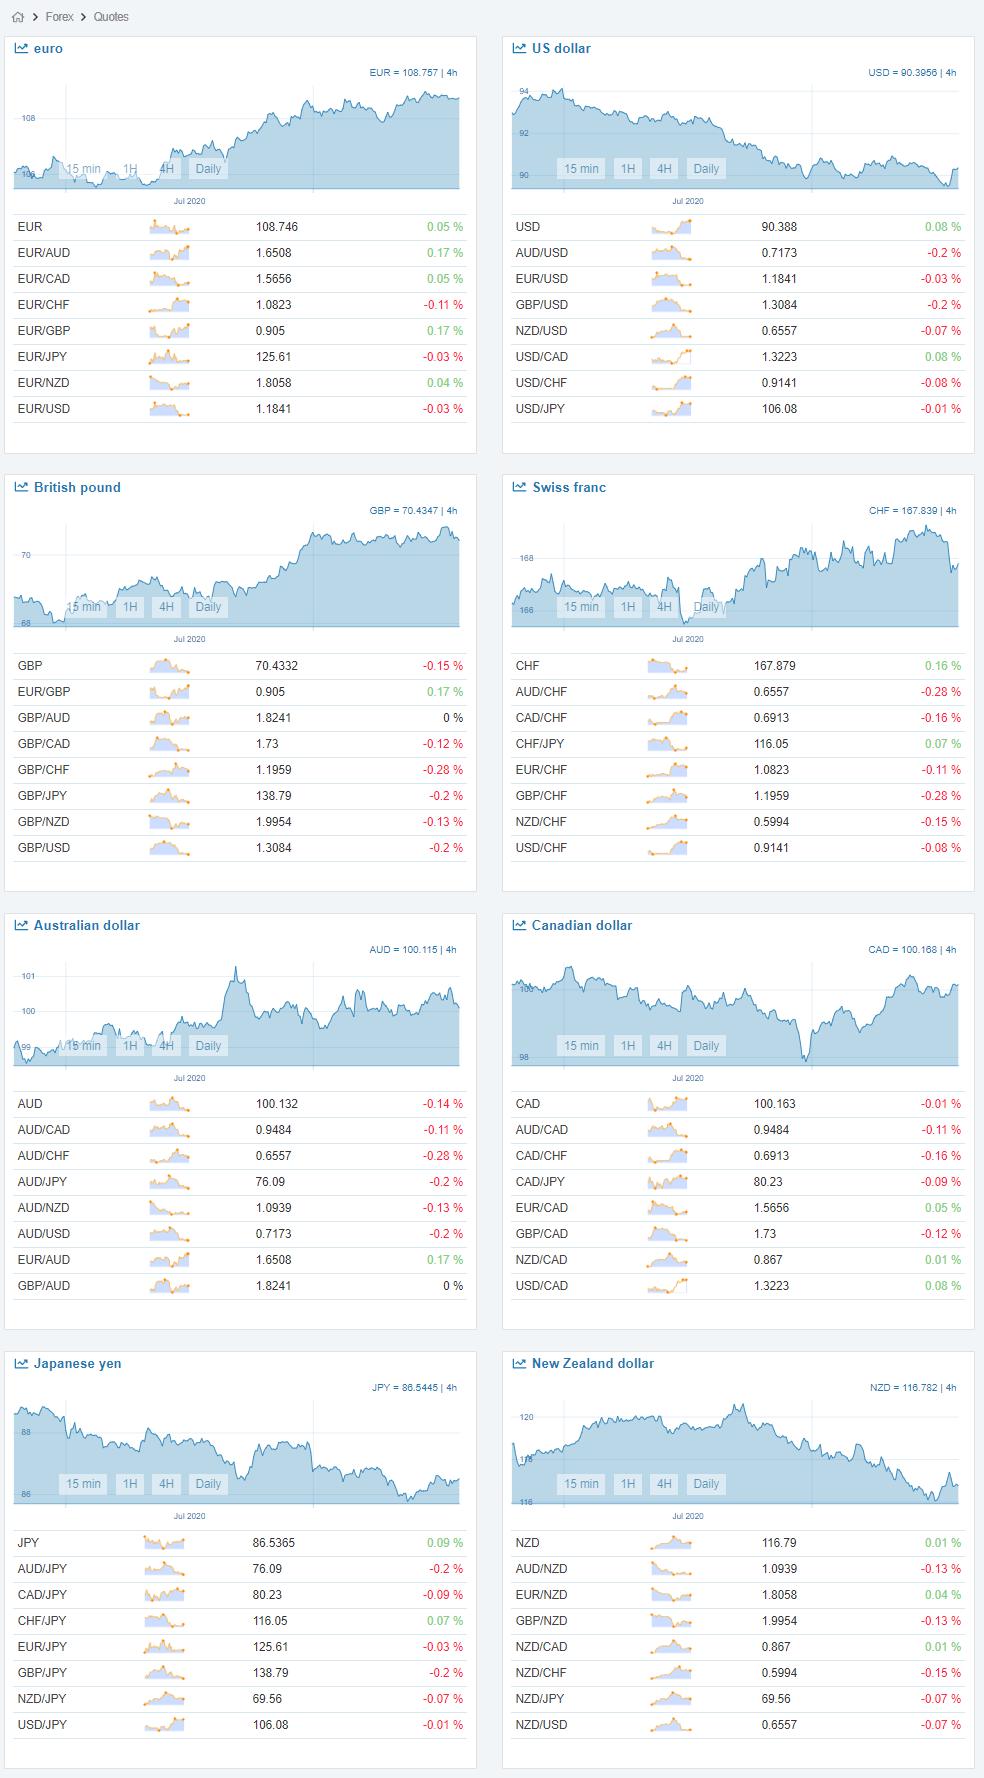
A huge shout out to @frandlost, who has found an alternate data source and a way to trade the Currency Strength and Weakness Strategies… Currency Index - Mataf

This site draws on the fantastic TradingView Chart architecture and allows you to use a similar strategy to find entries and exits across all 28 pairs. Build your own CSM charts by using the -Compare- feature to overlay various currencies across multiple time periods…

(See Below)


AUDUSD 4H Chart - AUD x USD… the AUDUSD should be in a gradual uptrend since 25th April.


Scalp XAUUSD on a 5 min Chart - USD is strong… Gold should move down…
This tool can be used for many strategies or trading concepts if you open your eyes to new ideas.

Trial this concept on a DEMO account to gauge its effectiveness for either confirmation or entries and exits to simplify your trading… Hope this is of help…

3 Likes

Note of interest as “things finally start to sink in” …

I have a basic currency strength meter up on my chart in addition to a buy/sell ratio indicator. The buy sell indicator shows a long “green light” and the with the “buys” in the minority and the CS meter shows GBP strength against the US dollar but the majority of of positions are short.

Mmmmm. I think you can see where I went long.

Just food for thought.

KC

thanks for this -exactly what I needed!

Another long term CSW without Indicators strategy using TradingView data…

Nice and simple way to filter SW Currencies… Give it a try on a Demo…

3 Likes

Crazy Times, Crazy Markets…

Stream of Consciousness strategy… Just going to throw a concept I am considering developing into the fray here… rating currencies via the economic strength / weakness of each of the major origin countries.

I haven’t finalised the input data to generate the rating formula… but it will include, financial indicators, effects of pandemic etc…

So, as of the (New York Close) 8.00am 10th July 2020 (UTC+10) the SOC rankings are…

NZD - AUD - JPY - CHF - CAD - GBP - USD - EUR…

Now when compared to the proven SWA formula (Distance from the SMA200 on a 4H TF)

NZD - AUD - CHF - EUR - GBP - CAD - JPY - USA…

We can make an attempt to predict currency movement… NZD, AUD, CHF, CAD, USD are all pretty much in their correct positions of strength (compared to the SWA).

We should expect over the next couple of trading periods (Say FRI 10th - WED 15th) for…

The GBP to strengthen against the NZD, AUD, CHF and CAD…
The JPY to strengthen against the CHF, CAD, GBP and EUR…
The EUR to weaken against the GBP, CAD, JPY and even the USD…

Positions applied and trialed on a DEMO… 35 pip TP’s with NO SL’s…

Lets see what happens over the next few days…

2 Likes

Thanks for another useful video. Keep sharing.

Update after 12 hours… 210 pips closed in profit… 2%+ on Account and carrying only 0.3% DD

Needs more work… Check in again on Monday…

Note: Not sure why margin is so high on CHF… It’s a beta Platform, so might be the issue

Update after 24 hours… 280 pips closed in profit… 3%+ on Account and carrying only 0.6% DD

Check in again on Monday…

Seems intriguing and promising. How is the data derived to get the SOC rankings? It looks like the formula is going to be more complex than the SWA formula.

Hey Trends! This sounds like something we should be paying attention to. If it’s not too much trouble, may I request you to please create a new thread for the Stream Of Consciousness strategy?

Also, someone posed a question related to S/W trading (link below). I also have the same question. Not sure I really get how to trade using S/W analysis. Perhaps I’m just dense. :slight_smile: Would you (or @Dennis3450) be able to elaborate on it? Some chart images and examples of entries and exits that you may have taken along with the rationale behind the trade might be helpful.

For anyone that is interested, I MAP Dennis’s data from the Currency Strength and Weakness Thread on a daily basis… I have posted up the results for anyone to use, copy, study etc… on here, so as not to clutter his brilliant thread.

July 2020 is now complete… Crazy, Crazy times… StaySafe people.

4 Likes

Another fantastic FREE resource allowing traders to utilise CSW Strategies away from Charts…

Follow this link to the Mataf Currency Strength charts you see in the diagram above.

1 Like

If you think even more deeply about it, they are NOT pairs, they are the individual 8 currencies.

These make up the 28 PAIRS of 7 majors and 21 minors, as shown on the graphic.

You can trade the exotics at your own peril. IMHO, the exotics with USD are just a proxy for USD being strong or weak anyway.

1 Like

Ok, this this week I thought I might add some content to this thread by demonstrating how to trade inside Dennis’s Currency Strength and Weakness matrix (Thread here).

Below is the matrix for September 2020… I add currency traces to the matrix on a daily basis which displays in detail what is really happening with each of the Major currencies.

Most times, a currency “crosses” over another (clearly visible when color traces are added), it is an opportunity to trade the movement and enter a small trend or a successfully early entry into a substantial trend… Last week (15th) you can clearly see the cross of a strengthening JPY over weakening EUR… resulting in a 200+ pip win over the following couple of days… Clearly displayed is the JPY’s strength over the preceding 11th and 14th and the EUR weakening over the same period…

The “Edge” of this strategy is the percentages tell the real story… not the positions… have a close look at the EUR… Even though it only moved one spot lower in the matrix, it has actually weakened consistently from the 11th… allowing the opportunity to trade any of the other Majors… strengthening over the same period… Study the image above, comprehend it, and test it against your charts…

Over the week I will show how to select currencies “of interest” and how to apply the strategy described above… 21st… AUD is weakening… noted… and at this current time all other Majors are weakening as well, the JPY against the other 7 Majors is really the only opportunities available.

Lets see tomorrow’s (22nd) result at the close of the US Session and we should have a clearer picture of what the market is going to offer…

2 Likes

Another way to trace Currency movements is to use a simple CSW Meter as shown below which displays updates 6 times over 24 hours (4 hour TF)… Using this in conjunction with the Matrix Strategy gives you a visual reference to what the market is really doing at any given time…


Settings: 200 Periods | 4 Hour TF (As the Matrix Formula)

ie: Clearly displayed, within the Matrix (Post above) and shown in the CSW Meter (above) is the recent cross of the CAD below the JPY… a “Pair of Interest” for the 21st.

Resources: Ctrader CSW | Metatrader 4 | Tradingview (TBA)

1 Like

Nice post trends, looking forward for the succeeding posts and learn from it.

Tuesday (UTC+10) We can see that the AUD has weakened substatialy from yesterday and the JPY has strengthened against all other Majors as was correctly indicated 24 hours ago… Simple…

And our short from yesterday’s data, the CADJPY is now up 70+ points early in the Asian session… I’m not even going to include other positions opened with a strong JPY yesterday…

Now we have to choose the best opportunities from this weeks tumultuous market… And there is lots to choose from…

On appearance it looks as if he USD has shot up the rankings… wrong, in actual fact it is weaker than the 17th and 18th… ALL currencies have once again weakened against the Yen…

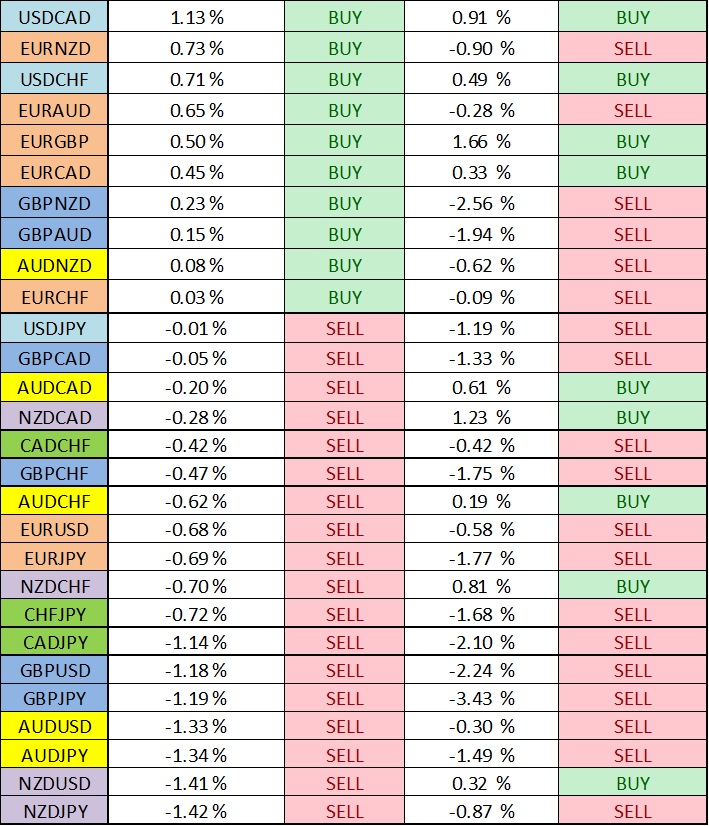
So we look for the weakest weak and the strongest weak. This is done by calculating the percentages within the Matrix… ie: CAD has weakened -1.27% since the 17th (3 periods) while the JPY (base) is still 0.00% confirming our short on the CADJPY is still in play 24 hours later… Let’s find another pair…

NZD has weakened 1.35% since 17th (3 Periods) and the CHF is 0.82% weaker over the same period.
This leaves a variance of only ~0.5% (I prefer 1%+ Variance) giving us another pair, other than all the JPY crosses, to keep an eye on.


NZDCHF is changing, AUD is weak, JPY Still Strong, confirmed on the CSW Meter… (4 Hour)

OTC market behavior has to be carefully considered when using the CSW strategy. It is generally what can cause the prefered pair (ie: Strongest/Weakest Pair) to reverse sharply from each end of the Matrix…

Once a sizable volume and momentum is obvious, the “market” will Sell into Long and Buy into Short sentiment. As happened yesterday with most of the JPY pairs… This is how the LP’s take liquidity out of the market and make their money… the Brokers are just along for the ride…

Summary: ALL JPY pairs remain shorting opportunities…

Edit: Is there a possible arbitrage opportunity between the Matrix and the CSW Meter???

Nice trend…Will keep up with it.

Difference from the 17th and 21st. This is 3 periods. When you bought USDCAD and shorted NZDJPY. You could have gained a lot of pips from now.

1 Like