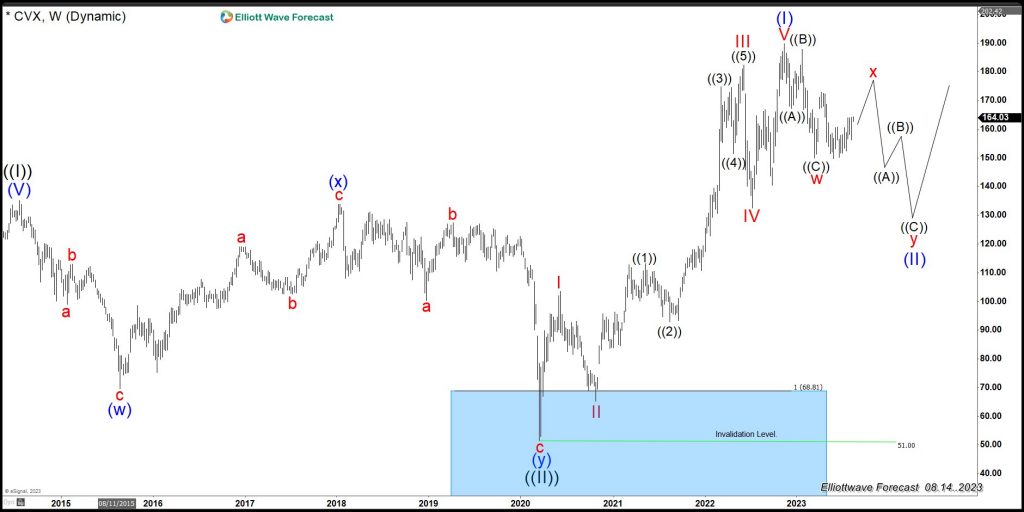
Chevron (ticker symbol: CVX) reacted nicely since we presented the blue box (high-frequency) area in 2020. You can see the second chart below for the blue box in CVX. The stock since then made a nice five waves advance from the blue box, and now it is correcting the rally. Chevron has created a bullish sequence within Grand Super Cycle. A similar energy stock Exxon Mobil (ticker symbol: XOM) confirms this view
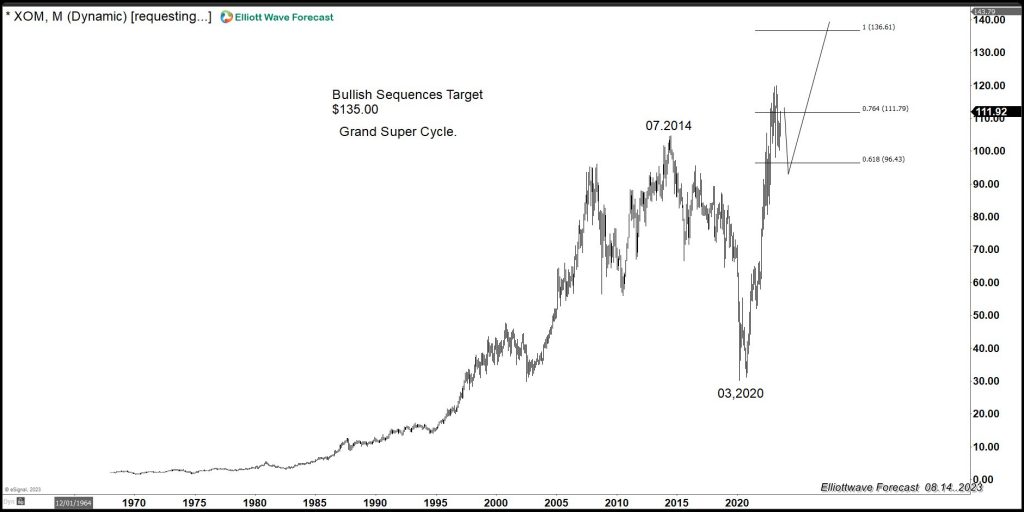
Exxon Mobil (XOM) Monthly Elliott Wave Chart
The chart above shows XOM (Exxon) within the Grand Super Cycle. The stock shows a bullish sequence, which will support all the stocks related to Oil. It should also support Oil within the Grand Super Cycle. XOM runs the same cycles as CVX and should have ended the rally since 03.2020 and now correcting the cycle. Chevron pullback should be bought in three, seven, and eleven, providing an excellent buying opportunity by the end of 2023. This aligns with Indices and the $USDX selling.
Chevron (CVX) Weekly Elliott Wave Chart
The chart above shows the CVX( Chevron) structure and how it rallied from the blue box area. The rally unfolded as an impulse and now it is pulling back. The stock has a bullish sequence and pullback should find buyers in three, seven, and eleven swing. The stock also denies any crash across the World Indices. The energy stocks show the future path of Indices, and world indices might be entering a wave III or (III) very soon. The pullback in World Indices should also provide a good chance to buy in 3, 7, or 11 swing.
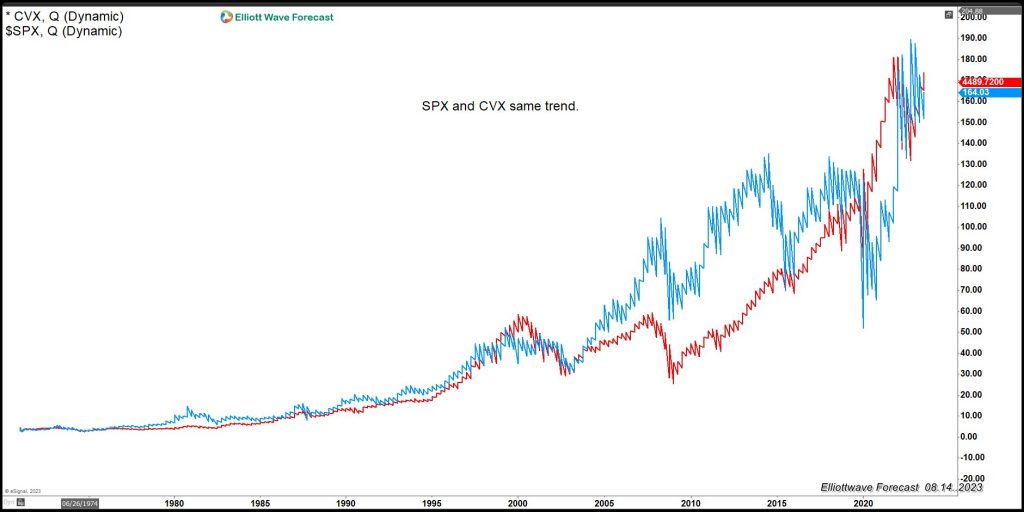
Overlay of S&P 500 (SPX) and Chevron (CVX)
The chart above shows the overlay of $SPX and $CVX together. It shows they share the same cycle and overall trend. As we mentioned above, a pullback is now underway in energy stocks and Indices. Once the pullback is complete, it should accelerate to the upside again. Ultimately, we believe in the one market-only concept. The relationship between XOM, CVX, and SPX is clear. A huge rally will soon happen and buying the dips soon will be a good opportunity.


