Similar to most instrument within the energy sector, Chevron (ticker: $CVX) is trading sideways to lower since the peak on 04.08.2019. $CVX is showing a five waves advance since the lows at $69.65, which happened on 08.24.2015. This low is also the same low in Crude Oil, which we believe ended the Grand Super cycle correction and now starts a new cycle into higher levels. The following seminar explains our view in the sector and why soon we will be trading higher. We are looking for opportunities to buy the sector, and we like the waves structure presented in Chevron. The Instrument is showing a nest from 08.24.2015 low, which is a combination of more than five waves in one direction. The follow chart illustrates the nest:
Chevron Shows a Possible Nesting Impulse From 8.24.2015 Low
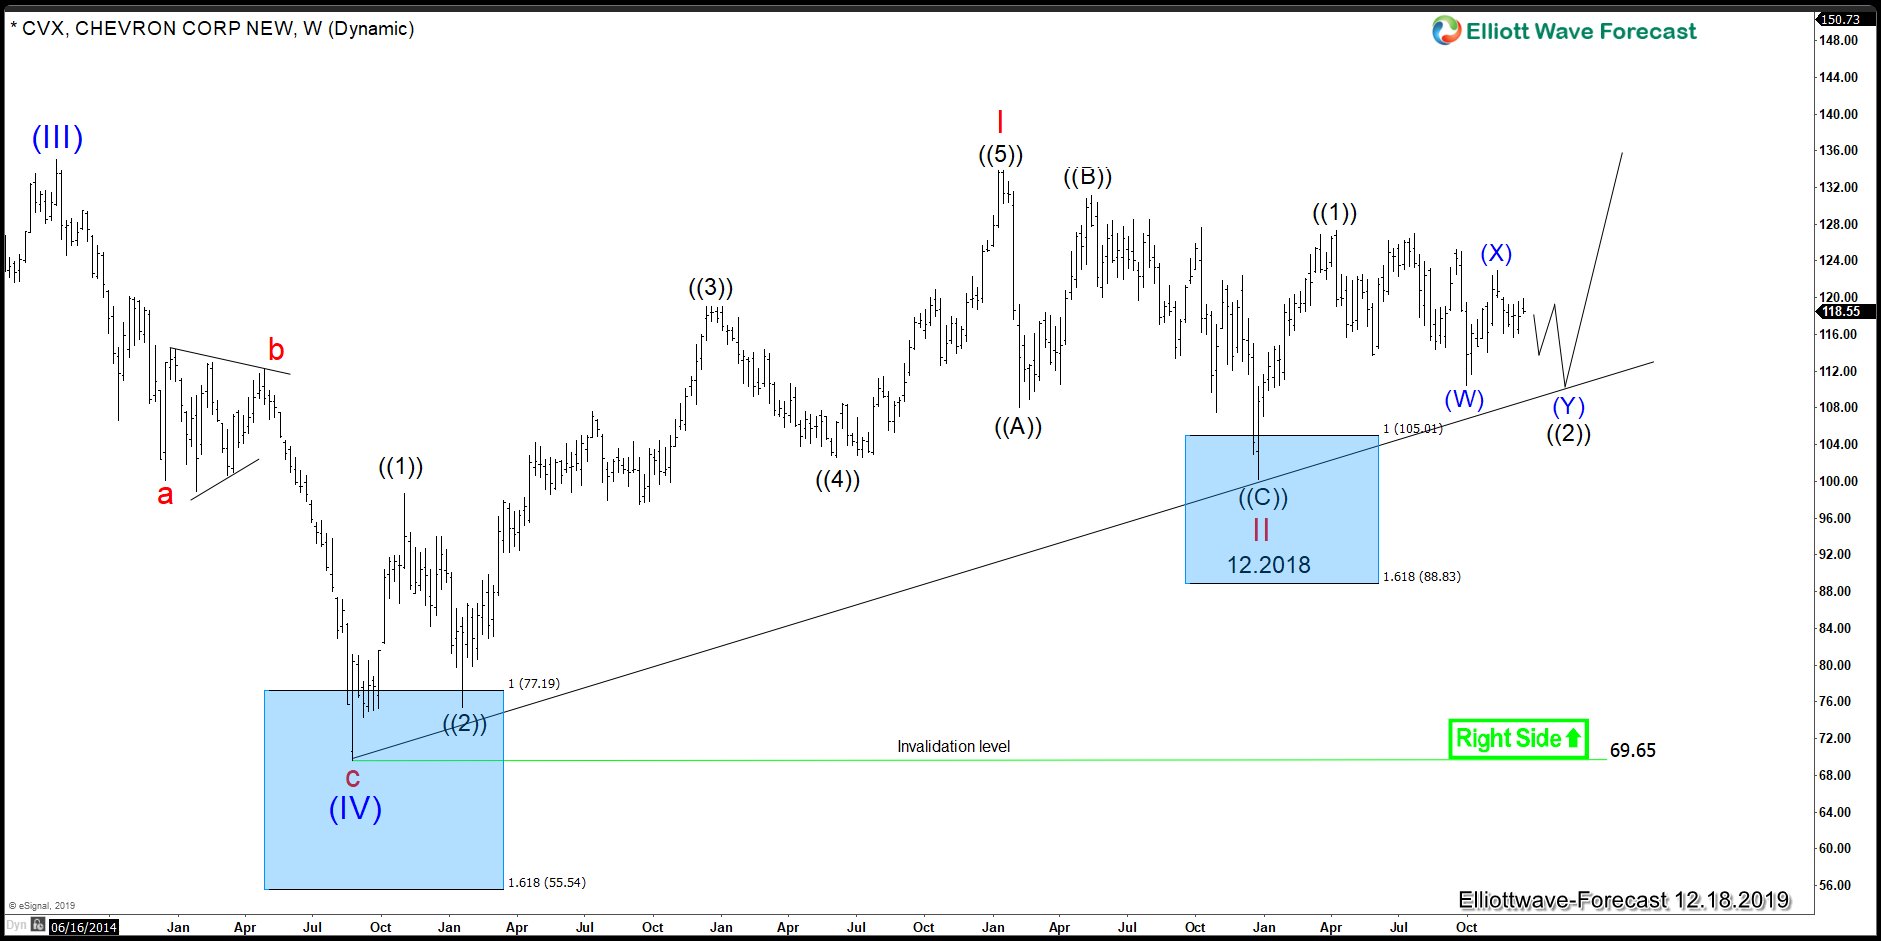
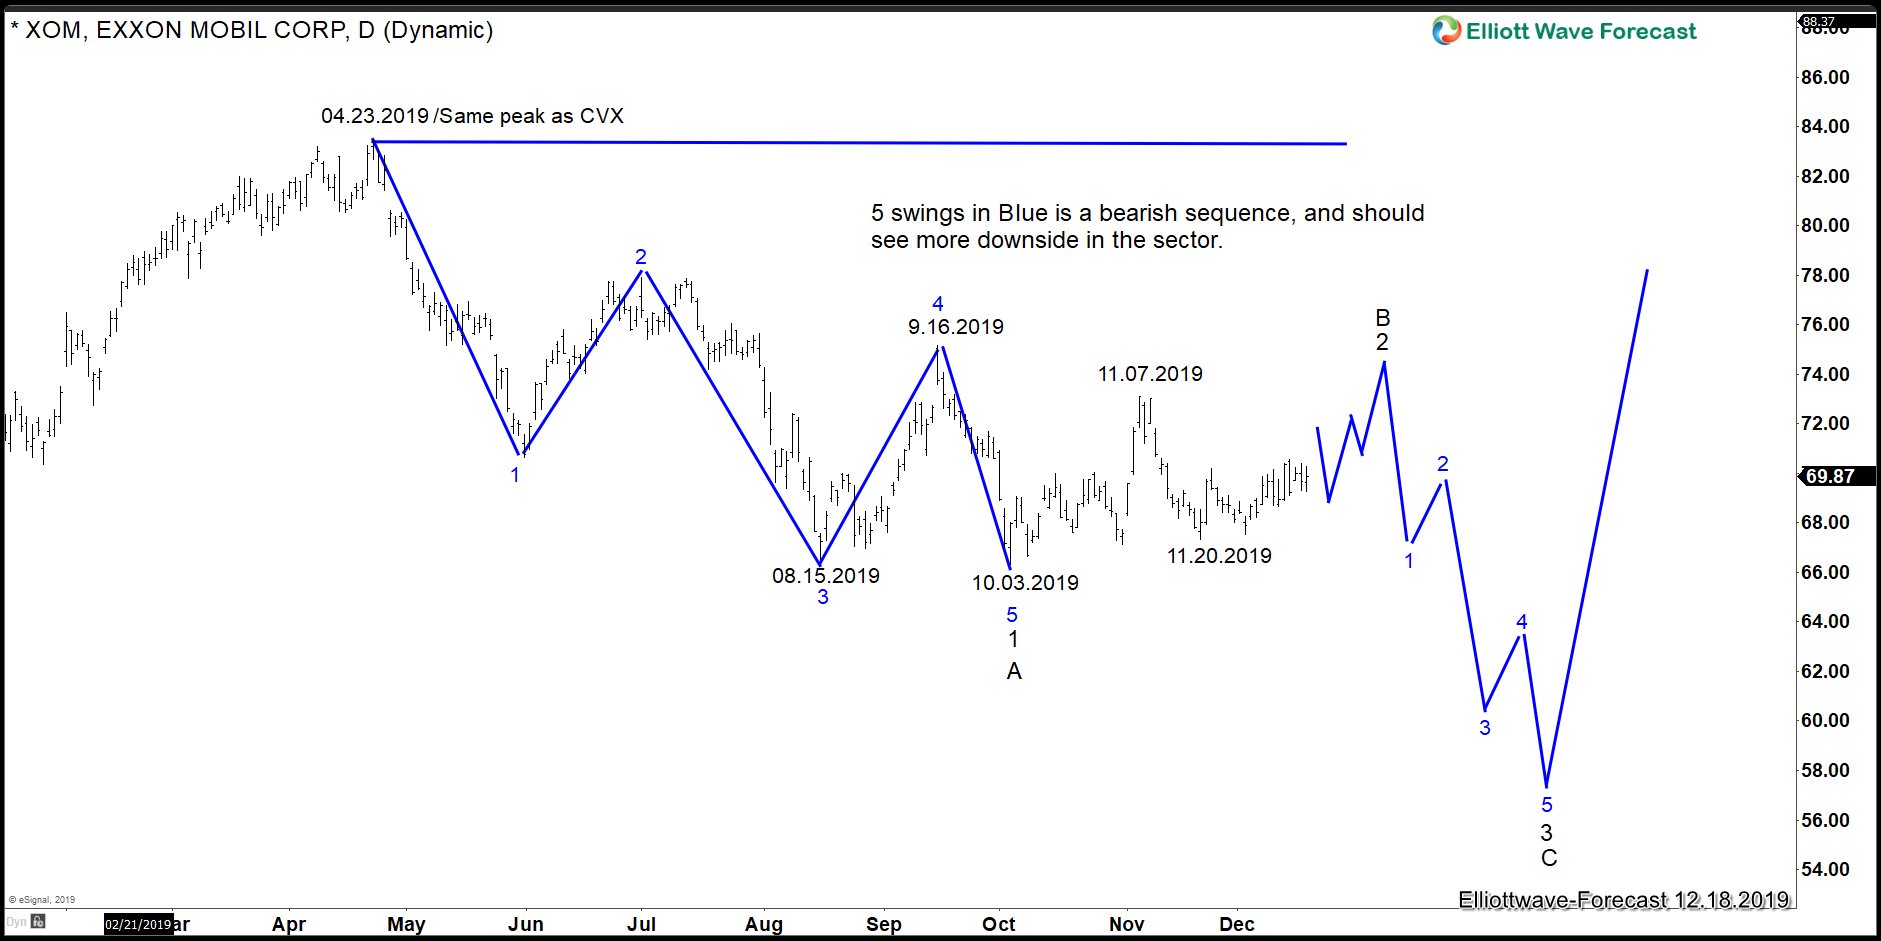
Chevron, like every world Indices, created a wave II low on 12.2018 and makes five waves from lows into a wave ((1)) peak at 04.08.2019. Since then, the stock has been trading sideways to lower. Looking at $XOM (Exxon Mobil) chart below, there are five swings from the peak on 04.23.2019, which is a bearish sequence. This calls for more sideways to downside action in Chevron. The following chart shows the bearish sequence since the peak on 04.23.2019.
Exxon Mobil (XOM) Shows Bearish Sequence from 4.23.2019 High
Many traders do not follow the correlation of the market. Exxon and Chevron belong to the same sector and consequently, most of the time follow the same side of the market. The following chart below shows both instrument on the same chart, which lead us to believe Chevron is not yet ready for a rally due to Exxon bearish sequence.
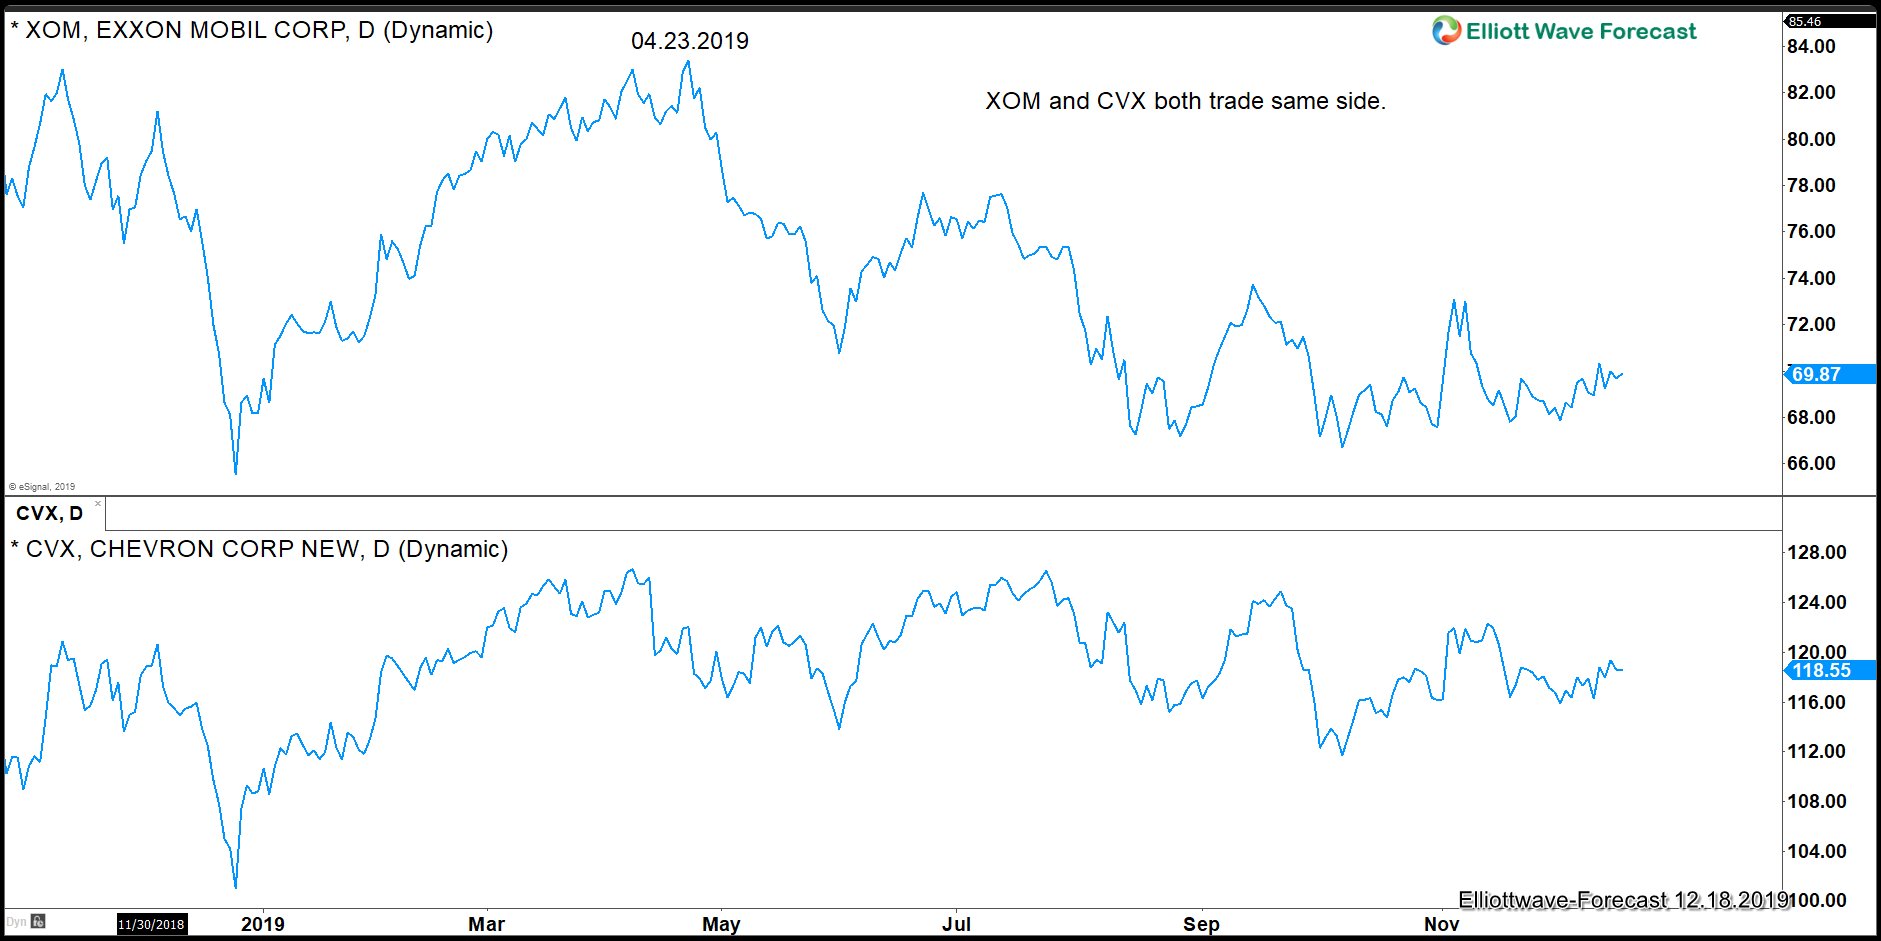
Exxon should see $74.00 and then drop into the $58.00 area, in which case Chevron can be testing the trend-line between 08.24.2015 and 12.2018 low. This will give an excellent opportunity to go long not only in the Chevron but also in instrument like $CHK, $CL#F, $GCC, among others. However, Chevron is showing the best Elliott wave structure.
In conclusion, we see an excellent chance for a swing trade on Chevron into the summer of 2020. We should see the $150.00-175.00 area around that time and it can give a buying opportunity at the trend-line test. Ideally, Exxon at the same time also reaches the 100% extension from 4.23.2019 high in ABC zigzag Elliott Wave structure.