Daily EURCAD Technical Analysis & Trading Signals (July 08)
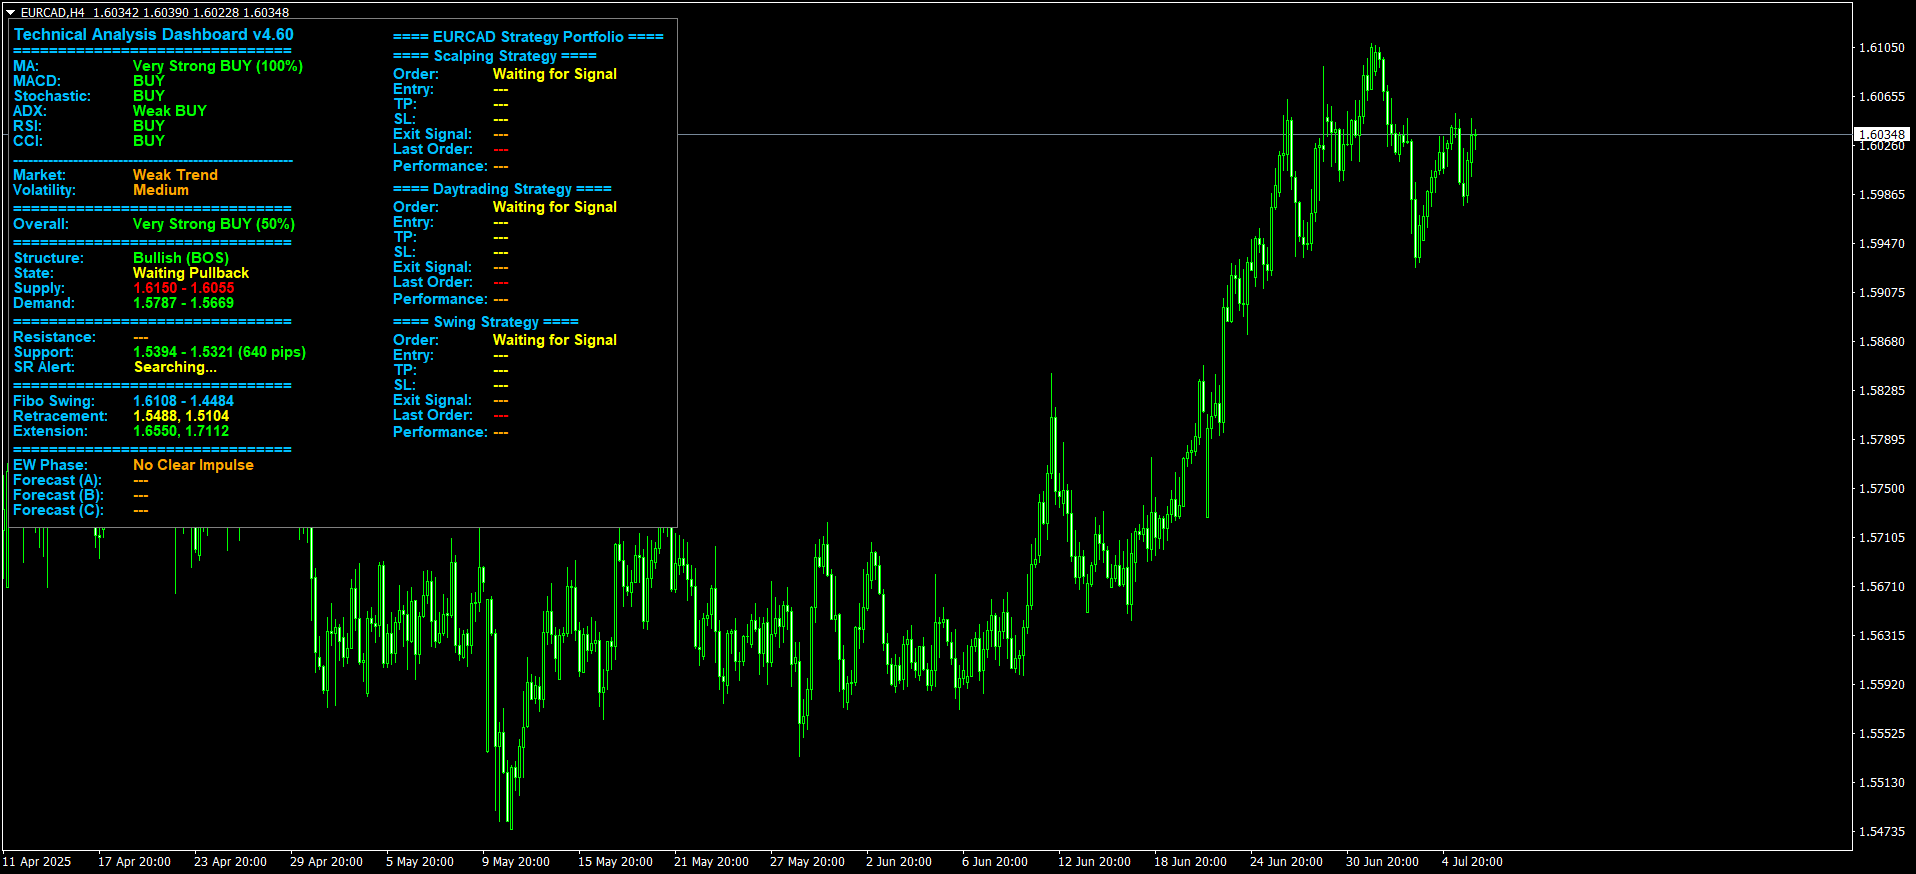
Analysis: The H4 dashboard indicates a Very Strong BUY (100%) signal from the Moving Averages. Other indicators like MACD, Stochastic, RSI, and CCI also show a BUY signal, while ADX suggests a Weak BUY .
The “Overall” analysis, considering M5, M30, and H1 timeframes, points to a Very Strong BUY (50%) , reinforcing the bullish sentiment across shorter timeframes.
Current market conditions are characterized by a Weak Trend , with Medium Volatility . This suggests that while there’s a bullish bias, the trend lacks significant momentum, and price movements are not excessively volatile.
From a Smart Money Concept (SMC) perspective, the Structure is Bullish (BOS - Break of Structure) , but the State is “Waiting Pullback.” This implies that while the underlying trend is upward, a retracement is anticipated before the next leg up. The nearest Supply zone is identified between 1.6150 - 1.6055 , and the Demand zone is 1.5787 - 1.5669 . The nearest Support zone is at 1.5394 - 1.5321 (641 pips) , with no immediate Resistance indicated. Given the Bullish Structure and the “Waiting Pullback” state, the price is likely to retrace towards the Demand zone (1.5787 - 1.5669) or the Support zone (1.5394 - 1.5321) before potentially resuming its upward movement. This pullback could present a BUY setup if the price finds strong support within these zones. Traders should monitor for signs of bullish reversal in these areas for potential long entries.
Disclaimer: This analysis is based solely on data from the provided dashboard and is intended for educational purposes only. Trading involves risk, and by following this analysis or its signals, you may incur financial losses. Please exercise caution and make your own informed trading decisions.
Technical Analysis Dashboard v4.48.zip (537.9 KB)