Daily Forex Trading Signals & Analysis (Technical Analysis Dashboard)

Currency pair: EURUSD
Date: June 29, 2025

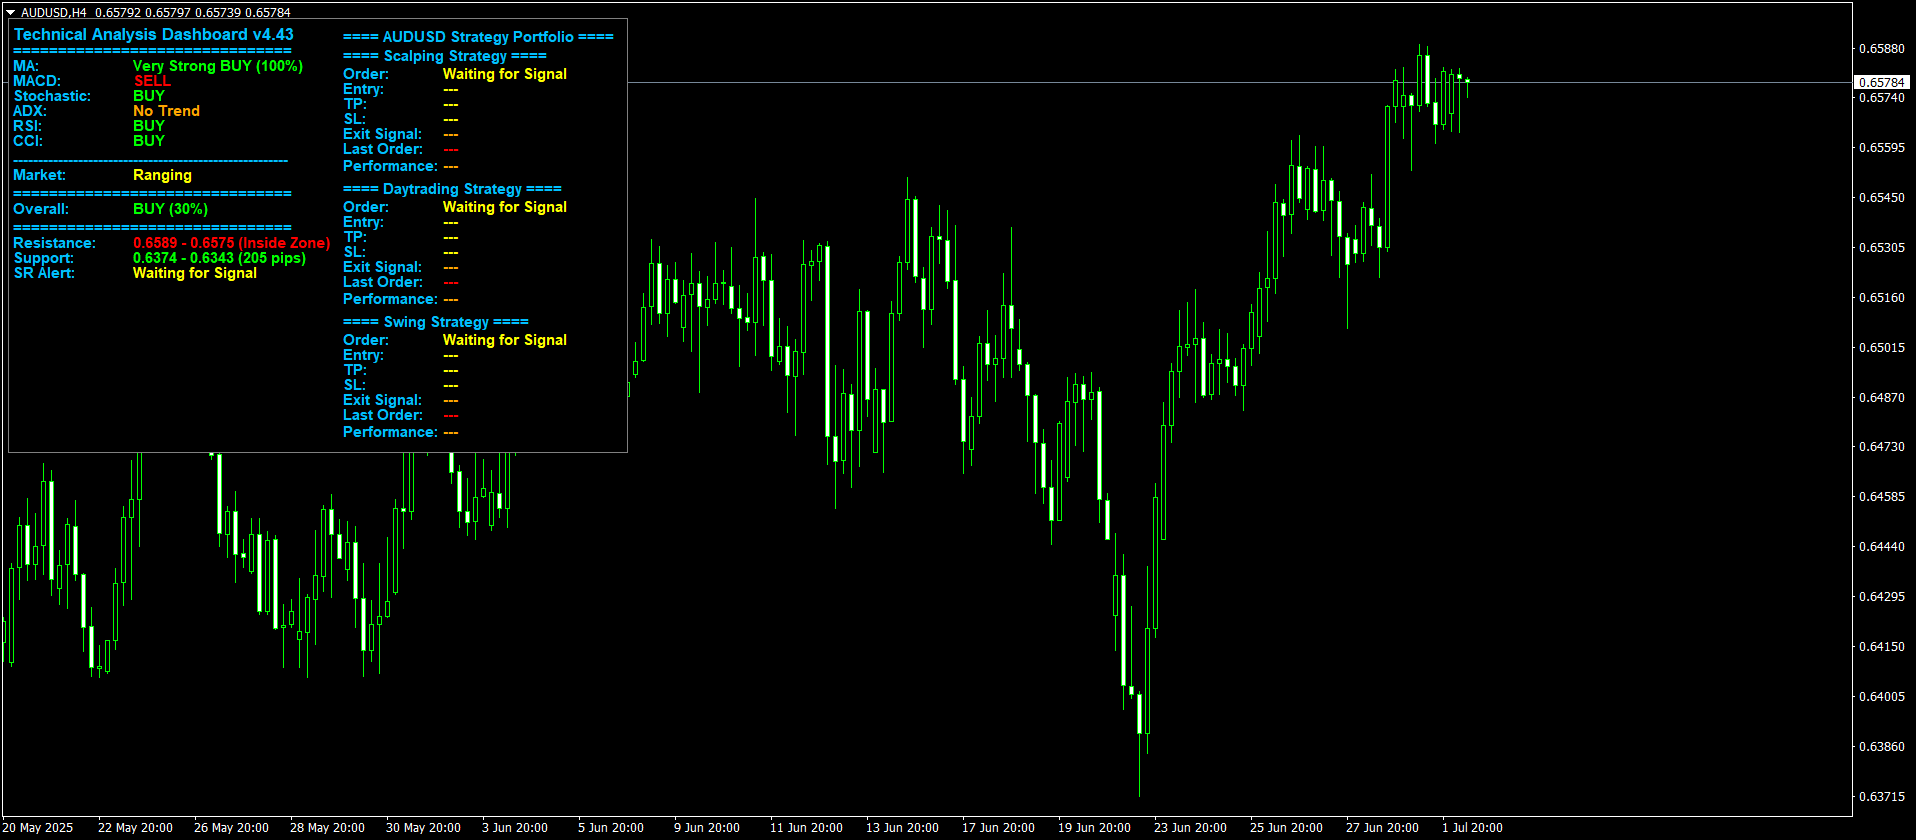
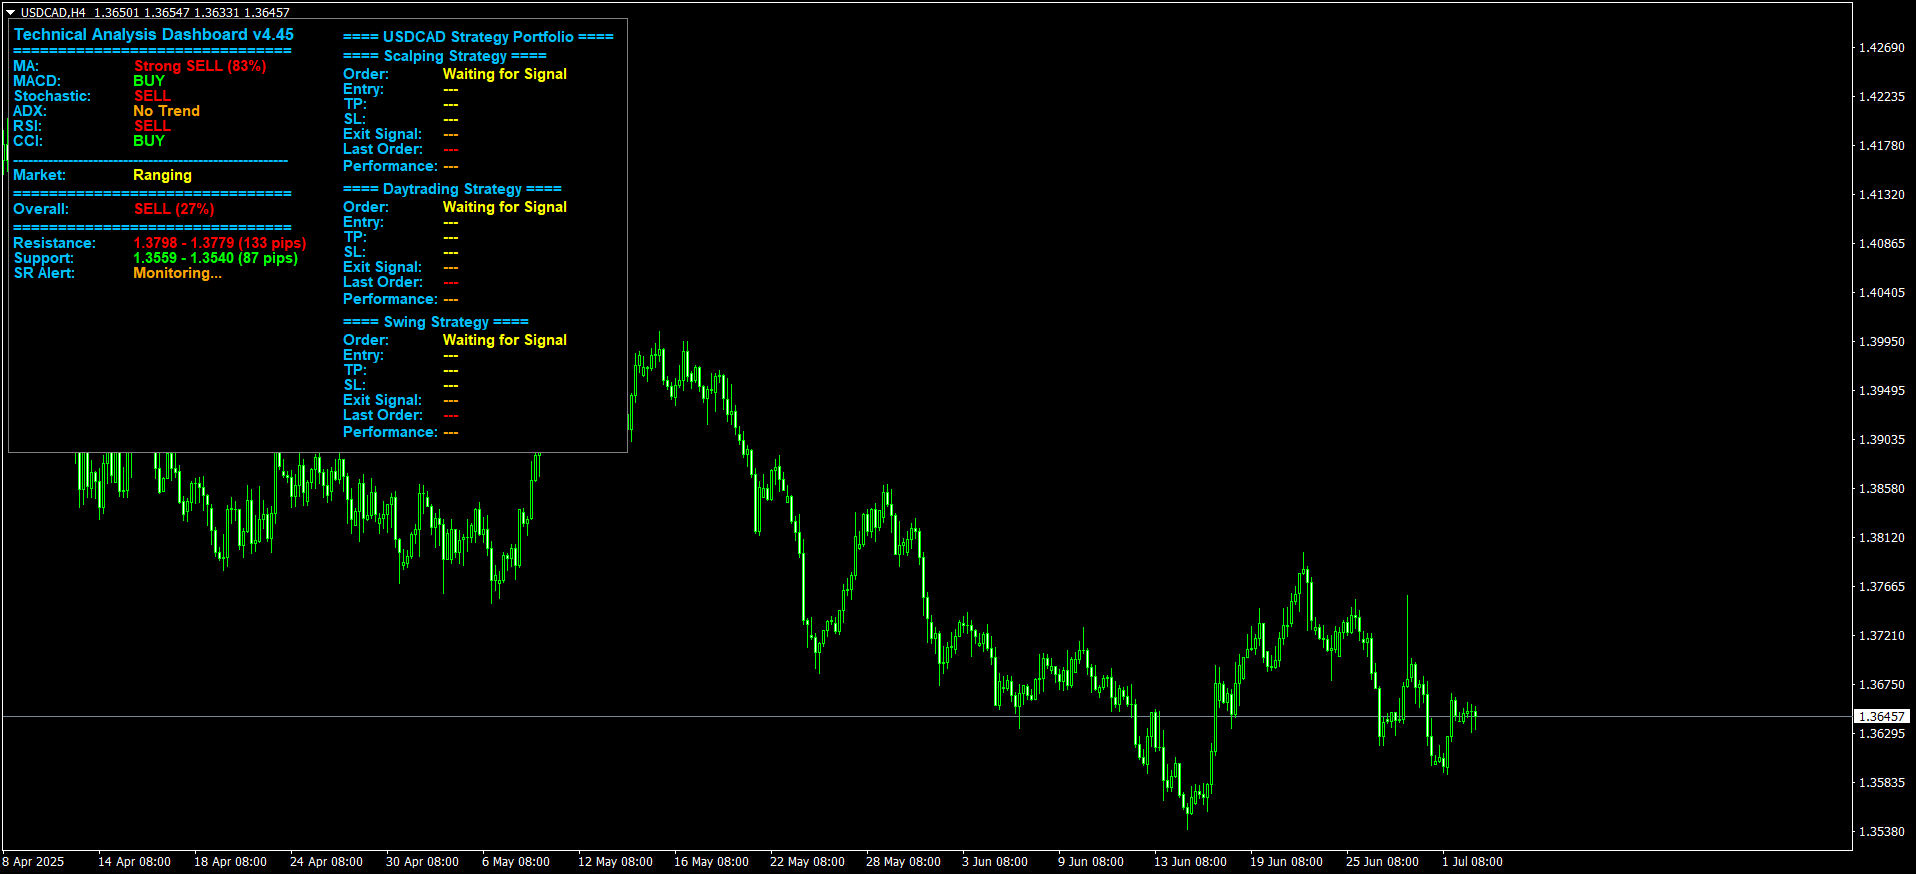
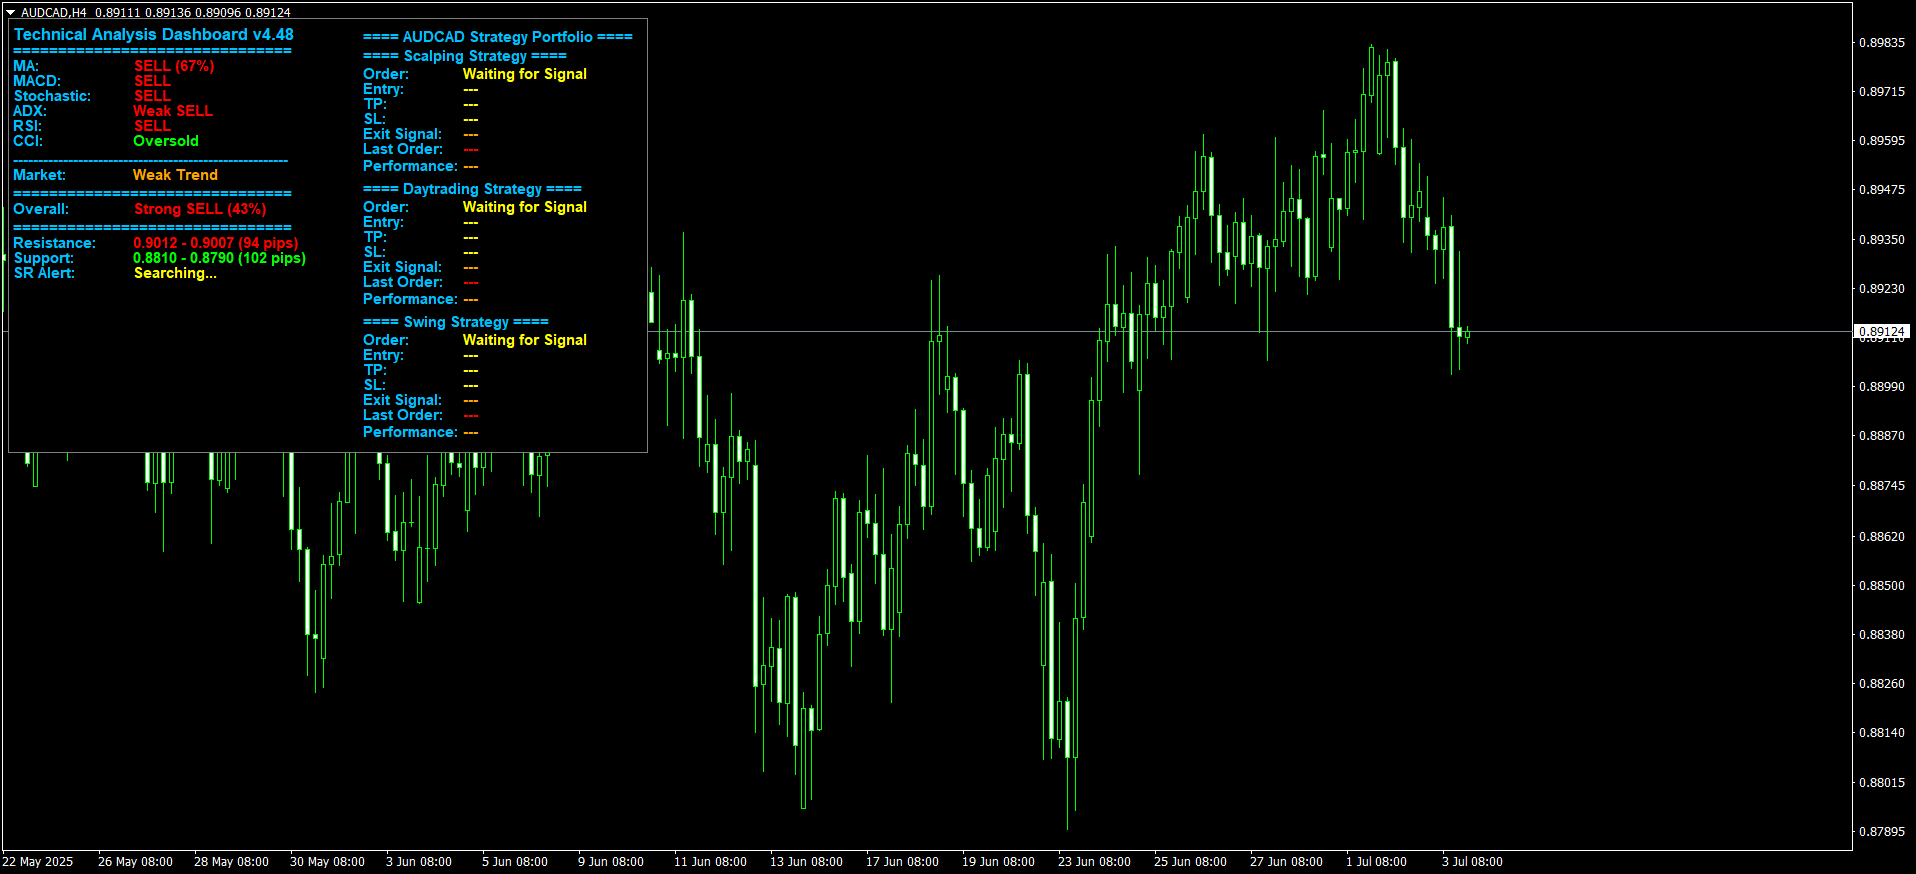
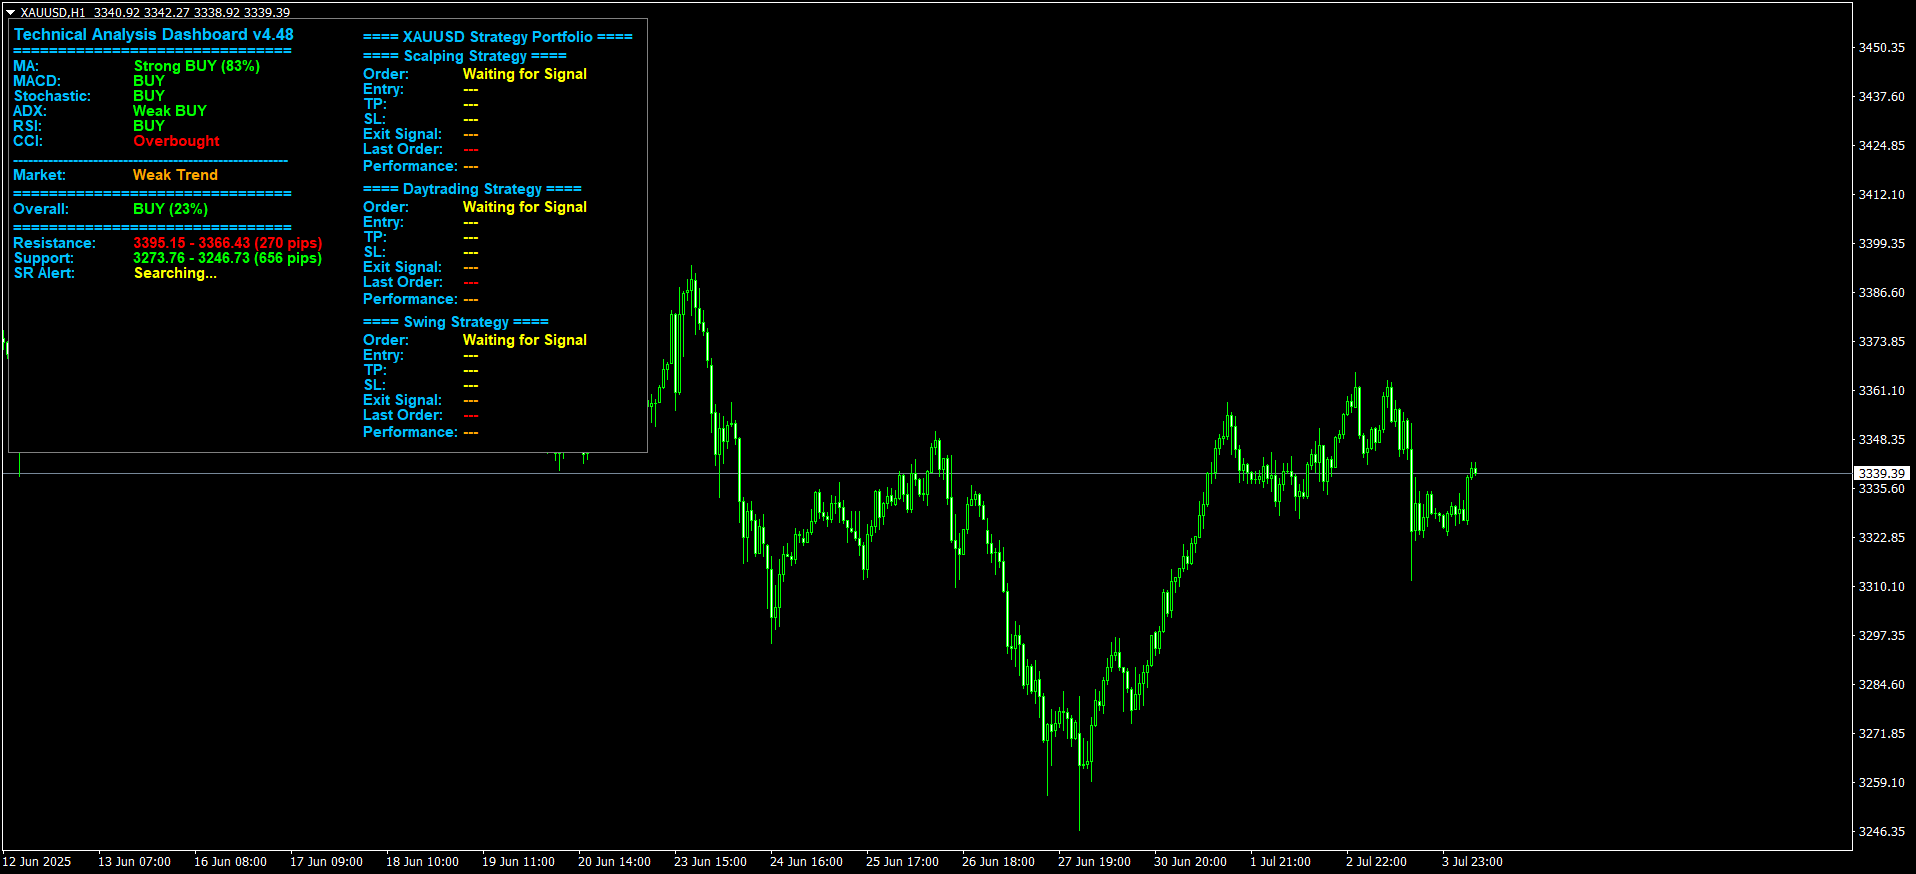
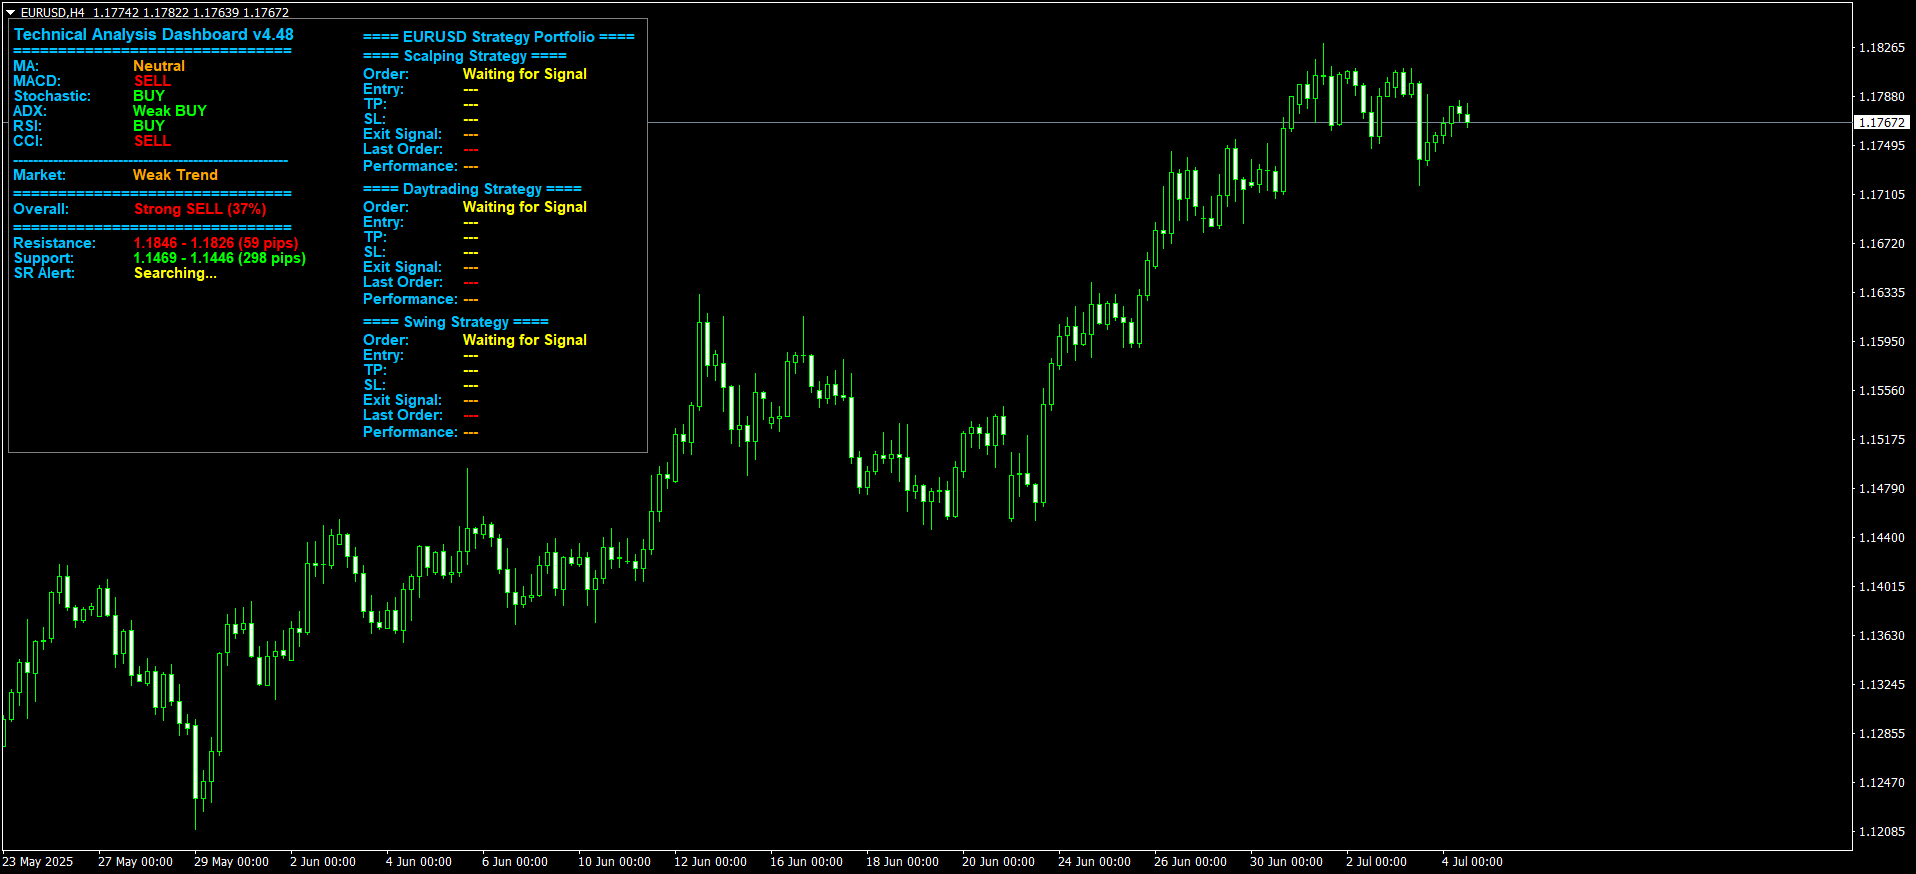
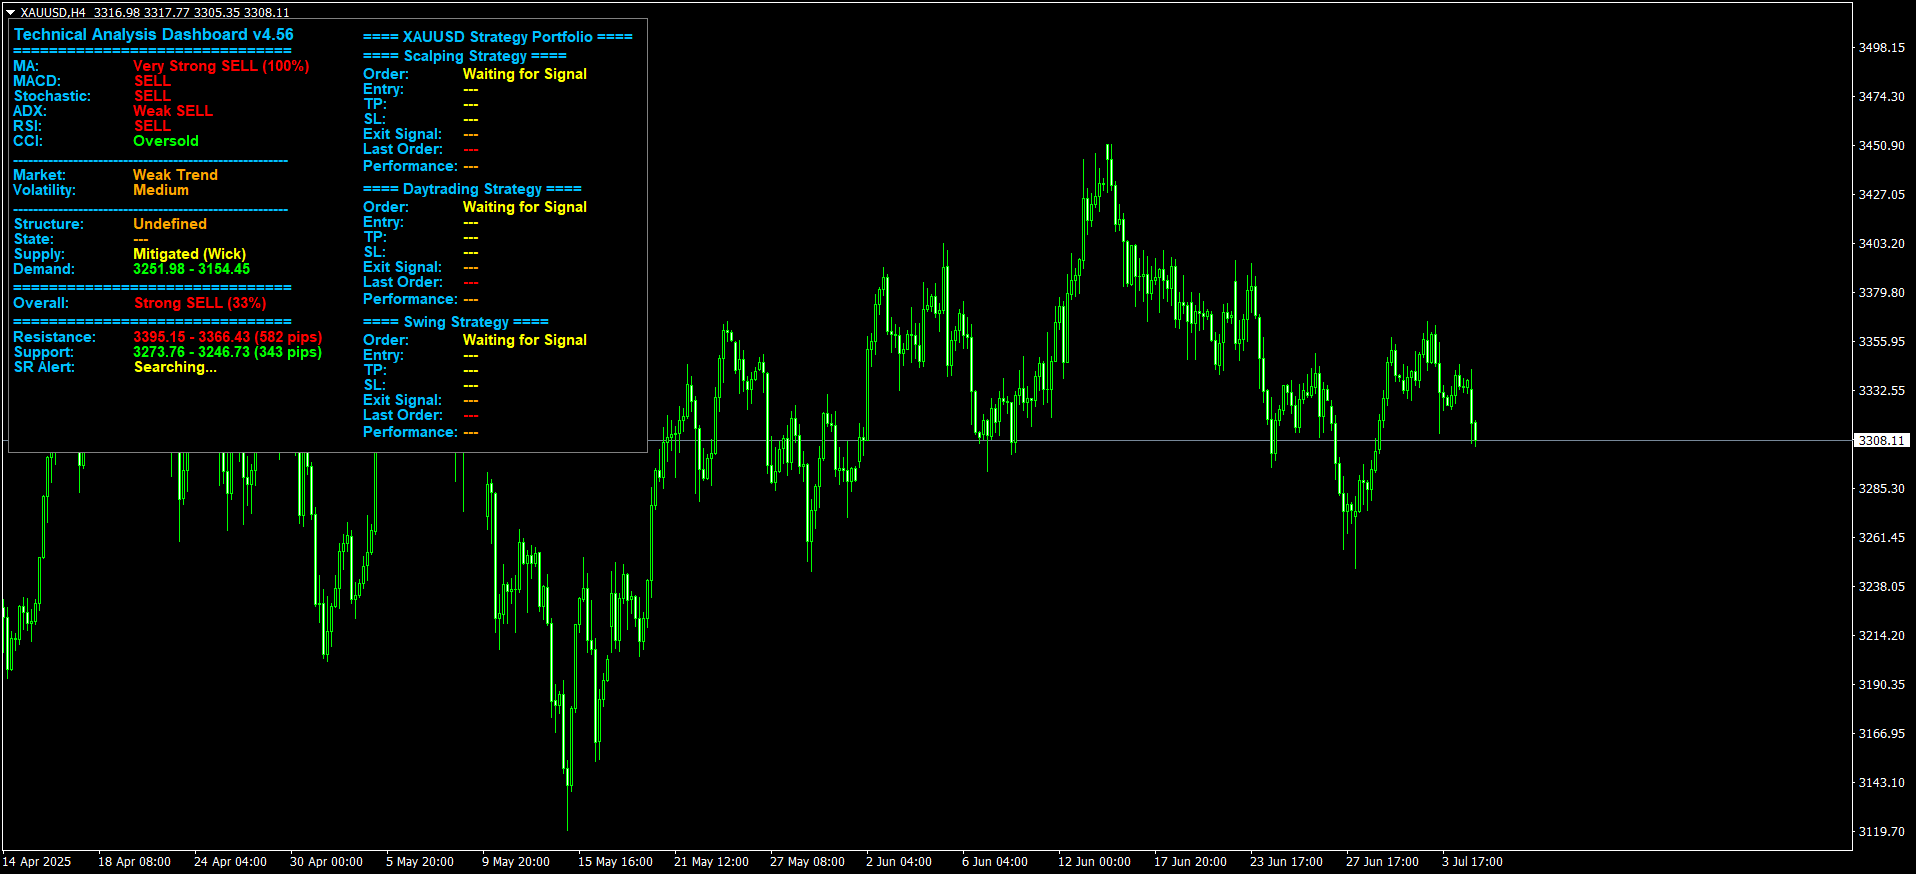
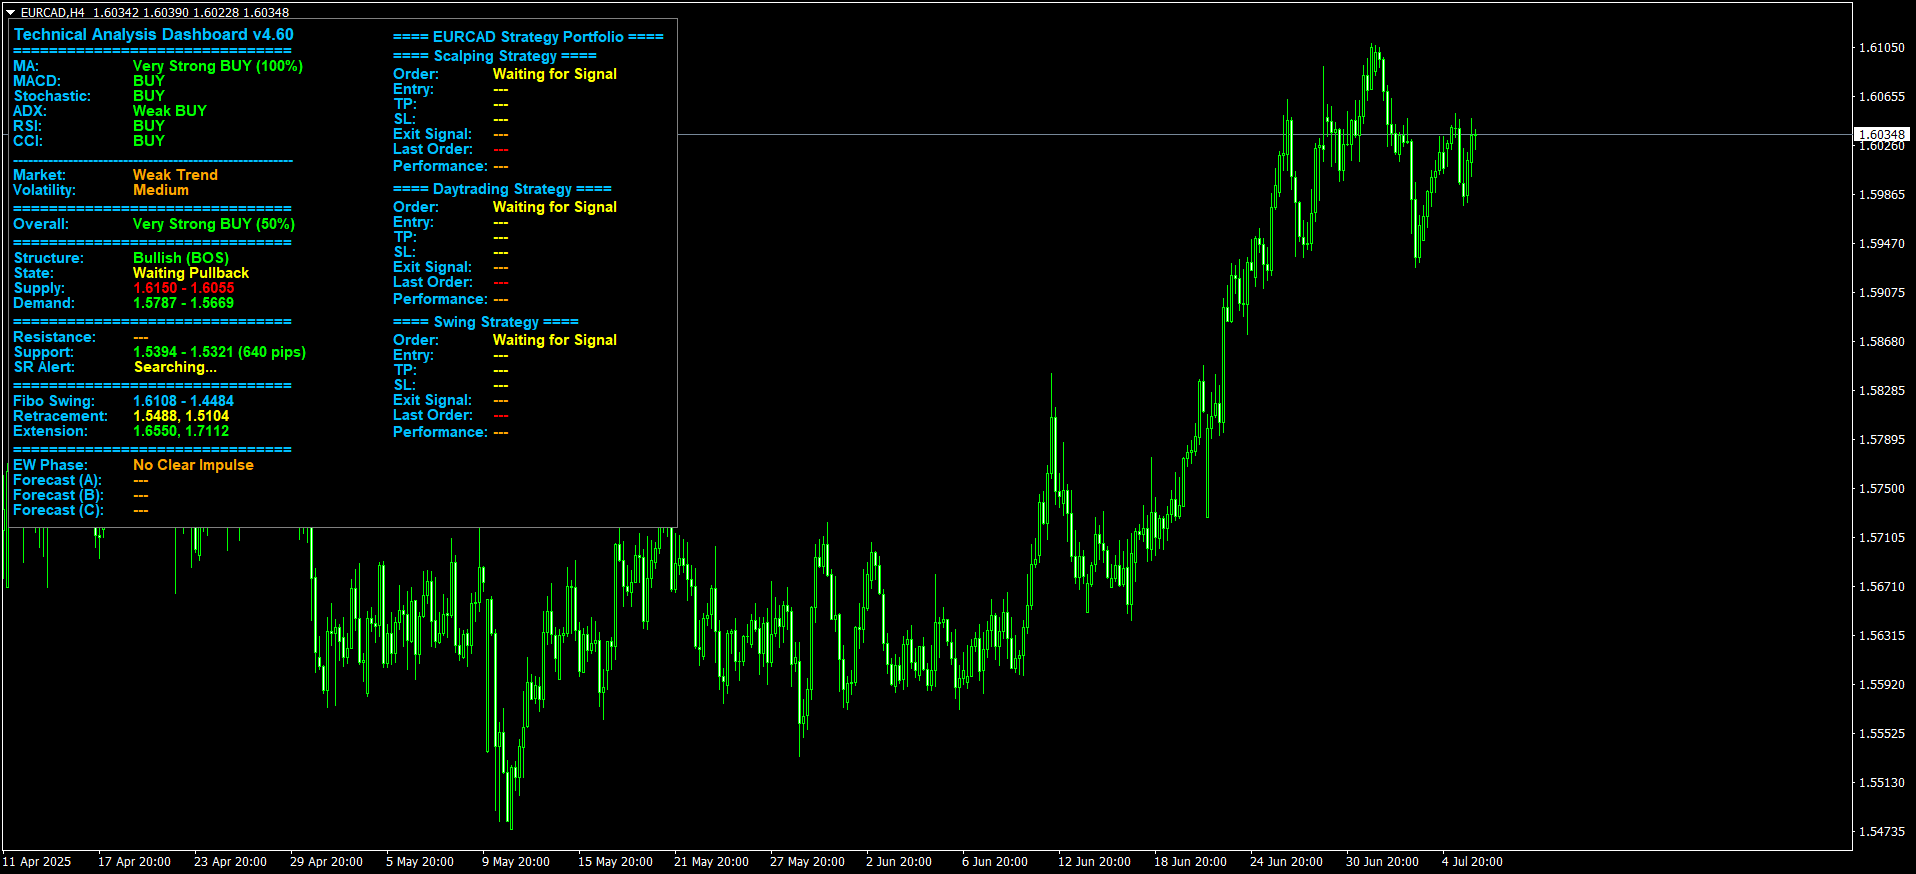
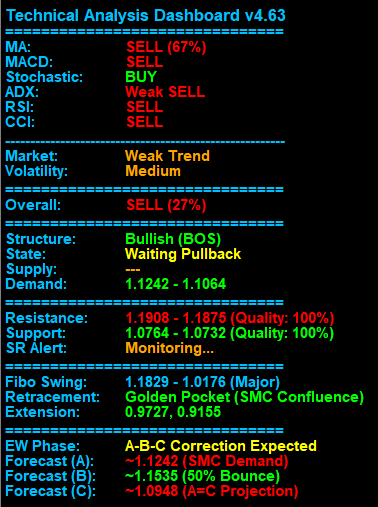
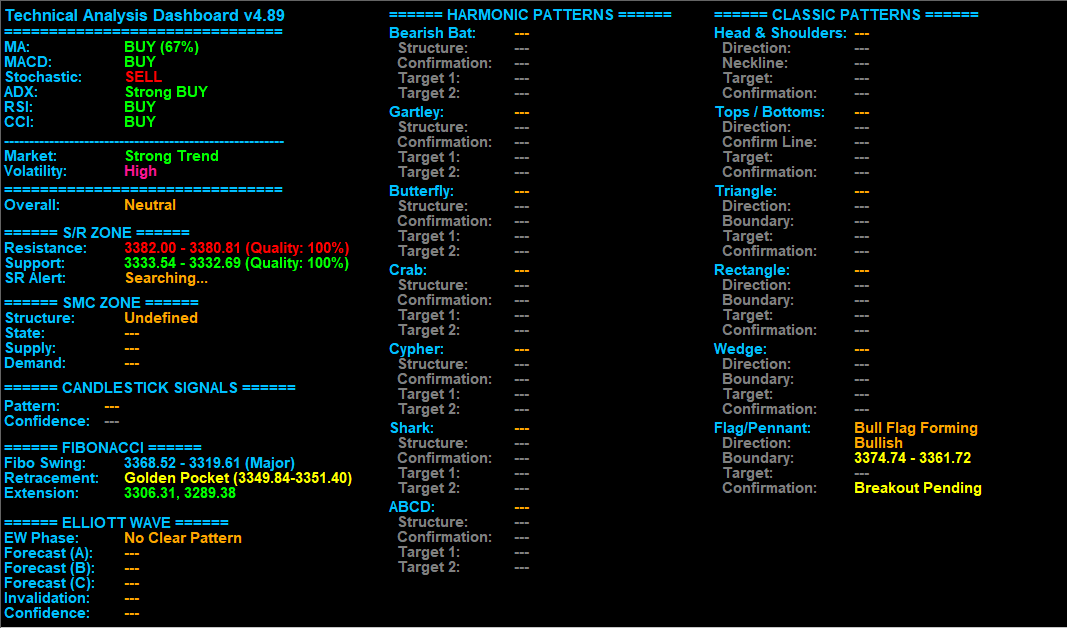
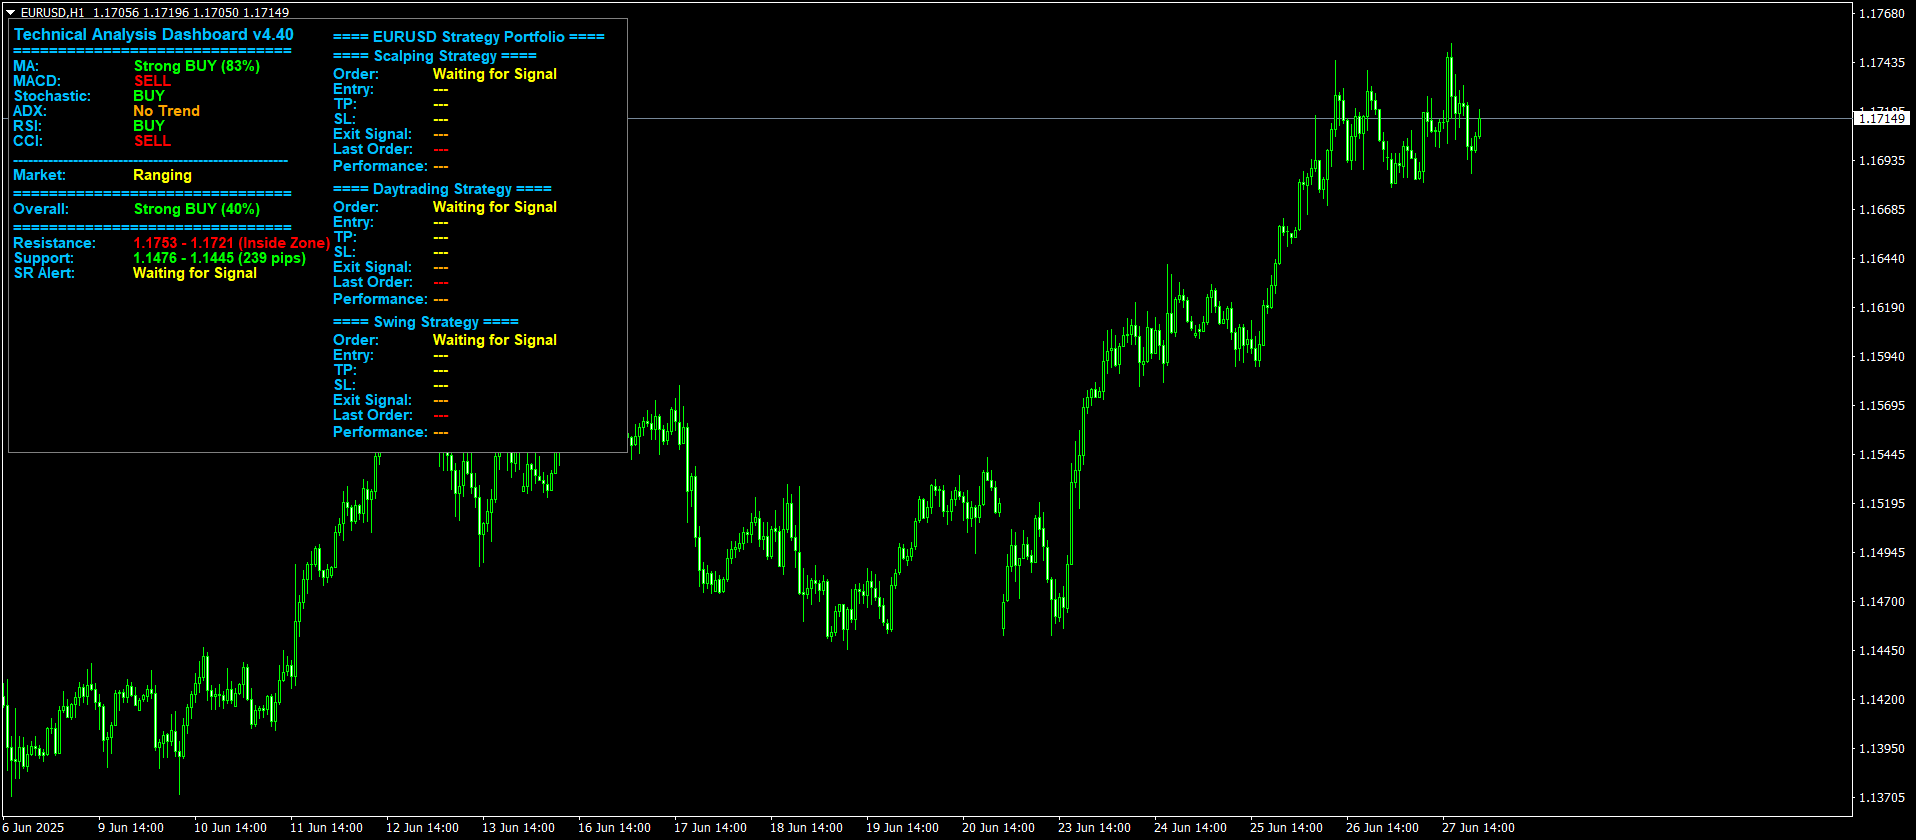
Analysis: The H1 Dashboard indicates a Strong BUY (83%) signal from the Moving Averages, with MACD showing a BUY, RSI indicating a BUY, and ADX suggesting No Trend. Conversely, Stochastic and CCI are both signaling SELL. This mixed sentiment suggests that while trend-following indicators lean bullish, momentum and oscillating indicators are bearish, requiring careful consideration.

The “Overall” analysis across M5, M30, and H1 timeframes points to a Strong BUY (40%). While still indicating a bullish bias, the 40% strength suggests that the buying pressure might not be overwhelmingly strong across all analyzed timeframes, aligning with the mixed signals from individual H1 indicators.

Currently, the market condition for EURUSD is Ranging. The nearest Resistance zone is identified between 1.1753 - 1.1721 (Inside Zone), and the Support zone is at 1.1476 - 1.1445 (239 pips). The SR Alert is “Waiting for Signal.”

Given the ranging market condition and the proximity of the price to the resistance inside zone, a breakout above 1.1753 would confirm a stronger bullish move, while a move towards the 1.1476 support zone would indicate a potential reversal or continued consolidation within the range. The wide support zone of 239 pips suggests a significant potential downside if the current resistance holds.

All trading strategies (Scalping, Daytrading, and Swing) are currently Waiting for Signal.

Disclaimer: This analysis is based solely on data from the provided dashboard and is intended for educational purposes only. Trading involves risk, and by following this analysis or its signals, you may incur financial losses. Please exercise caution and make your own informed trading decisions.

Technical Analysis Dashboard v4.35.zip (495.7 KB)

Currency pair: GBPUSD
Date: June 30, 2025

Analysis: On the current H1 timeframe, the dashboard indicates a Very Strong BUY (100%) signal from the Moving Averages. Both MACD and Stochastic indicators also suggest a BUY signal. However, ADX shows No Trend, while RSI indicates a BUY. The CCI is currently Overbought, suggesting potential for a pullback.

Overall, considering the M5, M30, and H1 timeframes across all six indicators, the dashboard presents an Overall BUY (27%) signal, which is not particularly strong.
The market condition is currently Ranging, indicating a lack of clear directional momentum.

The nearest Resistance zone is identified between 1.3770 - 1.3706 and is currently Inside Zone, implying the price is within this area. The nearest Support zone is at 1.3416 - 1.3369, a significant 316 pips away. The SR Alert shows “Waiting for Signal”, suggesting no immediate trading opportunity based on support/resistance breakouts or retests.

Disclaimer: This analysis is based solely on data from the provided dashboard and is intended for educational purposes only. Trading involves risk, and by following this analysis or its signals, you may incur financial losses. Please exercise caution and make your own informed trading decisions.

Daily USDCHF Technical Analysis & Trading Signals (June 30)

Analysis: The H4 dashboard indicates a Very Strong SELL signal from the Moving Averages (100%), supported by Strong SELL from ADX and a SELL signal from RSI and Stochastic. MACD, however, shows a BUY signal, while CCI is Oversold. This suggests a strong bearish bias with some potential for a short-term rebound.

Looking at the “Overall” analysis across M5, M30, and H1 timeframes, the average result is a Strong SELL (37%). This reinforces the bearish sentiment observed on the H4, indicating consistent selling pressure across shorter timeframes as well.

The market condition for USDCHF on the H4 timeframe is currently a Strong Trend, confirming the directional bias. The nearest Resistance zone is identified between 0.8215 - 0.8157 (197 pips), while the nearest Support zone is between 0.7857 - 0.7711 (101 pips). Based on the current strong bearish trend, the price is likely to test the Support zone. A break below this level could lead to further declines, while a rebound might see it retest the Resistance.

Disclaimer: This analysis is based solely on data from the provided dashboard and is intended for educational purposes only. Trading involves risk, and by following this analysis or its signals, you may incur financial losses. Please exercise caution and make your own informed trading decisions.

Technical Analysis Dashboard v4.35.zip (495.7 KB)

Daily USDJPY Technical Analysis & Trading Signals (July 01)

Analysis: Based on the H1 timeframe for USDJPY, the technical analysis dashboard shows a Strong SELL (83%) signal from the Moving Averages. MACD, RSI, and CCI also indicate SELL signals, while Stochastic suggests a BUY . ADX reinforces the bearish sentiment with a Strong SELL indication.

The “Overall” analysis, considering M5, M30, and H1 timeframes across the six indicators, currently stands at Neutral . This suggests a mixed picture when looking at the broader short-term to medium-term perspectives, despite the strong H1 sell signals from individual indicators.

The market condition is identified as a Strong Trend . The nearest Resistance zone is identified between 148.020 - 147.341 (353 pips), and the nearest Support zone is between 143.524 - 142.779 (26 pips).

Given the current Strong Trend and the prevalence of SELL signals from the indicators, the price is likely to test the Support zone. A break below this Support could lead to further downward movement. Conversely, a bounce from the Support might indicate a temporary retracement before potentially resuming the trend.

Disclaimer: This analysis is based solely on data from the provided dashboard and is intended for educational purposes only. Trading involves risk, and by following this analysis or its signals, you may incur financial losses. Please exercise caution and make your own informed trading decisions.

Daily Gold Technical Analysis & Trading Signals (July 01)

Analysis: The M30 Dashboard indicates a mixed sentiment from individual indicators. The Moving Averages (MA) show a BUY (67%) signal, while MACD and Stochastic are signaling SELL . Conversely, ADX, RSI, and CCI all point towards a BUY . This suggests a lack of strong consensus among the indicators on the current timeframe.

Looking at the “Overall” analysis, which averages results across M5, M30, and H1 timeframes using the six indicators, the market sentiment for Gold is Neutral . This implies that despite some individual indicator biases, the broader picture across these shorter timeframes does not show a clear directional bias, suggesting consolidation or indecision.

The market condition for Gold on the M30 timeframe is identified as a Strong Trend . The nearest Resistance zone is identified between 3396.68 - 3351.83 (48 pips) , while the nearest Support zone is significantly lower at 3294.44 - 3245.32 (522 pips) . The SR Alert is currently “Waiting for Signal,” indicating no immediate breakout or breakdown signal. Given the Strong Trend market condition, the wide gap between the current price and the support zone, combined with the relatively tight resistance, suggests that the price might be approaching a significant resistance level within a strong upward momentum, or it could be consolidating before a further move. Traders should monitor for a clear break of resistance to confirm continued upward movement or a reversal if resistance holds.

Disclaimer: This analysis is based solely on data from the provided dashboard and is intended for educational purposes only. Trading involves risk, and by following this analysis or its signals, you may incur financial losses. Please exercise caution and make your own informed trading decisions.

Technical Analysis Dashboard v4.35.zip (495.7 KB)

Daily AUDUSD Technical Analysis & Trading Signals (July 02)

Analysis: The dashboard indicates a mixed but predominantly bullish outlook on the H4 timeframe. The Moving Averages show a Very Strong BUY (100%) signal, supported by BUY signals from Stochastic, RSI, and CCI. However, MACD is signaling SELL , and ADX indicates No Trend , suggesting a lack of strong directional momentum at present.

Looking at the “Overall” analysis across M5, M30, and H1 timeframes, the sentiment is a BUY (30%) . This low percentage suggests that while there’s a bullish bias, it’s not a strong conviction across the shorter timeframes, implying potential for volatility or a lack of clear upward momentum.

The current market condition is identified as Ranging . The price is currently within the Resistance zone of 0.6589 - 0.6575 . The nearest Support zone is significantly lower at 0.6374 - 0.6343 , approximately 205 pips away. The “SR Alert” is currently “Waiting for Signal,” indicating no immediate trading opportunities based on support and resistance breakouts or bounces. Given the ranging market and the price being inside the resistance zone, a potential pullback or continued consolidation within this range is likely until a clear breakout occurs.

Disclaimer: This analysis is based solely on data from the provided dashboard and is intended for educational purposes only. Trading involves risk, and by following this analysis or its signals, you may incur financial losses. Please exercise caution and make your own informed trading decisions.

Daily USDCAD Technical Analysis & Trading Signals (July 02)

Analysis: The current H4 timeframe analysis for USDCAD indicates a mixed sentiment across indicators. The MA (moving averages) show a STRONG SELL signal with 83% consensus. However, MACD is signaling BUY , while Stochastic and CCI are also indicating BUY . ADX suggests No Trend , and RSI is signaling SELL .

Looking at the overall sentiment across M5, M30, and H1 timeframes, the aggregated analysis shows a SELL (27%) signal, suggesting a prevailing bearish bias across shorter timeframes as well.

The market conditions are currently identified as Ranging . The nearest Resistance zone is identified between 1.3738 - 1.3770 (319 pips) , and the nearest Support zone is between 1.3609 - 1.3580 (29 pips) . Given the current ranging market and the proximity of price to the Support zone at 1.3609 - 1.3580, traders should observe for potential bounces or breakdowns from this level.

Disclaimer: This analysis is based solely on data from the provided dashboard and is intended for educational purposes only. Trading involves risk, and by following this analysis or its signals, you may incur financial losses. Please exercise caution and make your own informed trading decisions.

Technical Analysis Dashboard v4.35.zip (495.7 KB)

Daily NZDUSD Technical Analysis & Trading Signals (July 03)

Analysis: The H4 dashboard indicates a predominantly SELL signal across several key indicators. The Moving Averages (MA) are Neutral , suggesting a lack of strong directional bias from this perspective. However, the MACD, Stochastic, and RSI all show a SELL signal, while the CCI indicates an Oversold condition, which could hint at a potential reversal or continued downward pressure. The ADX suggests No Trend is currently established on this timeframe.

Looking at the “Overall” analysis, which averages results from the M5, M30, and H1 timeframes, the sentiment is a Strong SELL (40%) . This reinforces the bearish bias seen on the H4, indicating a consistent downward momentum across shorter timeframes as well.

The market condition is currently Ranging . The nearest Resistance zone is identified between 0.6379 and 0.6348 (281 pips), while the nearest Support zone is between 0.5912 and 0.5883 (155 pips). Given the current Ranging market and the Strong SELL overall sentiment, the price is likely to continue consolidating within this range, with a higher probability of testing the Support zone. The Oversold CCI on H4 might suggest a bounce from support, but the overall bearish momentum should be closely monitored.

Disclaimer: This analysis is based solely on data from the provided dashboard and is intended for educational purposes only. Trading involves risk, and by following this analysis or its signals, you may incur financial losses. Please exercise caution and make your own informed trading decisions.

Daily AUDCAD Technical Analysis & Trading Signals (July 03)

Analysis: The H4 dashboard indicates a strong SELL signal across most indicators. The Moving Averages (MA) show a SELL (67%) , reinforced by SELL signals from MACD, Stochastic, and RSI. ADX suggests a Weak SELL , while CCI indicates Oversold conditions, which could imply a potential rebound or a continuation of the downtrend after a period of exhaustion.

Overall, the combined analysis across M5, M30, and H1 timeframes points to a Strong SELL (43%) . This suggests a consistent bearish sentiment across shorter to medium timeframes, aligning with the H4 outlook. The market is currently in a Weak Trend , indicating that while the bearish bias is present, it lacks significant momentum for a strong directional move.

The nearest Resistance zone is identified between 0.9012 - 0.9007 (94 pips) , and the nearest Support zone is 0.8810 - 0.8790 (102 pips) . Given the current Weak Trend and overall Strong SELL bias, the price is likely to test the Support zone. A break below this support could lead to further declines, while a bounce could see it retest the Resistance zone within the Weak Trend context. The SR Alert is currently “Searching…”, indicating no immediate breakout or breakdown confirmation.

Disclaimer: This analysis is based solely on data from the provided dashboard and is intended for educational purposes only. Trading involves risk, and by following this analysis or its signals, you may incur financial losses. Please exercise caution and make your own informed trading decisions.

Technical Analysis Dashboard v4.48.zip (537.9 KB)

Daily Gold Technical Analysis & Trading Signals (July 04)

Analysis: The H1 timeframe dashboard indicates a predominantly BUY signal across most indicators. The Moving Averages (MA) show a Strong BUY (83%) , while MACD, Stochastic, and RSI all confirm a BUY sentiment. ADX suggests a Weak BUY , indicating some bullish momentum but not exceptionally strong. Conversely, the CCI is Overbought , hinting at potential short-term exhaustion of the upward movement.

The “Overall” analysis, consolidating M5, M30, and H1 timeframes, presents a collective BUY (23%) signal. This suggests that while the current H1 is bullish, the shorter timeframes might be less aggressive or mixed, leading to a moderated overall buying pressure.

Current market conditions reveal a Weak Trend . This implies that while there’s a general upward bias, the momentum is not robust, and the market might be prone to fluctuations or ranging behavior. The nearest Resistance zone is identified between 3395.15 - 3366.43 (268 pips) , and the nearest Support zone is 3273.76 - 3246.73 (658 pips) . The SR Alert is currently “Searching…”, indicating no immediate support or resistance zone breaches. Given the Weak Trend and the Overbought CCI, the price might struggle to break the immediate resistance, potentially consolidating or pulling back towards the support zone before a sustained move.

Disclaimer: This analysis is based solely on data from the provided dashboard and is intended for educational purposes only. Trading involves risk, and by following this analysis or its signals, you may incur financial losses. Please exercise caution and make your own informed trading decisions.

Daily EURUSD Technical Analysis & Trading Signals (July 04)

Analysis: On the H4 timeframe, the dashboard indicates a mixed signal from individual indicators. The Moving Averages (MA) are Neutral , while MACD and CCI are signaling SELL . Conversely, Stochastic and RSI show BUY signals. ADX suggests a Weak BUY , indicating limited bullish momentum from this indicator.

The “Overall” analysis, which averages results across M5, M30, and H1 timeframes, points to a Strong SELL with a 43% conviction. This suggests a prevailing bearish sentiment across shorter timeframes, despite the mixed signals on the current H4 chart.

The market condition is identified as a Weak Trend , implying that while there is a directional bias (towards selling overall), the trend lacks significant strength. The nearest Resistance zone is identified between 1.1846 and 1.1826 (59 pips away), while the nearest Support zone is significantly lower, between 1.1469 and 1.1446 (298 pips away). Given the Weak Trend and Strong SELL overall, the price is likely to test the nearest Support zone if bearish momentum increases, or it may consolidate around current levels due to the weak trend. The wide gap between current price and the Support suggests potential for further downside if the Strong SELL conviction holds.

Disclaimer: This analysis is based solely on data from the provided dashboard and is intended for educational purposes only. Trading involves risk, and by following this analysis or its signals, you may incur financial losses. Please exercise caution and make your own informed trading decisions.

Technical Analysis Dashboard v4.48.zip (537.9 KB)

Daily GBPUSD Technical Analysis & Trading Signals (July 05)

Analysis: On the H1 timeframe, the dashboard indicates a Very Strong SELL signal (100%) from the Moving Averages, supported by SELL signals from MACD, Stochastic, RSI, and CCI. ADX, however, shows No Trend , suggesting a lack of strong directional momentum despite the bearish indicator alignment.

The “Overall” analysis, considering M5, M30, and H1 timeframes across the six indicators, presents a SELL (30%) bias. This suggests that while the current H1 indicators are strongly bearish, the shorter timeframes might be offering mixed or less convincing bearish signals, diluting the overall strength.

Currently, the market condition is identified as Ranging , with Low volatility. This aligns with the ADX’s “No Trend” reading and implies that price action is contained within a defined range, making strong directional moves less probable in the immediate term.

The nearest Resistance zone is identified between 1.3789 - 1.3743 (87 pips away), while the nearest Support zone is 1.3409 - 1.3371 (228 pips away). Given the Ranging market and Low volatility, the price is likely to oscillate between these zones. The current strong SELL signals from individual indicators, combined with the overall SELL bias, suggest a potential move towards the Support zone, but the Ranging condition might lead to consolidation before a clear breakout. The probable directional bias is bearish towards the support, but caution is advised due to the ranging market.

Disclaimer: This analysis is based solely on data from the provided dashboard and is intended for educational purposes only. Trading involves risk, and by following this analysis or its signals, you may incur financial losses. Please exercise caution and make your own informed trading decisions.

Daily USDCHF Technical Analysis & Trading Signals (July 05)

Analysis: On the H4 timeframe, the dashboard presents a mixed signal from individual indicators. The Moving Averages show a Very Strong SELL (100%) , indicating a significant bearish alignment across various periods. However, MACD, Stochastic, and CCI are signaling BUY , while RSI indicates SELL , and ADX suggests a Medium SELL . This divergence among indicators suggests a lack of strong, unified directional momentum from a purely indicator-based perspective on the current timeframe.

The “Overall” analysis, which averages results across M5, M30, and H1 timeframes using the six indicators, points to a SELL (30%) . This low percentage suggests that while there’s a slight bearish bias across shorter timeframes, it’s not a conviction SELL signal, implying indecision or a lack of strong directional consensus when considering multiple timeframes.

Current market conditions indicate a Medium Trend , suggesting that while there is a discernible direction, it’s not exceptionally robust. Volatility is assessed as Medium , implying moderate price swings that are neither excessively wide nor unusually tight.

The nearest Resistance zone is identified between 0.8195 - 0.8183 (231 pips) , while the nearest Support zone is 0.7826 - 0.7711 (104 pips) . Given the mixed signals from indicators and the “Overall” SELL (30%) bias, the price is likely consolidating or experiencing a pullback within a broader trend. The current proximity to the Support zone, combined with some BUY signals from individual indicators, suggests that the Support level may be tested, and a bounce or temporary consolidation could occur before a clear direction is established. The probable directional bias leans slightly bearish due to the strong MA SELL and overall SELL signal, but caution is advised due to conflicting indicator signals and the Medium Trend and Volatility .

Disclaimer: This analysis is based solely on data from the provided dashboard and is intended for educational purposes only. Trading involves risk, and by following this analysis or its signals, you may incur financial losses. Please exercise caution and make your own informed trading decisions.

Technical Analysis Dashboard v4.48.zip (537.9 KB)

Daily USDJPY Technical Analysis & Trading Signals (July 06)

Analysis: On the H4 timeframe, the dashboard indicates a mixed but generally BUY bias from individual indicators. While the Moving Averages (MA) show a Neutral stance and ADX suggests No Trend , MACD, Stochastic, RSI, and CCI are all signaling BUY . This suggests underlying bullish momentum despite the lack of a clear trend from trend-following indicators.

The “Overall” analysis, incorporating M5, M30, and H1 timeframes, presents a SELL (27%) signal. This contrasts with the H4 individual indicator readings, implying that shorter timeframes might be experiencing downward pressure or a retracement, pulling the overall sentiment to a bearish lean.

The current market condition is identified as Ranging , with Medium Volatility . This confirms the H4 ADX reading of “No Trend” and suggests that the price is consolidating within a defined range rather than exhibiting a strong directional move. Given the ranging market and medium volatility, the price is likely to oscillate between the identified support and resistance zones. The nearest Resistance zone is identified between 148.0280 - 147.5070 (292 pips) , while the nearest Support zone is 142.7020 - 142.3810 (168 pips) . The market is currently searching for an SR Alert, indicating it’s within these boundaries. The probable directional bias is neutral to slightly bullish on the H4, but with a short-term bearish pull from lower timeframes, suggesting a range-bound strategy is appropriate.

Disclaimer: This analysis is based solely on data from the provided dashboard and is intended for educational purposes only. Trading involves risk, and by following this analysis or its signals, you may incur financial losses. Please exercise caution and make your own informed trading decisions.

Daily AUDUSD Technical Analysis & Trading Signals (July 06)

Analysis: The dashboard indicates a strong SELL bias across most indicators on the H4 timeframe. Moving Averages (MA), MACD, Stochastic, and RSI all signal SELL , with MA showing a 67% sell strength. ADX suggests a Weak SELL , while CCI is Oversold , hinting at a potential reversal or exhaustion of the selling pressure.

Overall, the combined analysis across M5, M30, and H1 timeframes points to a Strong SELL (40%) . This reinforces the bearish sentiment observed on the H4 chart, suggesting a consistent downward momentum across shorter to medium timeframes.

The market is currently in a Weak Trend with Medium Volatility . The Smart Money Concept (SMC) structure shows a Bullish (BOS) , indicating a break of structure to the upside, and the price is currently Waiting for Pullback . This suggests that despite the short-term bearish indicators, the underlying structure is bullish, and a pullback is anticipated before a potential continuation of the bullish move.

The nearest Resistance zone is identified between 0.6688 - 0.6664 , and the nearest Support zone is 0.6401 - 0.6373 . Given the Bullish (BOS) and the “Waiting for Pullback” state, the current market situation suggests that the price might retrace towards the Demand zone of 0.6495 - 0.6447 (Buy Entry Zone) before potentially resuming its bullish trajectory. The probable directional bias, considering the SMC structure, leans towards a BUY after a pullback, despite the current strong sell signals from traditional indicators.

Disclaimer: This analysis is based solely on data from the provided dashboard and is intended for educational purposes only. Trading involves risk, and by following this analysis or its signals, you may incur financial losses. Please exercise caution and make your own informed trading decisions.

Technical Analysis Dashboard v4.48.zip (537.9 KB)

Daily Gold Technical Analysis & Trading Signals (July 07)

Analysis: The H4 Dashboard indicates a Very Strong SELL signal (100%) from Moving Averages, complemented by SELL signals from MACD, Stochastic, and RSI. ADX shows a Weak SELL , while CCI is Oversold , suggesting potential for a bounce or exhaustion of the selling pressure.

The “Overall” analysis, averaging M5, M30, and H1 timeframes across six indicators, also points to a SELL signal, albeit with a lower conviction of 20%. This suggests that while the higher timeframe (H4) is strongly bearish, shorter timeframes might be showing mixed or less aggressive selling.

Current market conditions are categorized as a Weak Trend , with Medium Volatility . This implies that while there’s a bearish bias, the trend lacks significant momentum, and price movements are moderately active.

The Smart Money Concept (SMC) analysis shows an Undefined Structure and an unstated “State.” However, the “Supply” has been Mitigated (Wick) , indicating that a previous supply zone has been tested or partially cleared. The nearest “Demand” zone is identified between 3251.98 - 3154.45 . Given the Very Strong SELL from the H4 dashboard and the mitigated supply, price is likely to continue its descent towards the identified Demand zone.

This movement towards demand could present a BUY setup if the demand zone holds, as it would indicate a potential reversal or strong support. The nearest Resistance is at 3395.15 - 3366.43 (546 pips) , and Support is at 3273.76 - 3246.73 (380 pips) . The current price action suggests a continuation towards the Support zone, which aligns with the identified Demand area in the SMC analysis, reinforcing the potential for a BUY opportunity upon reaching that level.

Disclaimer: This analysis is based solely on data from the provided dashboard and is intended for educational purposes only. Trading involves risk, and by following this analysis or its signals, you may incur financial losses. Please exercise caution and make your own informed trading decisions.

Daily EURCAD Technical Analysis & Trading Signals (July 08)

Analysis: The H4 dashboard indicates a Very Strong BUY (100%) signal from the Moving Averages. Other indicators like MACD, Stochastic, RSI, and CCI also show a BUY signal, while ADX suggests a Weak BUY .

The “Overall” analysis, considering M5, M30, and H1 timeframes, points to a Very Strong BUY (50%) , reinforcing the bullish sentiment across shorter timeframes.
Current market conditions are characterized by a Weak Trend , with Medium Volatility . This suggests that while there’s a bullish bias, the trend lacks significant momentum, and price movements are not excessively volatile.

From a Smart Money Concept (SMC) perspective, the Structure is Bullish (BOS - Break of Structure) , but the State is “Waiting Pullback.” This implies that while the underlying trend is upward, a retracement is anticipated before the next leg up. The nearest Supply zone is identified between 1.6150 - 1.6055 , and the Demand zone is 1.5787 - 1.5669 . The nearest Support zone is at 1.5394 - 1.5321 (641 pips) , with no immediate Resistance indicated. Given the Bullish Structure and the “Waiting Pullback” state, the price is likely to retrace towards the Demand zone (1.5787 - 1.5669) or the Support zone (1.5394 - 1.5321) before potentially resuming its upward movement. This pullback could present a BUY setup if the price finds strong support within these zones. Traders should monitor for signs of bullish reversal in these areas for potential long entries.

Disclaimer: This analysis is based solely on data from the provided dashboard and is intended for educational purposes only. Trading involves risk, and by following this analysis or its signals, you may incur financial losses. Please exercise caution and make your own informed trading decisions.

Technical Analysis Dashboard v4.48.zip (537.9 KB)

Daily Gold Technical Analysis & Trading Signals (July 08)

Analysis: The dashboard’s Standard Indicator Analysis for the current H1 timeframe shows a strong bearish bias. The MA indicates a Strong SELL (83%) , implying price is below five of the six moving averages. Both RSI and CCI are also signaling SELL . While MACD indicates SELL , Stochastic shows BUY , suggesting a potential short-term counter-trend move. ADX points to a Weak SELL , indicating that while the trend is bearish, its strength is not robust.

The Overall dashboard signal, which synthesizes analysis across M5, M30, and H1 timeframes, is a SELL (27%) . This suggests a general bearish sentiment across multiple timeframes, although the lower percentage indicates less conviction than a “Strong SELL.”

Regarding Market Conditions , the dashboard identifies a Weak Trend , aligning with the ADX reading. This implies the current bearish move lacks significant momentum and could be prone to consolidation or reversal. Volatility is assessed as Medium , indicating normal price movement without extreme fluctuations.

The Smart Money Concepts (SMC) Engine indicates a Bearish (BOS) Structure , confirming the prevailing downtrend. The State is Waiting Pullback , signifying that after the bearish move, the engine anticipates a return to a high-probability zone for potential further selling opportunities. A Supply zone is identified between 3339.29 - 3332.59 , suggesting this area could act as resistance if price pulls back. Conversely, no high-probability Demand zone is currently in play.

The nearest Resistance is found between 3345.65 - 3337.87 with 100% quality, and Support is at 3277.81 - 3274.45 also with 100% quality. Given the Bearish (BOS) structure and the Waiting Pullback state, the price is likely to retrace upwards towards the identified Supply zone at 3339.29 - 3332.59 . This retracement, if it occurs, would align with the Stochastic BUY signal. Upon reaching this Supply zone, especially considering its proximity to the Resistance zone, we could expect sellers to step in, leading to a potential SELL setup and continuation of the bearish trend towards the Support at 3277.81 - 3274.45 .

The Fibo Swing suggests a Retracement to the Golden Pocket (SMC Confluence) at 3265.55, 3238.29 , further reinforcing potential downside targets if the bearish trend continues. The EW Phase shows No Clear Impulse , indicating the absence of a distinct 5-wave pattern at this time.

Disclaimer: This analysis is based solely on data from the provided dashboard and is intended for educational purposes only. Trading involves risk, and by following this analysis or its signals, you may incur financial losses. Please exercise caution and make your own informed trading decisions.

Technical Analysis Dashboard v4.63.zip (782.2 KB)

Daily EURUSD Technical Analysis & Trading Signals (July 09)

Forecast: For EURUSD , the dashboard indicates a "Liquidity Sweep Reversal! " via the Smart Money Concepts engine, signifying a high-priority reversal signal. This means price initially faked out traders by sweeping old highs/lows, then reversed forcefully.

Looking ahead, the Predictive Analysis Engine shows a "Golden Pocket (SR+SMC Conf.) " for retracement, aligning the 50-61.8% Fibonacci zone with both strong Support/Resistance and high-probability SMC zones, suggesting a powerful reversal area. The Elliott Wave Phase is “A-B-C Correction Expected,” forecasting a 3-wave correction after a completed 5-wave impulse. This implies current price action is likely a corrective move, potentially targeting the confirmed Golden Pocket before a new impulsive trend.

Disclaimer: This analysis is based solely on data from the provided dashboard and is intended for educational purposes only. Trading involves risk, and by following this analysis or its signals, you may incur financial losses. Please exercise caution and make your own informed trading decisions.

Technical Analysis Dashboard v4.63.zip (782.2 KB)

Daily Gold Technical Analysis & Trading Signals (July 11)

Analysis: Based on the dashboard’s analysis, Gold is currently in a strong, high-volatility uptrend on the 30-minute timeframe. A powerful confluence of core indicators, including the MA, MACD, and ADX, are signaling strong buying pressure, indicating that significant upward momentum is driving the market at this moment.

The dashboard has identified a classic Bull Flag pattern that is currently forming, suggesting the market is taking a brief pause before a potential continuation of its primary trend. A breakout is currently pending, with the price contained within the 3374.74 and 3361.72 levels.

Looking ahead, a confirmed breakout above the flag’s upper boundary would signal the uptrend is resuming, with the first major test being the high-quality resistance zone at 3382.00. Conversely, if a deeper pullback occurs, the Fibonacci Golden Pocket near 3350 presents a key support area where buyers may step back in.

Disclaimer: This analysis is based solely on data from the provided dashboard and is intended for educational purposes only. Trading involves risk, and by following this analysis or its signals, you may incur financial losses. Please exercise caution and make your own informed trading decisions.

Technical Analysis Dashboard v4.89.zip (880.6 KB)