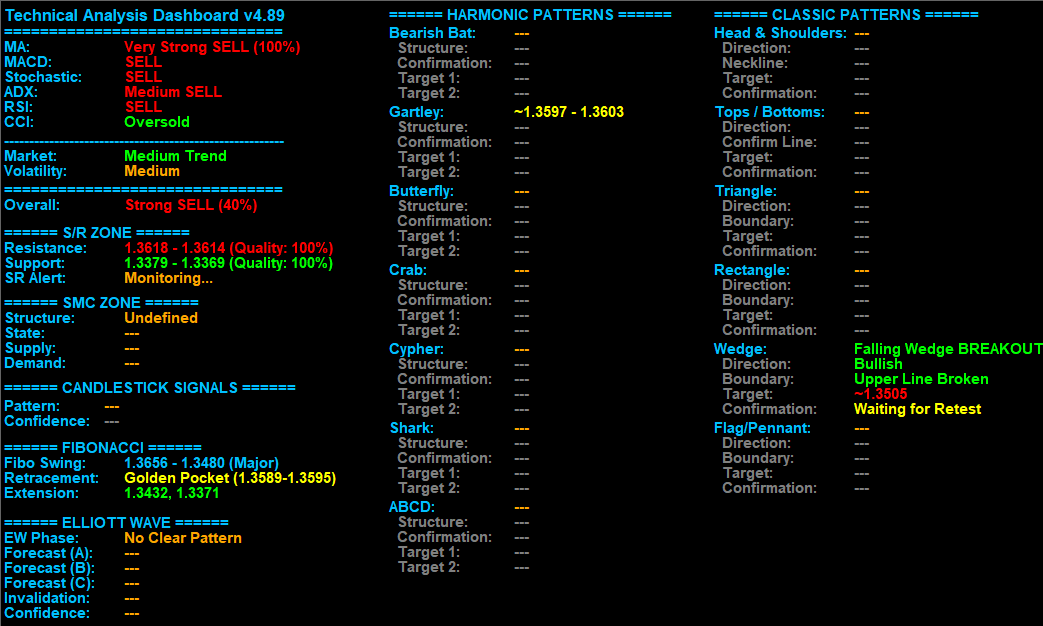
Daily GBPUSD Technical Analysis & Trading Signals (July 12)
Analysis: Based on the H1 timeframe for GBPUSD, the dashboard indicates a market dominated by bearish pressure. The overall signal is a Strong SELL , supported by a consensus across the moving average, MACD, and ADX indicators, which all point to an established medium-strength downtrend. Price is currently situated between a fresh, high-quality resistance zone at 1.3618 and support far below at 1.3379.
However, a significant classic pattern has emerged, signaling a potential shift. A bullish Falling Wedge BREAKOUT has been confirmed, and the engine is now in a crucial “Waiting for Retest” phase. This suggests the current downtrend could be challenged. The immediate future hinges on whether the price successfully retests its breakout point and moves higher, or if sellers retake control, pushing the price back down towards the Fibonacci extension targets of 1.3432 and 1.3371.
Disclaimer: This analysis is based solely on data from the provided dashboard and is intended for educational purposes only. Trading involves risk, and by following this analysis or its signals, you may incur financial losses. Please exercise caution and make your own informed trading decisions.
EUR/JPY
$172.39USD +$1.30 (+0.76%)
Prev close: 171.086
Day Range US$170.81 - US$172.42
Open US$171.10
52W Range US$154.44 - US$173.41
24H Volume US$78.63M
The EURJPY is currently exhibiting a strong bullish technical profile, with several indicators and price action elements supporting continued upward momentum:
- Current Price: 172.39, near its year high of 173.41, and well above its 50-day (165.70) and 200-day (162.58) moving averages, confirming a robust uptrend.
- Short-Term Trend: Recent price action broke above key resistance at 169.55, accelerating an impulse wave higher. Technical projections suggest a move toward the 172.00–173.00 area as the next resistance zone.
- Technical Indicators:
- Moving averages (short and long-term) are strongly bullish.
- Oscillators (RSI, CCI, Williams %R) are in overbought territory on lower timeframes, which may indicate the potential for minor pullbacks or consolidation, but do not yet signal a reversal.
- Market Sentiment: Technical ratings from multiple sources (daily, weekly, and monthly) are at strong buy.
- Volume: Trading volume is healthy, though slightly below average, indicating sustained interest but not yet at euphoric extremes.
- Support and Resistance:
- Immediate support: 170.80–171.10 (recent lows and breakout retest zones).
- Immediate resistance: 172.00–173.40 (current price zone and year high).
- Chart Structure: Price is trading within a clear bullish channel, with repeated successful tests of support and higher highs being formed.
- Wave Analysis: The pair is in an active impulse wave, with technical targets aligning at the intersection of two upward channels, suggesting further upside is probable unless a sharp reversal occurs.
Key Risks/Warnings:
- Overbought conditions on short timeframes may prompt brief corrections or sideways movement before any further rally.
- A sustained break below 170.80 would be the first warning of a potential trend change.
Summary: The EURJPY pair is in a strong uptrend, supported by bullish technicals across multiple timeframes. The next significant resistance lies at 172.00–173.40. Short-term overbought signals suggest caution for new entries, but the broader picture remains bullish unless key support levels are broken.
Trading involves risk, and by following this analysis or its signals, you may incur financial losses. Please exercise caution and make your own informed trading decisions.
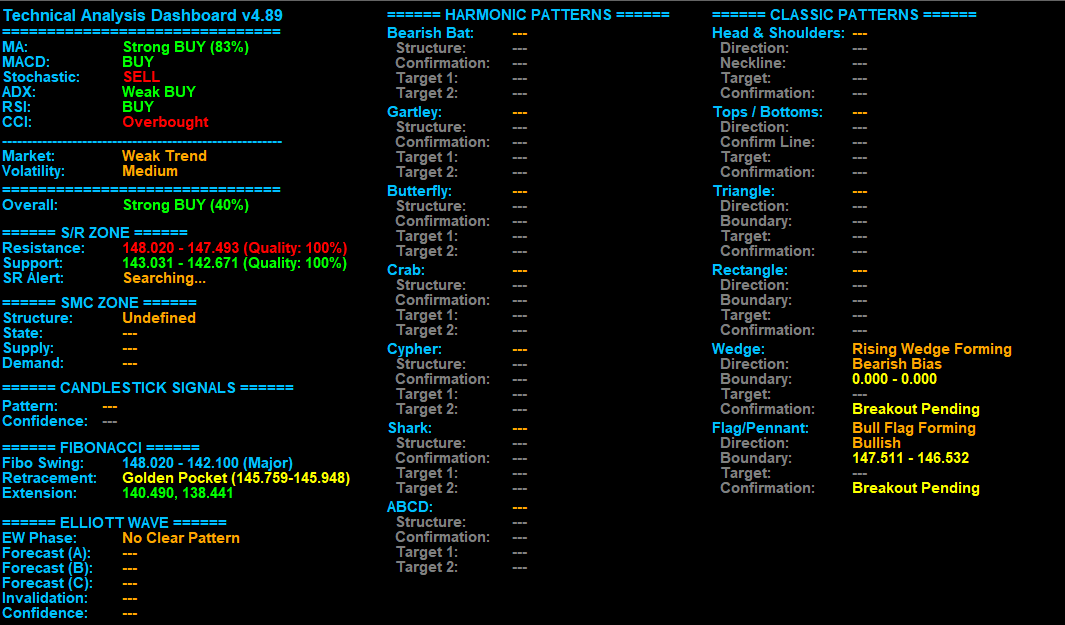
Daily USDJPY Technical Analysis & Trading Signals (July 12)
Analysis: Based on the standard indicators, the USDJPY daily chart is showing a strong bullish bias. The Moving Average (MA) analysis points to a Strong BUY with an 83% alignment, while the Relative Strength Index (RSI) is also in a BUY state. The Average Directional Index (ADX), however, suggests the trend is currently Weak . The Stochastic and Commodity Channel Index (CCI) indicators show conflicting signals, with Stochastic indicating a SELL and CCI pointing to an Overbought condition, which may suggest a potential reversal or pullback could be due.
The overall sentiment is Strong BUY (40%), but the market is in a Weak Trend with Medium volatility.
The nearest support and resistance zones are high-quality, with the resistance zone at 148.020 - 147.493 and the support zone at 148.031 - 142.671. The Fibonacci analysis highlights a Golden Pocket for retracement at 145.759 - 145.948, which could be a key area if a pullback occurs. Currently, no Elliott Wave, Harmonic, or Candlestick patterns are active, but a Rising Wedge pattern is forming with a bearish bias and a Bull Flag pattern is pending a breakout, suggesting some potential for a future bearish movement.
Disclaimer: This analysis is based solely on data from the provided dashboard and is intended for educational purposes only. Trading involves risk, and by following this analysis or its signals, you may incur financial losses. Please exercise caution and make your own informed trading decisions.
Technical Analysis Dashboard v4.89.zip (880.6 KB)
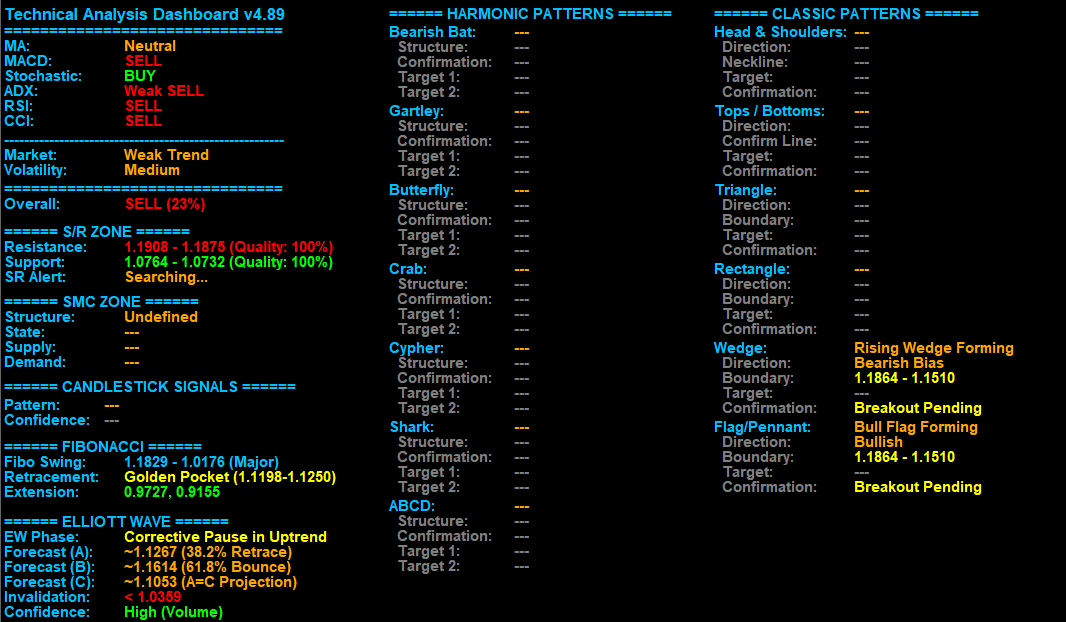
Daily EURUSD Technical Analysis & Trading Signals (July 13)
Analysis: Based on the Technical Analysis Dashboard data for EURUSD on the H4 timeframe, the market presents a predominantly bearish outlook despite some mixed signals. The overall consensus from a wide range of indicators points to a sell signal (23%) . While a few indicators show a mixed or neutral stance, the majority, including the RSI and CCI, are in a decisive sell position. The market is also identified as being in a weak trend with medium volatility.
The predictive engines offer a clear forecast for the potential future path. The Elliott Wave analysis suggests a “Corrective Pause in Uptrend” and projects a future target for a downward move, with a final target for wave C at 1.1053. The Fibonacci analysis further supports this by identifying a “Golden Pocket” as a key retracement zone. Additionally, a classic “Rising Wedge” pattern is currently forming , which has a bearish bias and reinforces the expected downward breakout.
The Support & Resistance (S/R) and Smart Money Concepts (SMC) engines have identified nearby high-quality resistance and support zones. The S/R alert is currently “Searching…” for the next key zone, indicating the price is in “no man’s land.” The SMC engine remains undefined, but the combination of Elliott Wave and Classic Patterns provides a compelling picture of an imminent downward move.
Disclaimer: This analysis is based solely on data from the provided dashboard and is intended for educational purposes only. Trading involves risk, and by following this analysis or its signals, you may incur financial losses. Please exercise caution and make your own informed trading decisions.
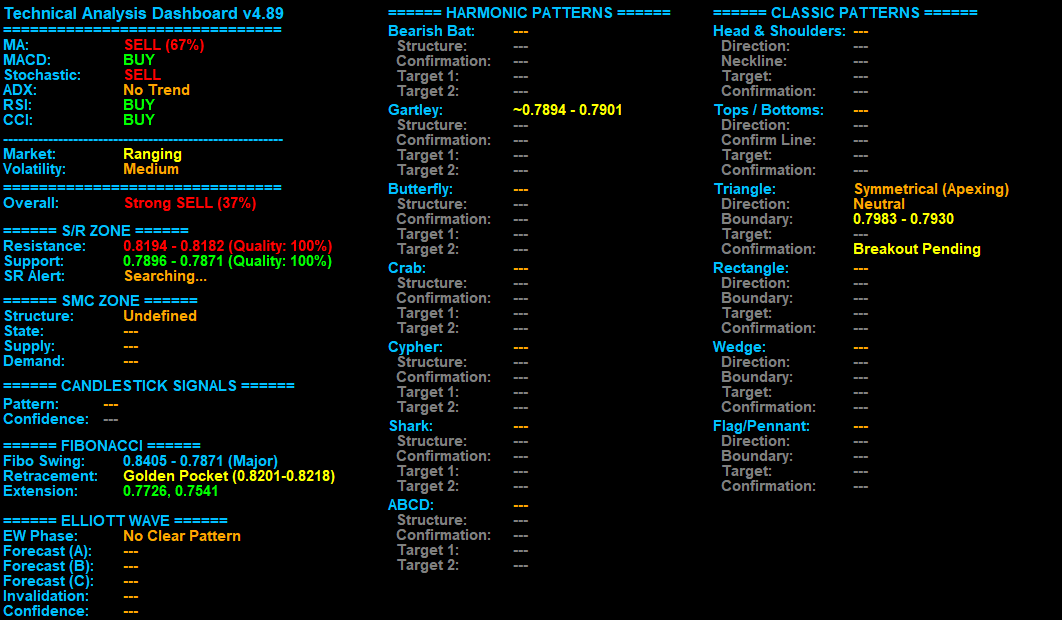
Daily USDCHF Technical Analysis & Trading Signals (July 13)
Analysis: Based on the dashboard analysis for USDCHF on the H4 timeframe, the market is currently in a Ranging state with Medium volatility. The classic indicators show mixed signals, with the MA signaling SELL while the MACD, Stochastic, RSI, and CCI are all indicating BUY or Neutral conditions, highlighting the lack of a clear trend. The ADX confirms this, showing No Trend at all. This is synthesized into a moderately bearish Overall signal of Strong SELL (37%) , suggesting a weak downward bias.
The Support & Resistance engine identifies nearby resistance and support zones with 100% quality. Notably, the Symmetrical (Apexing) triangle pattern is currently forming, with a Breakout Pending . This is the most crucial signal on the dashboard, as the triangle’s boundaries at 0.7983 and 0.7930 will define the market’s next move.
A potential breakout will determine if the weak bearish bias strengthens or a bullish reversal takes place. The Fibonacci Golden Pocket at 0.8201-0.8218 provides a potential retracement target if a bullish move occurs.
Disclaimer: This analysis is based solely on data from the provided dashboard and is intended for educational purposes only. Trading involves risk, and by following this analysis or its signals, you may incur financial losses. Please exercise caution and make your own informed trading decisions.
Technical Analysis Dashboard v4.89.zip (1.1 MB)
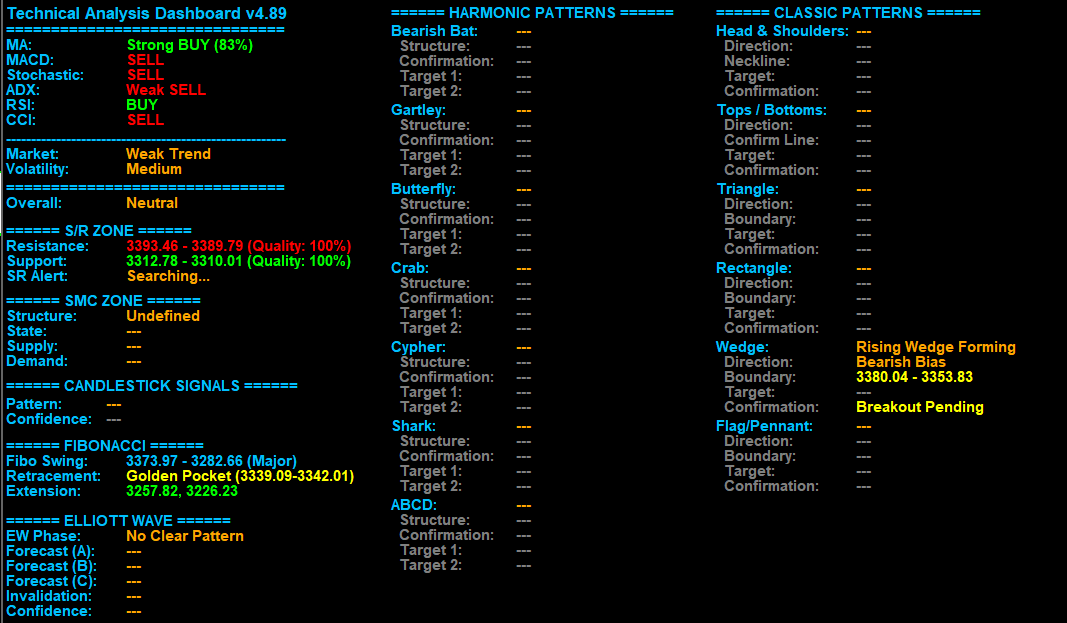
Daily Gold Technical Analysis & Trading Signals (July 14)
Analysis: Based on the dashboard data for Gold on the H1 timeframe, the market is displaying mixed signals within a weak trend. The overall bias is Neutral , despite the MA being a Strong BUY with an 83% alignment. The MACD and Stochastic are both signaling BUY , but the ADX indicates a Weak Trend , confirming the lack of a strong directional move. This is a key point—while the price is above many moving averages, the trend itself lacks momentum.
A significant classic pattern, a Rising Wedge , is Forming with a bearish bias and a Breakout Pending . This pattern suggests that despite the current bullish indicators, a potential downward reversal is on the horizon. The dashboard has identified the key boundaries for this wedge between 3380.04 and 3353.83. The Fibonacci engine identifies a retracement target at the Golden Pocket (3339.09-3342.01), which aligns well with the potential bearish breakout of the wedge. The presence of this wedge pattern is the most critical signal, pointing to a probable future move.
Disclaimer: This analysis is based solely on data from the provided dashboard and is intended for educational purposes only. Trading involves risk, and by following this analysis or its signals, you may incur financial losses. Please exercise caution and make your own informed trading decisions.
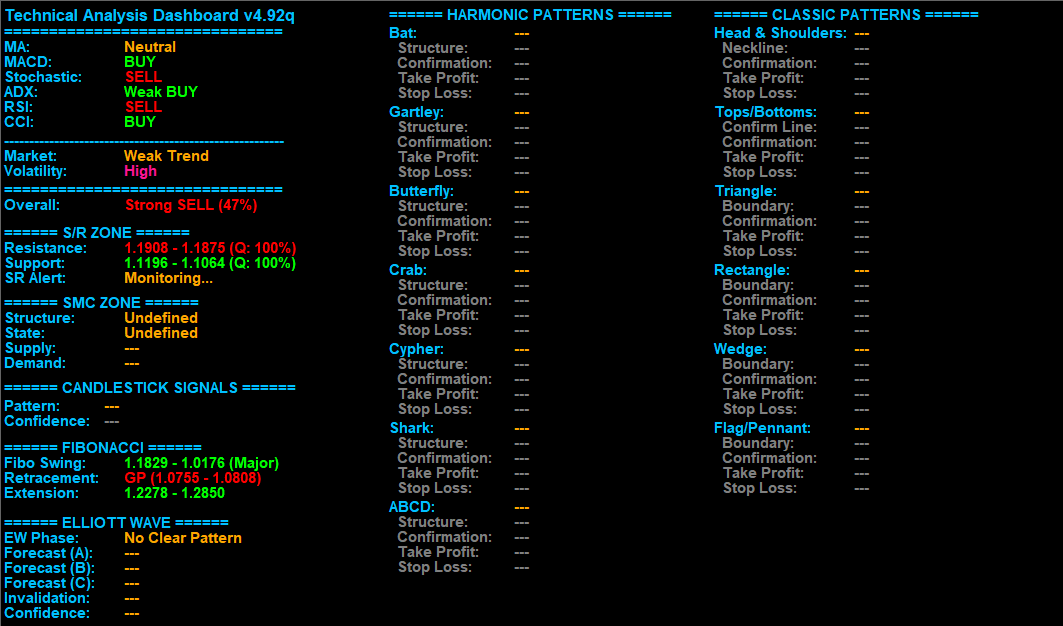
Daily EURUSD Technical Analysis & Trading Signals (July 19)
Analysis: This H4 chart for EURUSD indicates a generally weak trend with high volatility , suggesting potential for erratic price movements. While the Moving Averages are Neutral , both MACD and RSI are signaling SELL , contrasting with Stochastic and CCI which indicate BUY . The overall dashboard sentiment is a Strong SELL (47%) , pointing towards a likely downward bias despite the mixed individual indicator signals.
Current price is within a “no man’s land” as the dashboard is Monitoring support and resistance zones rather than actively engaging them. Fibonacci analysis identifies a recent major swing and a “Golden Pocket” retracement zone between 1.0755 and 1.0808, a crucial area for potential reversals.
The Elliott Wave and Harmonic Pattern engines currently show No Clear Pattern , indicating the absence of highly probable complex wave structures or reversal formations. Similarly, the Smart Money Concepts engine and Classic Pattern engine are undefined or inactive, meaning there are no high-probability smart money setups or clear classic chart patterns at play right now.
Disclaimer: This analysis is based solely on data from the provided dashboard and is intended for educational purposes only. Trading involves risk, and by following this analysis or its signals, you may incur financial losses. Please exercise caution and make your own informed trading decisions.
Technical Analysis Dashboard v4.92q.zip (979.1 KB)
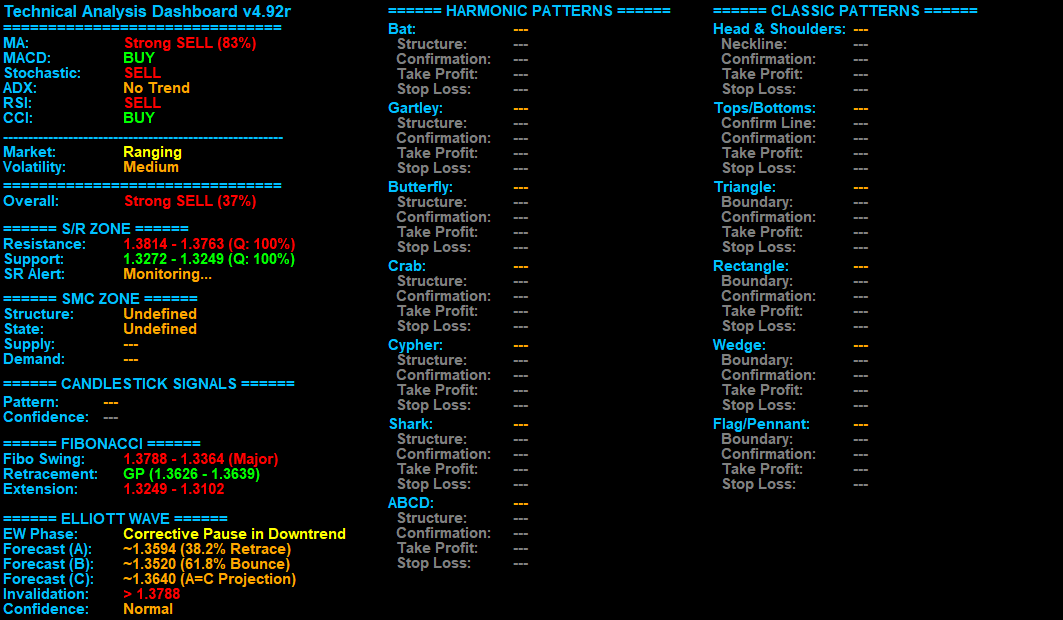
Daily GBPUSD Technical Analysis & Trading Signals (July 19)
Analysis: This H4 GBPUSD chart presents a Ranging Market with Medium Volatility . The dashboard’s Overall bias is a Strong SELL (37%) , despite mixed individual indicator signals like Strong SELL from MA and RSI, contrasting with BUY from MACD and CCI. ADX notably indicates No Trend .
The current price of 1.3405 is between active support and resistance zones, with the dashboard Monitoring them. Significant resistance lies at 1.3814 - 1.3763 (Quality: 100%) and strong support at 1.3272 - 1.3249 (Quality: 100%). Fibonacci analysis highlights a major swing with a Golden Pocket retracement at 1.3626 - 1.3639.
The Elliott Wave engine identifies a Corrective Pause in Downtrend , forecasting a potential ABC correction with targets for Wave A at ~1.3594, Wave B at ~1.3520, and Wave C at ~1.3640, with invalidation above 1.3788. Harmonic, SMC, Candlestick, and Classic Pattern engines currently show no active high-probability setups.
Disclaimer: This analysis is based solely on data from the provided dashboard and is intended for educational purposes only. Trading involves risk, and by following this analysis or its signals, you may incur financial losses. Please exercise caution and make your own informed trading decisions.