Dear Forum Members!
Here you can find Daily Market Analysis of Forex, Cryptocurrency, Indexes, Metals, Oil and others.
We hope that this information will be helpful for your trading.
Best Regards
FXOpen Team
Dear Forum Members!
Here you can find Daily Market Analysis of Forex, Cryptocurrency, Indexes, Metals, Oil and others.
We hope that this information will be helpful for your trading.
Best Regards
FXOpen Team
AUD/USD traded higher but faced sellers near 0.7075. NZD/USD is correcting gains and approaching a key support zone near the 0.6350 level.
The Aussie Dollar formed a base above the 0.6850 level and started a fresh increase against the US Dollar. The AUD/USD pair gained pace for a move above the 0.6950 resistance zone.
There was a clear move above the 0.7000 resistance zone and the 50 hourly simple moving average. The pair traded as high as 0.7072 and is currently correcting gains. There was a move below the 0.7025 support zone.
AUD/USD Hourly Chart
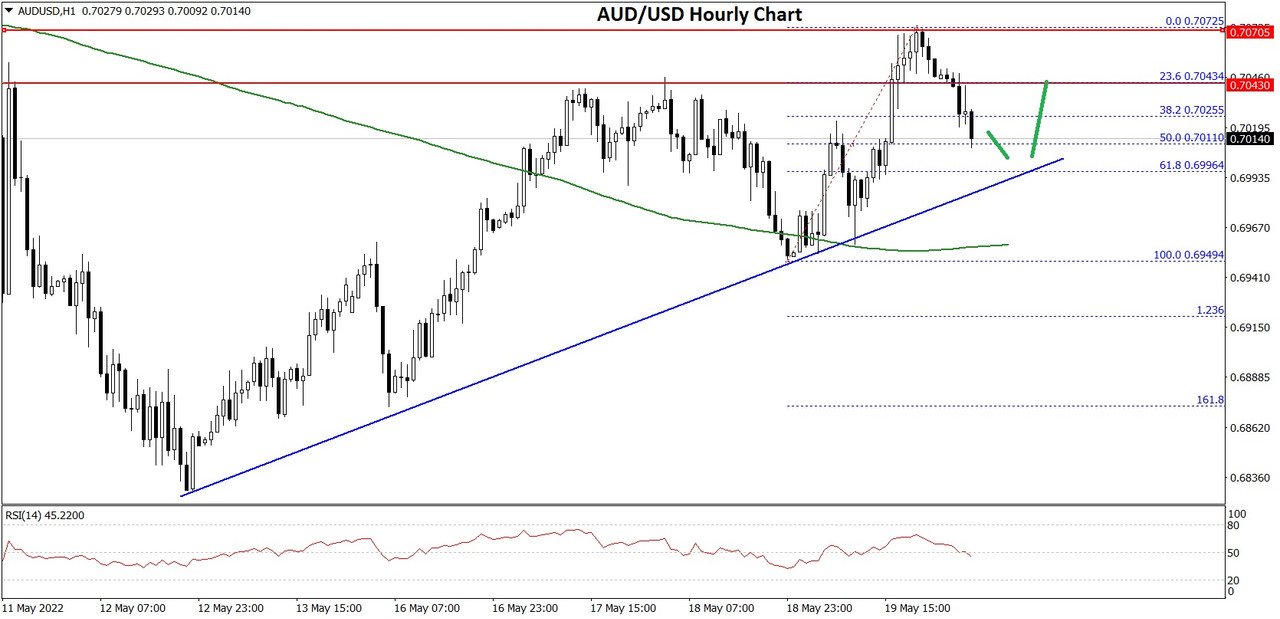
The pair is now trading near the 50% Fib retracement level of the upward move from the 0.6949 swing low to 0.7072 high. On the downside, an initial support is near the 0.7000 level.
There is also a key bullish trend line forming with support near 0.7000 on the hourly chart of AUD/USD. The trend line is near the 61.8% Fib retracement level of the upward move from the 0.6949 swing low to 0.7072 high.
The next support could be the 0.6950 level. If there is a downside break below the 0.6950 support, the pair could extend its decline towards the 0.6900 level. Any more downsides might send the pair toward the 0.6850 level.
On the upside, the AUD/USD pair is facing resistance near the 0.7040 level. The next major resistance is near the 0.7075 level. A close above the 0.7075 level could start a steady increase in the near term. The next major resistance could be 0.7150.
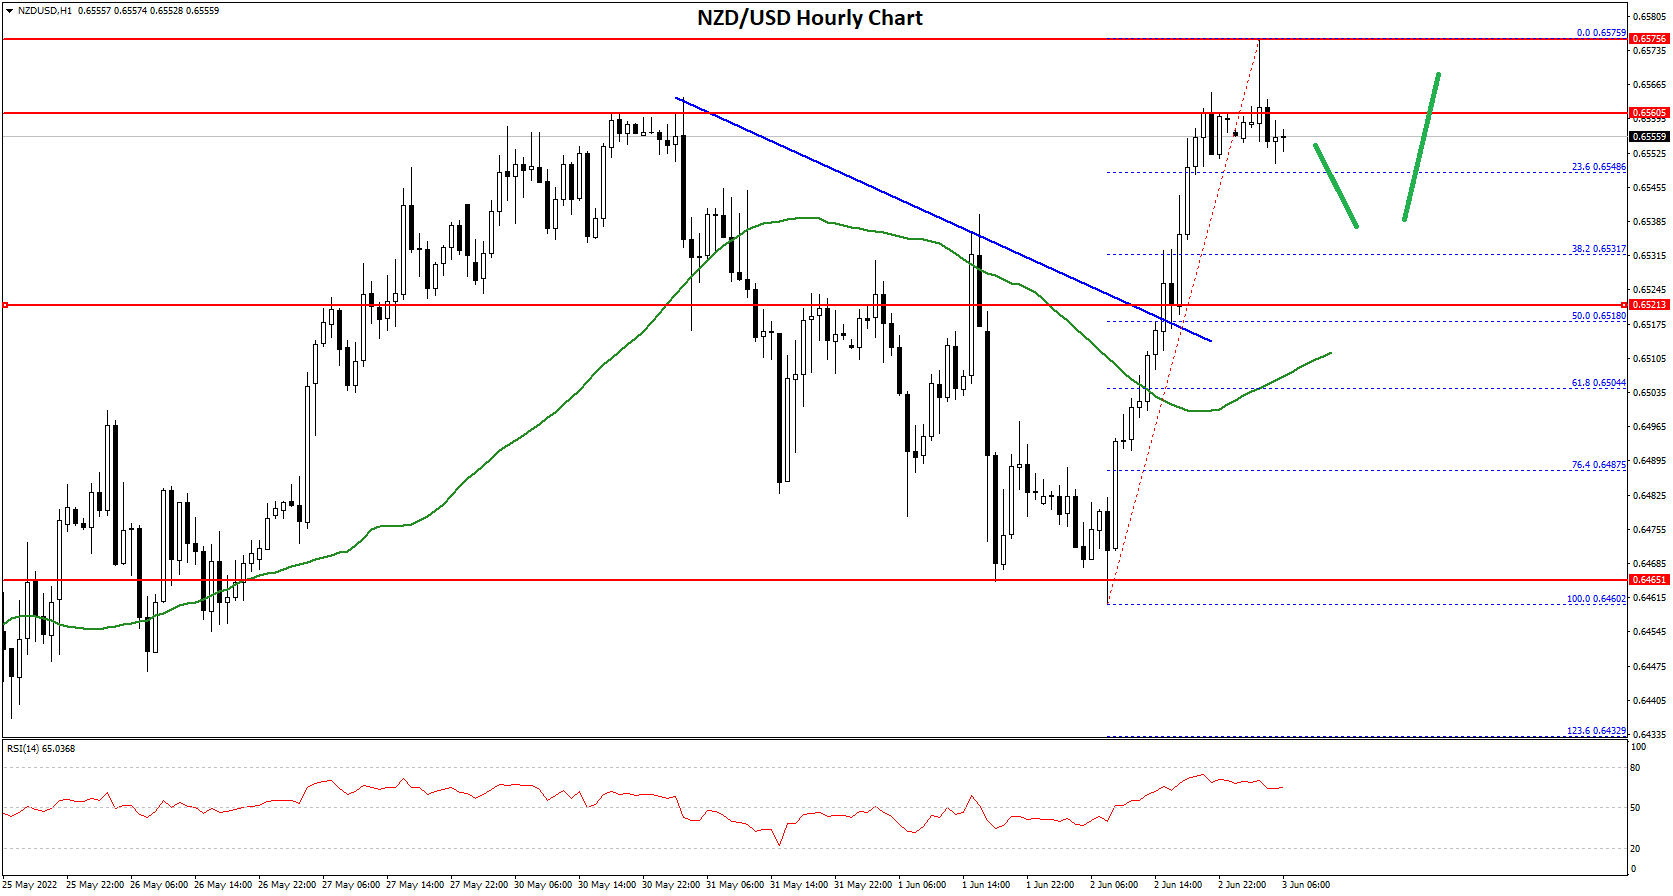
The New Zealand Dollar also followed a similar path from the 0.6220 zone against the US Dollar. The NZD/USD pair gained pace above the 0.6300 resistance zone.
There was a clear move above the 0.6350 resistance zone and the 50 hourly simple moving average. Besides, there was a move above a major contracting triangle with resistance near 0.6355 on the hourly chart of NZD/USD.
NZD/USD Hourly Chart

It even spiked above the 0.6400 level and traded as high as 0.6416. It is now correcting gains and trading below the 23.6% Fib retracement level of the upward move from the 0.6290 swing low to 0.6416 high.
On the downside, an initial support is near the 0.6350 level. It is near the 50% Fib retracement level of the upward move from the 0.6290 swing low to 0.6416 high. The next support could be the 0.6330 zone. If there is a downside break below the 0.6330 support, the pair could extend its decline towards the 0.6300 level.
On the upside, an initial resistance is near the 0.6400 level. The next major resistance is near the 0.6420 level. A clear move above the 0.6420 level might even push the pair towards the 0.6480 level.
GBP/USD started a fresh increase above the 1.2400 resistance zone. GBP/JPY is consolidating and might rise steadily above the 160.50 resistance zone.
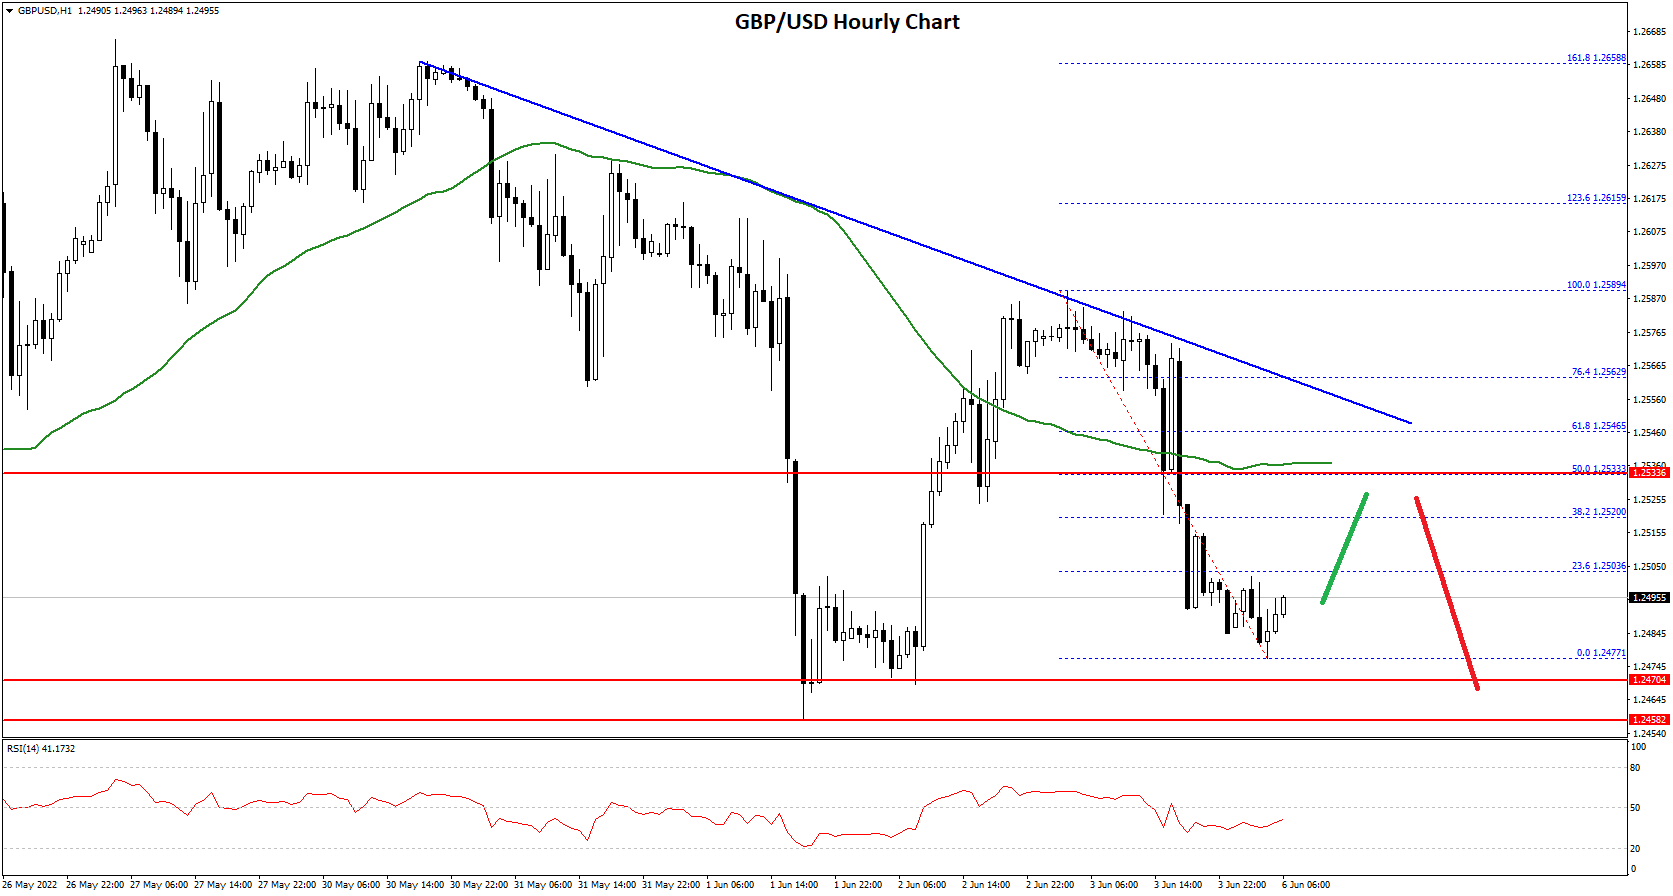
This past week, the British Pound formed a base above the 1.2150 level against the US Dollar. The GBP/USD pair started a steady increase above the 1.2200 and 1.2320 resistance levels.
There was also a clear move above the 1.2450 resistance and the 50 hourly simple moving average. The recent price action was bullish, and the pair even climbed above the 1.236 Fib extension level of the downward move from the 1.2500 swing high to 1.2329 low (formed on FXOpen).
GBP/USD Hourly Chart
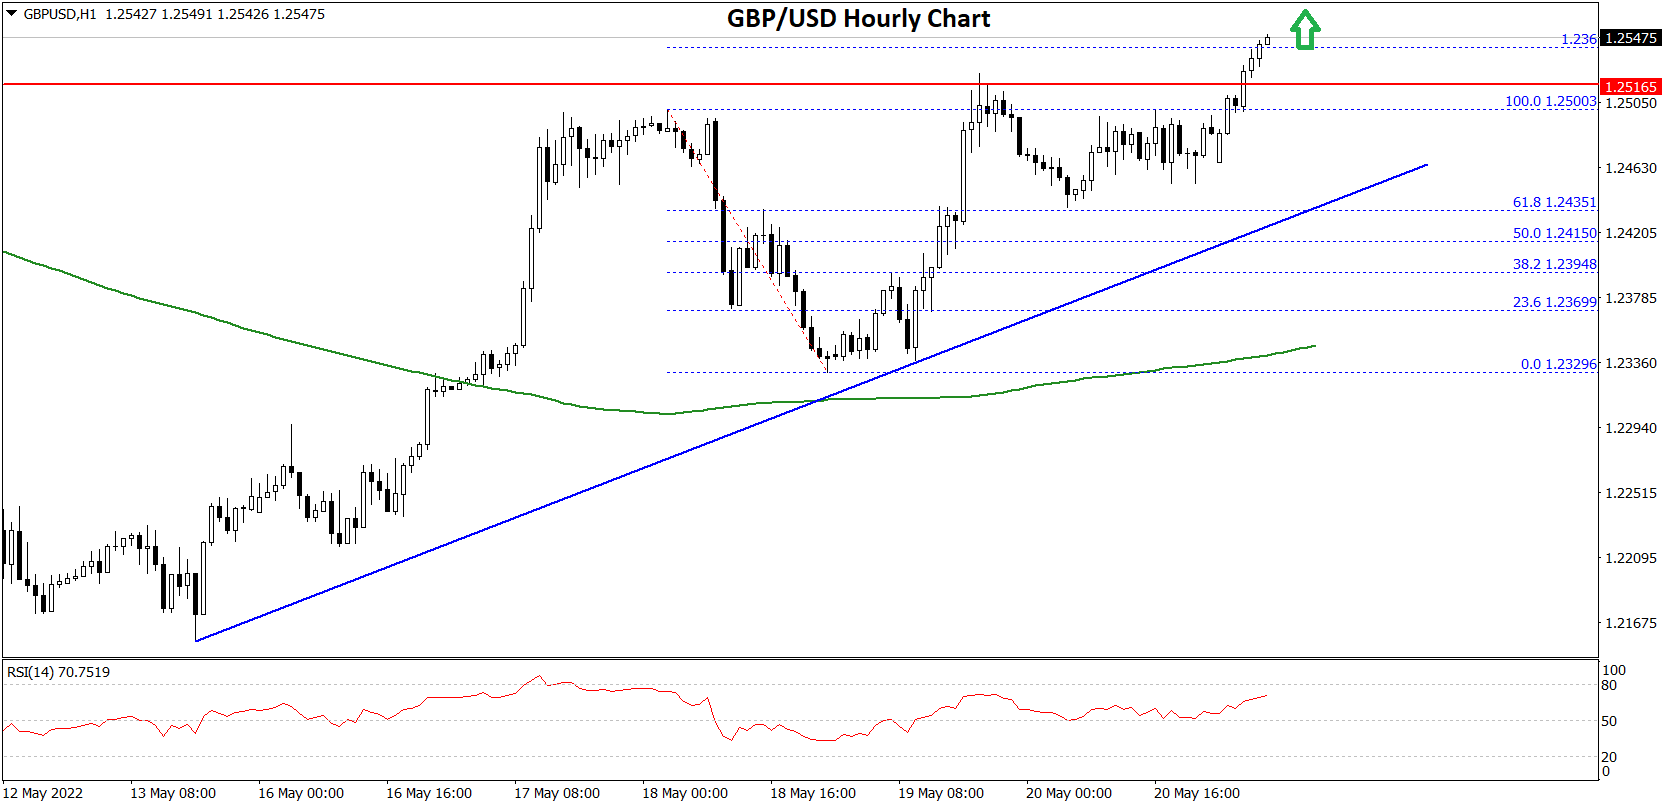
It is now consolidating above the 1.2500 level. On the upside, the pair is facing resistance near the 1.2550 level. The next major hurdle is near the 1.2600 level.
The 1.618 Fib extension level of the downward move from the 1.2500 swing high to 1.2329 low is also near the 1.2600 zone. An upside break above 1.2600 could set the pace for a move towards the 1.2720 resistance zone.
If there is no upside break above 1.2600, the pair could start a fresh decline. An immediate support is near the 1.2500. The next major support is near the 1.2450 level.
There is also a key bullish trend line forming with support near 1.2465 on the hourly chart of GBP/USD. If there is a break below the 1.2450 support, the pair could test the 1.2320 support.
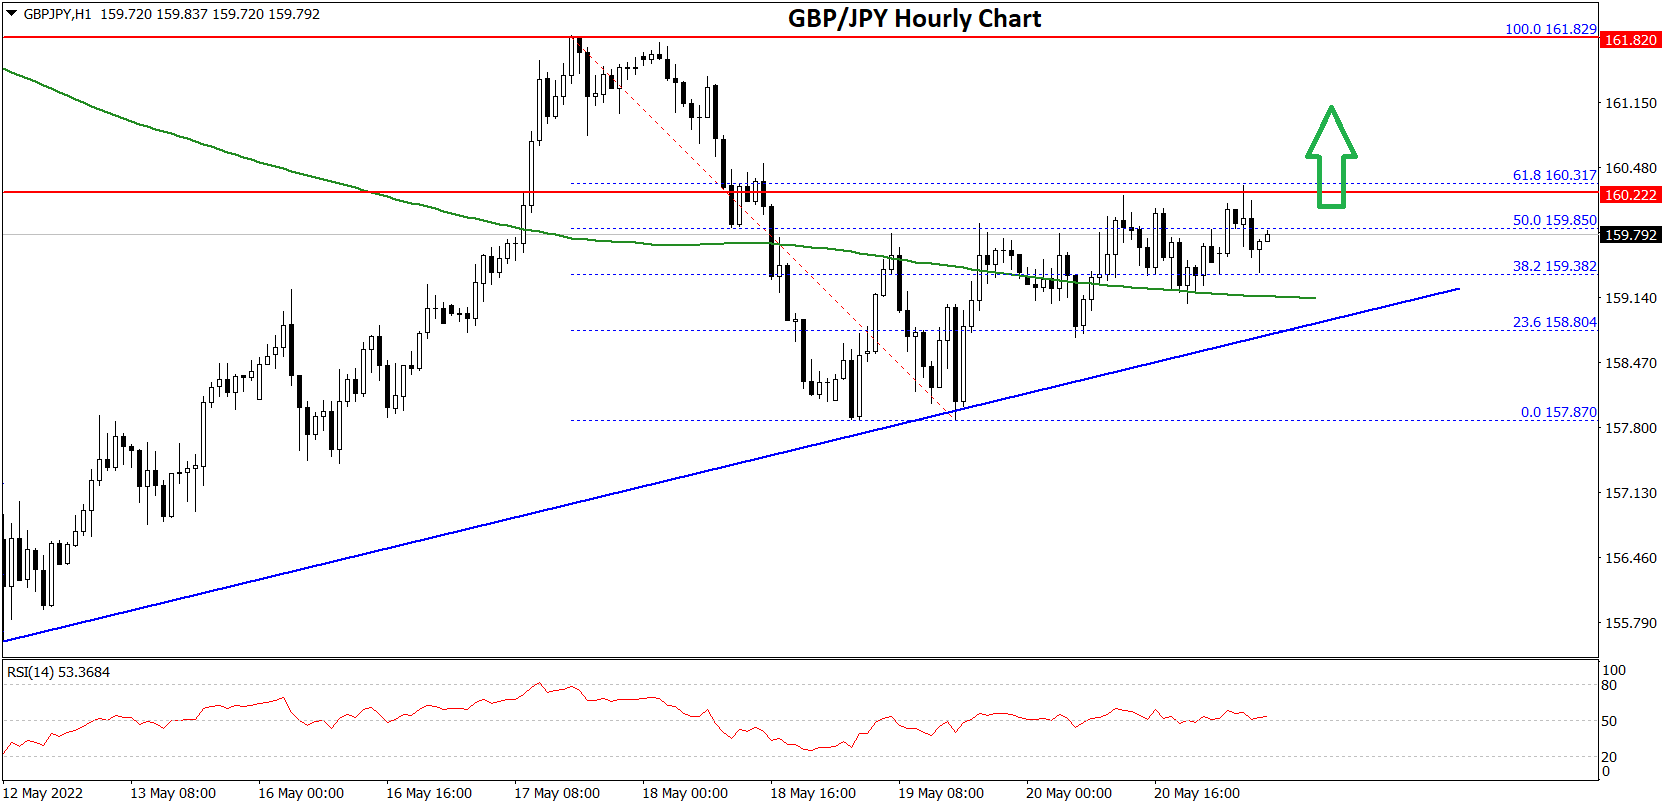
The British Pound also started a fresh increase from the 155.50 support zone against the Japanese Yen. The GBP/JPY pair gained pace above the 160.00 level to enter a positive zone.
There was a clear move above the 161.00 level and the 50 hourly simple moving average. The pair traded as high as 161.82 before there was a downside correction. There was a break below the 160.00 level, but the pair remained well bid above 157.50.
GBP/JPY Hourly Chart
A low is formed near 157.87 and the pair is now rising. There was a move above the 50% Fib retracement level of the recent decline from the 161.82 swing high to 157.87 low.
On the upside, GBP/JPY is facing resistance near the 160.30 level. It is near the 61.8% Fib retracement level of the recent decline from the 161.82 swing high to 157.87 low. The next key resistance could be 161.80.
A clear break above the 161.80 resistance could push the pair towards the 162.50 resistance. On the downside, an initial support is near the 159.35 level.
There is also a major bullish trend line forming with support near 159.20 on the hourly chart. The next major support is near the 159.80. If there is a downside break below the 159.80 support, the pair could decline towards the 157.50 support zone. Any more losses might send the pair towards the 156.00 level in the near term.
The euro started the trading week on a higher note after the ECB President, Christine Lagarde, said that the central bank is ready to raise the rates during the summer. In a blog posted on the ECB’s website, Lagarde said that the lift-off date is drawing closer, and it is important for the markets to know the policy normalization path ahead.
Euro needed nothing more to rally. The EUR/USD, as seen below, jumped over 100 pips or more than 1% on the news. Traders now expect that the ECB will raise the key interest rate twice in July and once in September, bringing the deposit facility rate to zero.
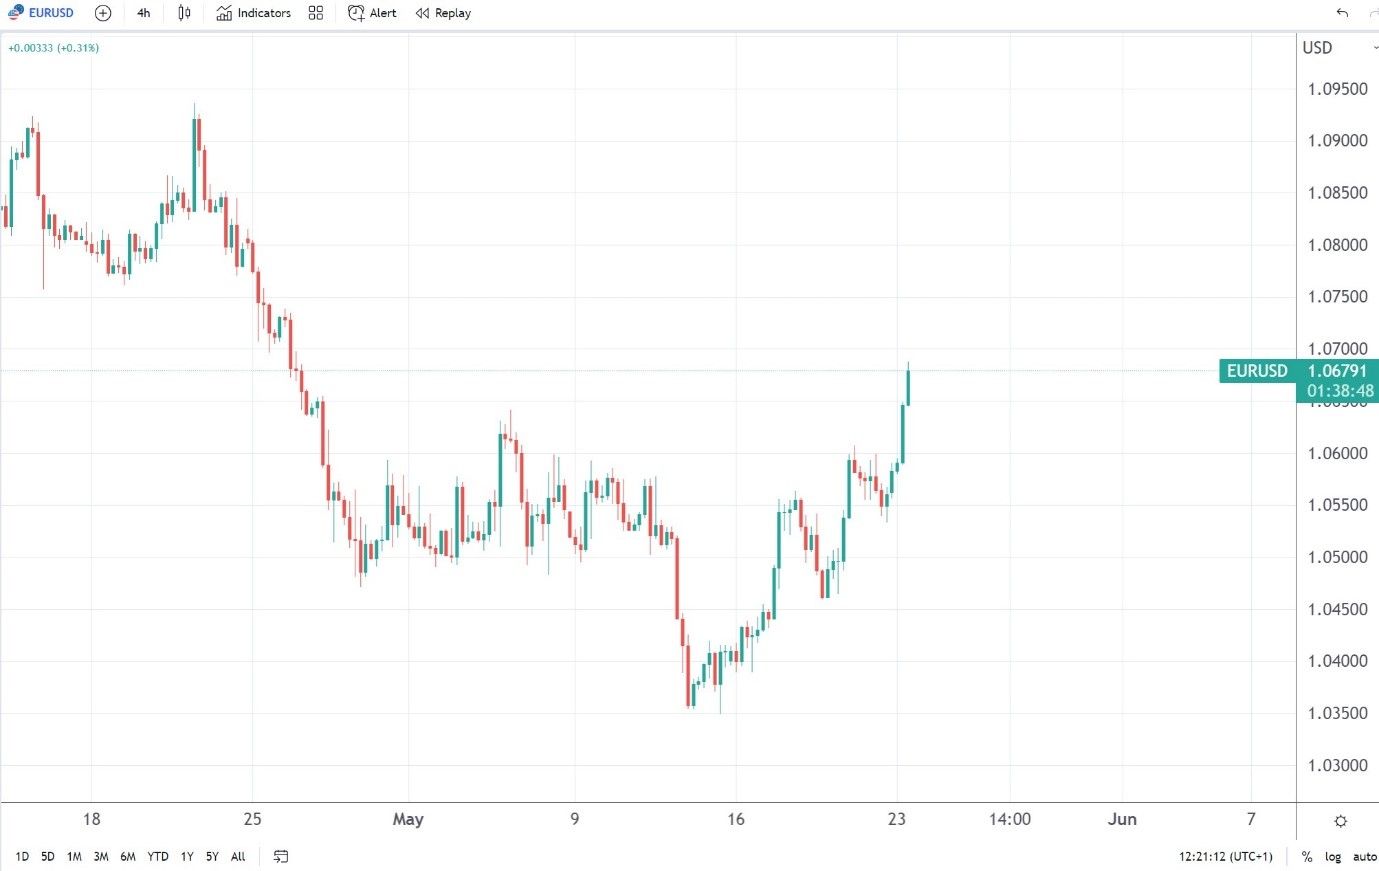
It is a milestone for the ECB. The central bank has kept the interest rate below zero for many years, but now it fears that a weaker currency might add to inflation.
It is calculated that the euro depreciation since March 2022 alone could add another 10bp on inflation this year and 20bp in the year to come. Hence, the ECB wanted to make sure that the markets know it is not tolerating inflation much higher than its price stability definition.
As a consequence, the euro rallied across the board. It gained against all its peers, not only against the US dollar.
But the EUR/USD is the exchange rate that matters. To be able to gain against the dollar at a time when the Fed is hiking the rates aggressively is something to take into account by traders.
Euro traded as high as 1.23 against the dollar only twelve months ago. The rapid depreciation to below 1.04 worried the ECB, as it fuels higher inflation.
As such, the news that the central bank plans the normalization of its policy should not come as a surprise, despite the war in Ukraine. ECB has the mandate to deal with price stability, and the only way to do so is to raise the rates to combat inflation.
All in all, today’s news confirms that the ECB joined the hawkish camp. The big question in the months ahead would be if the summer rate hikes are all the ECB is willing to do, or some more await after September?
Bitcoin was not able to sustain its bullish momentum this week, and after touching a high of 30,652 on 23rd May, started to decline heavily against the US dollar; it touched a low of 28,860 today in the Asian trading session.
The drop that we saw continues, and now the prices have entered a consolidation channel above the $29,000 handle in the European trading session.
If we see some buying at these levels, the prices will continue to remain above them in the short-term range. But in the medium-term range, we are expecting a further drop due to weak global demand cues.
We can clearly see a triple-top pattern below the $30б775 handle which is a bearish reversal pattern because it signifies the end of an uptrend and a shift towards a downtrend.
Both the STOCH and STOCHRSI are indicating overbought levels which means that in the immediate short term, a decline in the prices is expected.
The relative strength index is at 40 indicating a WEAK demand for bitcoin at the current market levels.
Bitcoin is now moving below its 100 and 200 hourly simple MAs.
Most of the major technical indicators are giving a SELL signal, which means that in the immediate short term, we are expecting targets of 28,000 and 27,500.
The average true range is indicating LESS market volatility with a mild bearish momentum.
Bitcoin: bearish reversal seen below $30,775
The Williams percent range is indicating an OVERBOUGHT level
The price is now trading just above its pivot level of $29,229
All of the MAs are giving a STRONG SELL market signal
Bitcoin continues to move in a consolidation channel above the $29,000 handle in the European trading session today. We can see the formation of a demand zone above it, but the global risk scenarios may enable further decline in the prices this week.
The immediate short-term outlook for bitcoin is mildly bearish; the medium-term outlook has turned neutral; and the long-term outlook remains neutral under present market conditions.
Bitcoin continues to consolidate above its important support level of $29,000, and with increasing demand zone formation the immediate target is $30,500.
The price of BTCUSD is now facing its classic support level of 28,819 and Fibonacci support level of 29,135, after which the path towards 28,000 will get cleared.
In the last 24hrs, BTCUSD has decreased by 3.97% with a price change of 1,210$, and has a 24hr trading volume of USD 31.034 billion. We can see an Increase of 1.58% in the trading volume as compared to yesterday, which appears to be normal.
The Week Ahead
The prices of bitcoin are moving in a mildly bearish momentum, and the immediate targets are $28,000 and $27,500.
The daily RSI is printing at 37 which means that the medium range demand continues to be weak.
We are now expecting a range-bound movement between $28,000 and $32,000 next week.
The price of BTCUSD will need to remain above the important support level of $29,000 this week.
The weekly outlook is projected at $31,500 with a consolidation zone of $30,000.
Technical Indicators:
The moving averages convergence divergence (12,26): at -161 indicating a SELL
The average directional change (14-day): at 34.90 indicating a NEUTRAL level
The rate of price change: at -0.006 indicating a SELL
The commodity channel index (14-day): at 42.96 indicating a NEUTRAL level
Ripple was unable to sustain its bullish momentum last week, and after touching a high of 0.4284 on 23rd May started to decline touching a low of 0.3999 today in the early Asian trading session.
We can see the formation of a descending triangle pattern, which is expected to push its price below the level of 0.4000 this week.
We can clearly see a bearish engulfing pattern below the 0.4300 handle which signifies the end of an uptrend and a shift towards a downtrend.
The short-term outlook for Ripple has turned mildly bearish; the medium-term outlook is neutral; and the long-term outlook is neutral under present market conditions.
The relative strength index is at 39 which signifies a WEAK demand for Ripple at the current market prices, and the continuation of the downfall.
All of the moving averages are giving a STRONG SELL signal at the current market level of 0.4052.
Ripple is now trading below its pivot level of 0.4069, and is now facing its classic support level of 0.3990 and Fibonacci support levels of 0.4048, after which the path towards 0.3800 will get cleared.
Most of the major technical indicators are giving a STRONG SELL signal.
Ripple: bearish reversal seen below 0.4300
The average directional change is indicating a NEUTRAL level
The average true range indicates LESSER market volatility
The daily RSI is below 50 at 33 indicating BEARISH trends
After declining below the handle of 0.4000, Ripple is moving into a consolidation channel above the 0.4000 levels in the European trading session today.
We can see weak global demand cues from the daily RSI levels and are now looking at the potential targets of 0.3800 and 0.3500 this week.
We can see a recovery in the levels of Ripple and this continues to hold its prices above the 0.4000 levels.
We can see that XRP touched a low of 0.4011 in the Asian trading session and an intraday high of 0.4131 in the European trading session today.
The price of XRPUSD has decreased by 4.45% with a price change of $0.0189 in the past 24hrs, and has a trading volume of 1.470 billion USD.
We can see an increase of 42.83% in the trading volume of Ripple as compared to yesterday, which is due to the heavy selling seen across the global crypto markets.
This Week Ahead
The price of XRPUSD is now moving into a consolidation channel above the 0.4000 handle, and the next visible targets are 0.3900 and 0.3800.
Ripple is now entering a bearish zone formation, and this is expected to continue next week. Also next week, Ripple is expected to enter into a consolidation channel above the 0.3800 handle.
The weekly outlook for Ripple is projected at 0.3750 with a consolidation zone of 0.3800
Technical Indicators:
The Stoch (9,6): at 40.07 indicating a SELL
The moving averages convergence divergence (12,26): at -0.059 indicating a SELL
Bull/Bear power (13 days): at -0.0568 indicating a SELL
The rate of price change: at -21.09 indicating a SELL
Ethereum was unable to sustain its bullish momentum last week, and after touching a high of 2,084 on 23rd May started to decline heavily against the US dollar.
We can see a strong bearish momentum this week and this is putting downward pressure on the prices of Ethereum below the 1,850 handle in the European trading session today.
We can see the formation of a major bearish trend line today on the hourly chart, and the pair is poised to decline further given the weak investor sentiments.
The prices touched an intraday low of $1,817 in the Asian trading session and an intraday high of $1,970 in the European trading session today.
We can clearly see a bearish engulfing pattern below the $2,087 handle which is a bearish pattern and signifies the end of a bullish phase and the start of a bearish phase in the markets.
ETH is now trading just below its pivot level of 1,860 and moving into a strong bearish channel. The price of ETHUSD is now testing its classic support level of 1,686 and Fibonacci support level of 1,819 after which the path towards 1,700 will get cleared.
The relative strength index is at 21 indicating an OVERSOLD market, and the possibility of a pullback action.
The StochRSI and Williams percent range are indicating an oversold level which means that the prices are due to correct upwards in the short-term range.
ALL of the technical indicators are giving a STRONG SELL market signal.
All of the MAs are giving a STRONG SELL signal, and we are now looking at the levels of $1,700 to $1,650 in the short-term range.
ETH is now trading below both the 100 hourly and exponential MAs.
A bearish reversal seen below the $2,087 mark
The short-term range appears to be strongly BEARISH
The daily RSI is below 50 at 21 indicating a bearish market
The average true range is indicating HIGH market volatility
ETHUSD is now moving into a strong bearish channel with the prices trading below the $1,850 handle in the European trading session today.
We can see that the commodity channel index is at an oversold level now, which means that a potential bullish reversal is possible anytime in the markets.
The price of Ethereum may continue to decline further against the US dollar due to the global risk scenario and the flight towards the safe haven assets like the US Dollar and GOLD.
The key resistance levels to watch are $1,941 and $2,260, and the price of ETHUSD needs to cross these levels for a potential Bullish reversal.
ETH has declined by 6.91% with a price change of 136$ in the past 24hrs, and has a trading volume of 15.808 Billion USD.
We can see an Increase of 13.21% in the total trading volume in the last 24 hrs which appears to be normal.
The Week Ahead
Global investors are now looking to liquidate their holdings in the cryptocurrencies, which is the main reason for the continuous fall in the price of Ethereum. The ETH 2.0 planned upgrade has also not been activated, leading to concerns about the future of Ethereum and its market value.
The immediate short-term outlook for Ether has turned strongly BEARISH; the medium-term outlook has turned BEARISH; and the long-term outlook for Ether is NEUTRAL in present market conditions.
This week, Ether is expected to move in a range between $1,600 and $1,800, and next week, it is expected to enter into a consolidation phase above the $1,800 level.
Technical Indicators:
The Williams percent range: at -96.16 indicating an OVERSOLD level
The moving averages convergence divergence (12,26): at -25.11 indicating a SELL
The ultimate oscillator: at 33.56 indicating a SELL
The rate of price change: at -6.37 indicating a SELL
Litecoin was unable to sustain its bullish momentum last week, and after touching a high of 73.80 on 23rd May started to decline heavily against the US dollar.
The ongoing bearish momentum pulled down the price of Litecoin below the $65 handle touching a low of 63.08 in the European trading session today.
The selling pressure continues and we are expecting more downsides in the levels of Litecoin towards the levels of $60 and $55 this week.
We can clearly see a double top pattern below the $73 handle which is a bearish pattern signifying the end of a bullish phase and the start of a bearish phase.
Litecoin is now trading below its 100 hourly simple moving averages and 200 hourly exponential moving averages. The price of LTCUSD is just below its pivot level of 64.43.
The relative strength index is at 18 indicating OVERSOLD markets, and the possibility of a pullback action this week.
The prices of Litecoin continue to remain below ALL of the moving averages, which are now giving a STRONG SELL signal at current market levels of 63.80.
The Williams percent range and commodity channel index are indicating an oversold level, which means that the prices are expected to correct upwards soon.
The short-Term outlook for Litecoin has turned strongly BEARISH.
We can see the formation of a consolidation pattern in Litecoin above the $62 handle which is expected to stabilize the downfall.
The price of LTCUSD is now facing its classic support level of 59.26 and Fibonacci support level of 63.21, after which the path towards $55 will get cleared.
The daily RSI is printing at 35 which is indicating a bearish market and the continuation of the downwards trend.
LTC has declined 8.29% with a price change of -5.76$ in the past 24hrs, and has a trading volume of 0.565 billion USD.
Litecoin’s trading volume has increased by 5.05% compared to yesterday which appears to be normal.
The Week Ahead
This week, we are looking at the support level of $54 and the shift towards the consolidation channel above the $60 handle. If the price remains above these levels, we may see some bullish moves in the next week.
The short-term outlook for Litecoin has turned strongly BEARISH; the medium-term outlook is BEARISH; and the long-term outlook is NEUTRAL at present market conditions.
This week, we are looking at levels of $55 to $60, and next week, Litecoin is expected to consolidate at levels above $60.
Technical Indicators:
The relative strength index (14 days): at 19 indicating an oversold market
The moving averages convergence divergence (12,26): at -1.142 indicating a SELL
The rate of price change: at -6.598 indicating a SELL
The ultimate oscillator: at 38.14 indicating a SELL
Gold price started a fresh increase from the $1,810 level. Crude oil price is rising and might gain pace above the $113.75 resistance.
· Gold price started a decent increase after it formed a base above $1,810 against the US Dollar.
· There is a key bullish trend line forming with support near $1,845 on the hourly chart of gold.
· Crude oil price gained pace after it broke the $108 and $110 resistance levels.
· There is a major bullish trend line forming with support near $111.10 on the hourly chart of XTI/USD.
Gold price formed a base above the $1,800 and $1,810 levels against the US Dollar. The price started a fresh increase after it broke the $1,825 resistance zone.
There was a clear move above the $1,840 level and the 50 hourly simple moving average. The price even cleared the $1,850 level and traded as high as $1,869. Recently, there was a downside correction below $1,850, but the bulls protected $1,840.
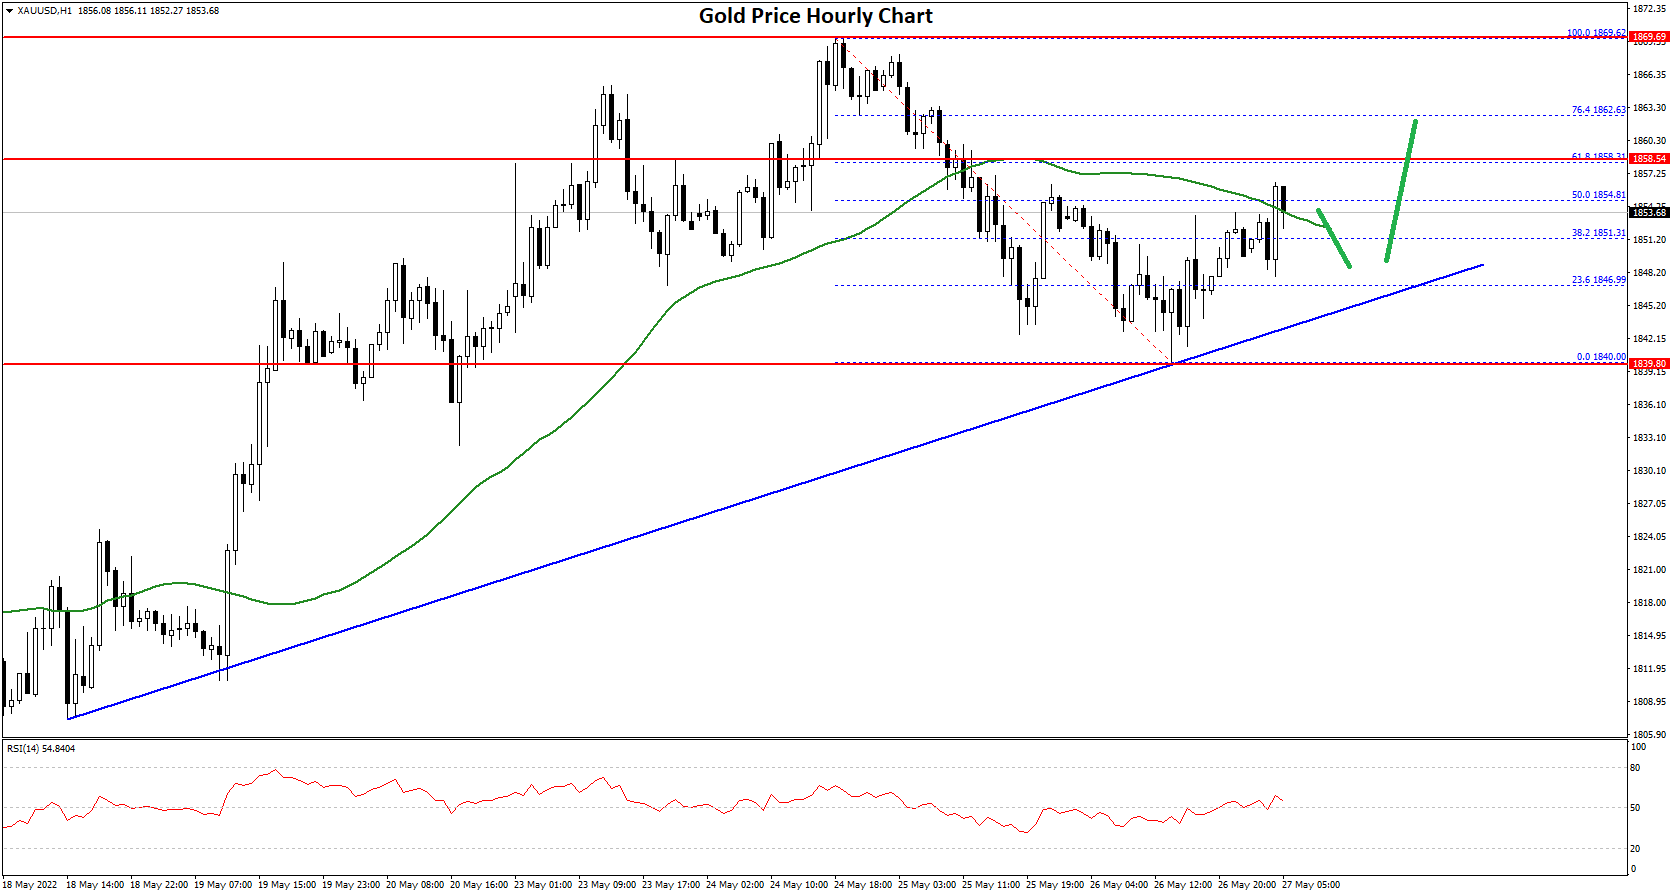
A low is formed near $1,840 and the price is now rising. There was a move above the 50% Fib retracement level of the downward move from the $1,869 swing high to $1,840 low.
On the upside, the price is facing resistance near the $1,858 level. It is near the 61.8% Fib retracement level of the downward move from the $1,869 swing high to $1,840 low. The main resistance is now forming near the $1,870 level.
A close above the $1,870 level could open the doors for a steady increase towards $1,880. The next major resistance sits near the $1,900 level.
On the downside, an initial support is near the $1,850 level. The next major support is near the $1,845 level. There is also a key bullish trend line forming with support near $1,845 on the hourly chart of gold, below which there is a risk of a larger decline.
Crude oil price formed a base above the $104 level against the US Dollar. The price started a major increase above the $106 and $108 resistance levels.
The price climbed above the $110 level and the 50 hourly simple moving average. The price was able to settle above the $111 level and traded as high as $113.75. It is now consolidating gains below the $113.75 level.
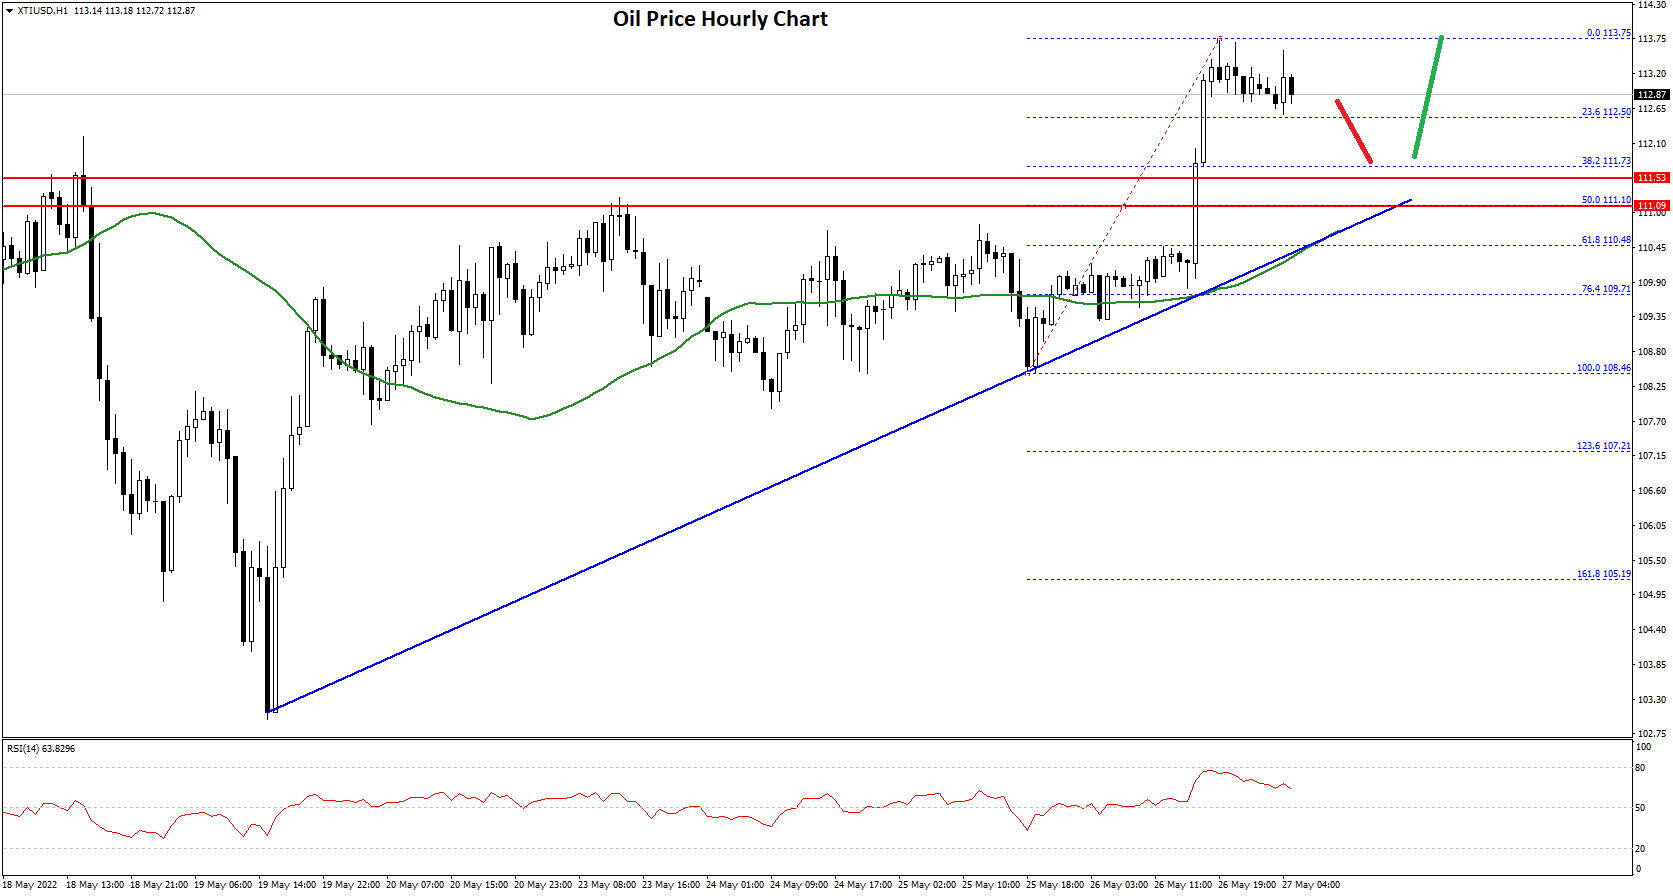
It tested the 23.6% Fib retracement level of the recent increase from the $108.46 swing low to $113.75 high. An immediate resistance is near the $113.20 level.
The next key resistance is near the $113.75 level, above which the price might accelerate higher towards $114.50 or even $115.00. On the downside, an immediate support is near the $112.50 level. The next major support is near the $11.75 level or the 50% Fib retracement level of the recent increase from the $108.46 swing low to $113.75 high. There is also a major bullish trend line forming with support near $111.10 on the hourly chart of XTI/USD.
If there is a downside break, the price might decline towards $110. Any more losses may perhaps open the doors for a move towards the $108 support zone in the coming sessions.
GBP/USD started a decent increase above the 1.2550 resistance. EUR/GBP is struggling to clear the 0.8500 and 0.8520 resistance levels.
· The British Pound started a decent increase above 1.2550 against the US Dollar.
· There was a break above a key contracting triangle with resistance near 1.2640 on the hourly chart of GBP/USD.
· EUR/GBP is holding the 0.8480 support but struggling above 0.8500.
· There was a break above a major bearish trend line with resistance near 0.8500 on the hourly chart.
The British Pound remained well bid above the 1.2400 zone against the US Dollar. The GBP/USD pair started a decent increase after it broke the 1.2500 resistance.
There was a clear move above the 1.2550 level and the 50 hourly simple moving average. The bulls were even able to clear the 1.2600 resistance. Recently, there was a break above a key contracting triangle with resistance near 1.2640 on the hourly chart of GBP/USD.
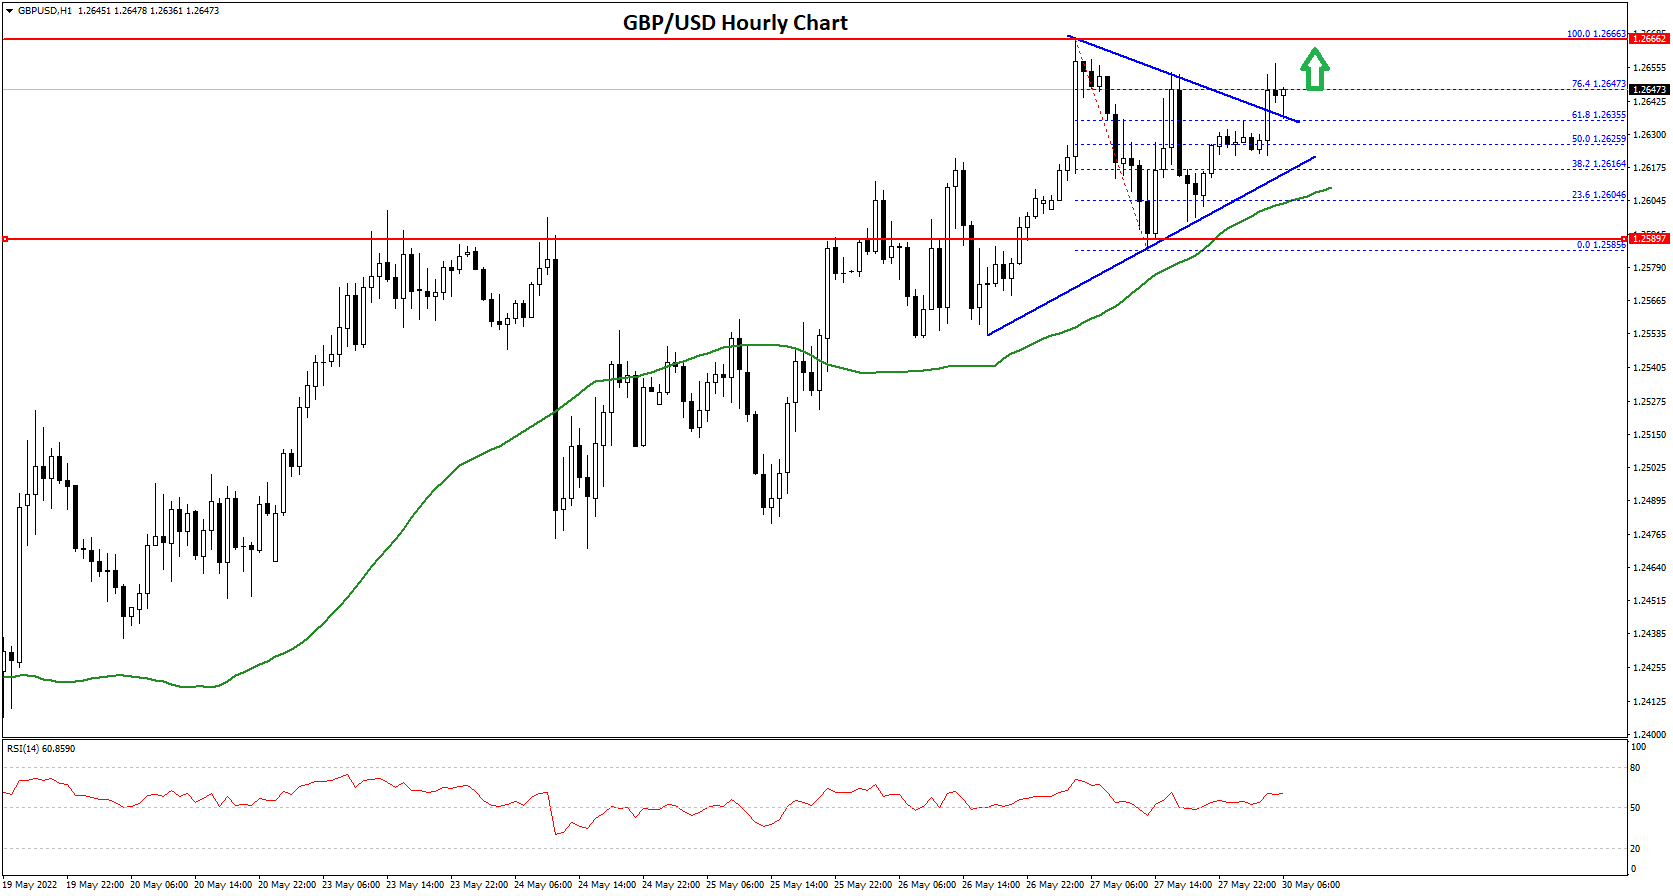
The pair traded as high as 1.2663 and is currently consolidating above the 50% Fib retracement level of the recent decline from the 1.2663 swing high to 1.2585 low.
On the upside, an initial resistance is near the 1.2650 level. It is near the 76.4% Fib retracement level of the recent decline from the 1.2663 swing high to 1.2585 low. The next main resistance is near the 1.2665 zone.
A clear upside break above the 1.2665 and 1.2680 resistance levels could open the doors for a steady increase in the near term. The next major resistance sits near the 1.2750 level.
If not, the pair might start a downside correction below 1.2620. The next major support is near the 1.2600 level. Any more losses could lead the pair towards the 1.2550 support zone or even 1.2520.
The Euro struggled to continue higher above the 0.8580 level against the British Pound. The EUR/GBP pair started a fresh decline and traded below the 0.8520 support.
The pair even traded below the 0.8500 level and the 50 hourly simple moving average. It traded as low as 0.8480 and is currently attempting an upside break. There was a move above the 23.6% Fib retracement level of the recent decline from the 0.8528 high to 0.8480 low.
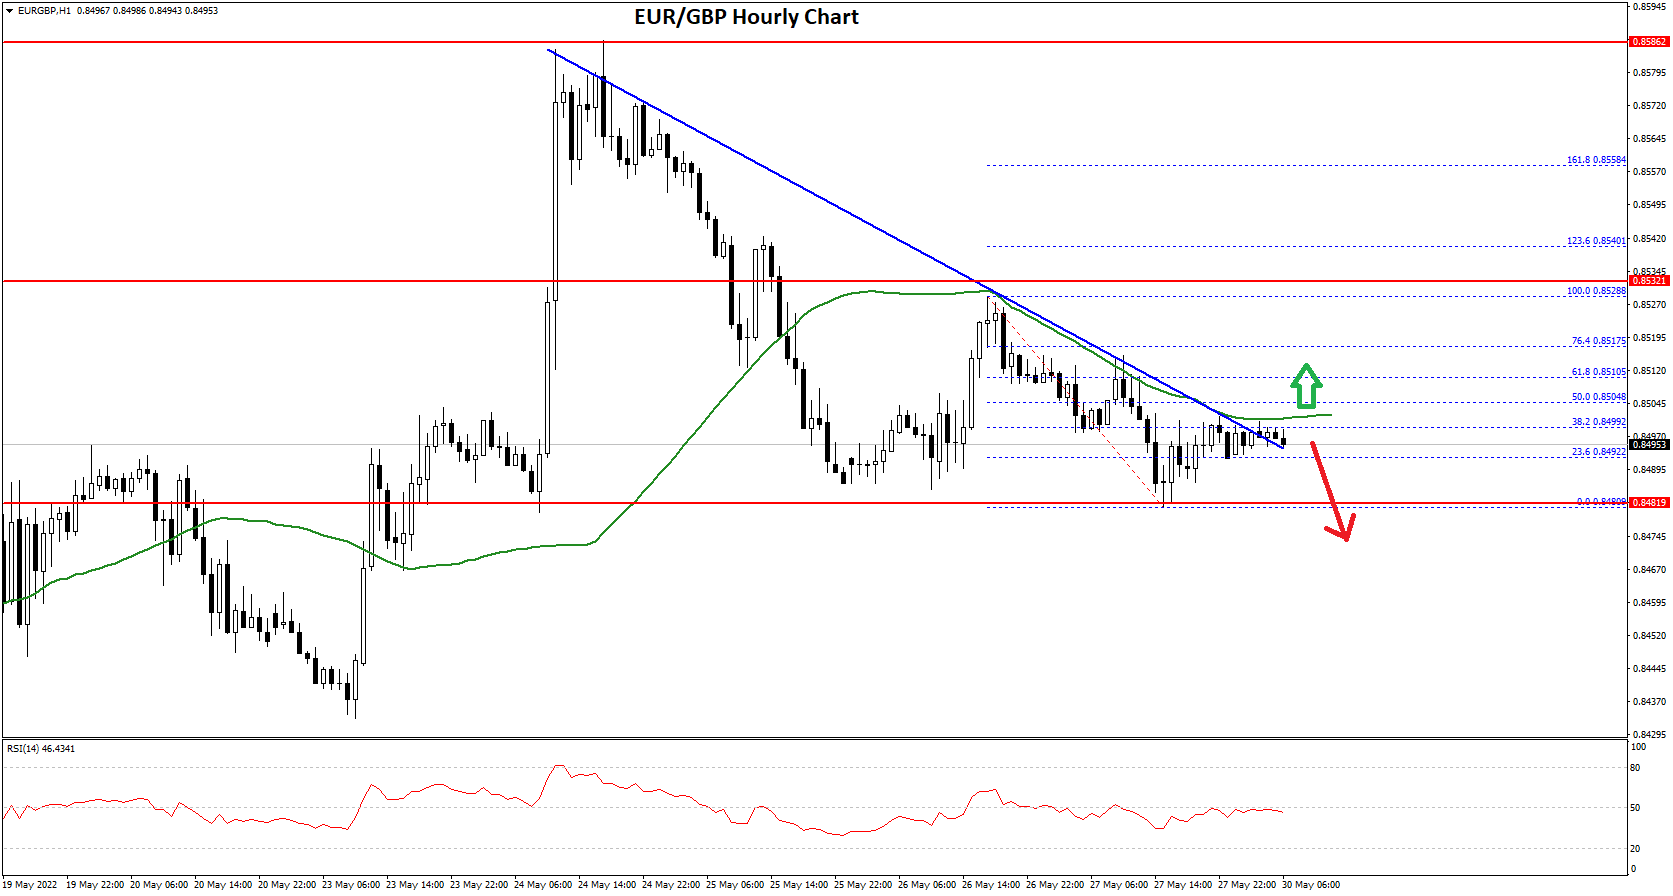
Besides, there was a break above a major bearish trend line with resistance near 0.8500 on the hourly chart. The pair is now facing resistance near the 0.8500 level and the 50 hourly simple moving average.
The next major resistance for the bulls is near the 0.8505 level. It is near the 50% Fib retracement level of the recent decline from the 0.8528 high to 0.8480 low. A clear move above the 0.8505 resistance might push the price higher.
The next main resistance on the upside is near the 0.8520 level, above which the pair could even climb towards 0.8550. On the downside, an initial support is near the 0.8480 level. The next major support is near 0.8450
A downside break below the 0.8450 support might call for more downsides. In the stated case, the pair could decline towards the 0.8400 support level in the near term.
Bitcoin was not able to sustain its bearish momentum this week, and after touching a low of 28,009 on 26th May, started to move upwards due to the formation of demand zones above these levels.
Bitcoin entered into a consolidation channel above the $28,000 handle and then corrected upwards touching a high of 32,192 in the European trading session today.
The global investor sentiment has improved from last week, leading to fresh buying by the long-term investors and now we are looking at levels of $32,500 and $35,000.
We can clearly see a bullish pennant pattern above the $28,000 handle which is a bullish reversal pattern because it signifies the end of a downtrend and a shift towards an uptrend.
Both the STOCH and Williams percent range are indicating an overbought level which means that in the immediate short term, a decline in the prices is expected.
The relative strength index is at 68 indicating a STRONG demand for bitcoin at the current market levels.
Bitcoin is now moving above its 100 hourly simple and 200 hourly simple MAs.
ALL of the major technical indicators are giving a STRONG BUY signal, which means that in the immediate short term, we are expecting targets of 32,000 and 33,500.
The average true range is indicating LESS market volatility with a strongly bullish momentum.
Bitcoin: Bullish Reversal Seen Above $28,000
Bitcoin continues to move into a consolidation channel above the $31,500 handle in the European trading session today.
We can see the formation of a rising trend channel above the $28,000 handle, and now we are looking at the projected levels of $33,000 and $35,000.
The immediate short-term outlook for bitcoin is strongly bullish; the medium-term outlook has turned bullish; and the long-term outlook remains neutral under present market conditions.
Bitcoin continues to consolidate above its important support level of $31,000 and with increasing demand zone formation the immediate target is $32,500
The price of BTCUSD is now facing its classic resistance level of 31,614 and Fibonacci resistance level of 31,653, after which the path towards 32,000 will get cleared.
In the last 24hrs, BTCUSD has increased by 3.05% with a price change of $937, and has a 24hr trading volume of USD 37.468 billion. We can see an Increase of 39.80% in the trading volume as compared to yesterday, which is due to the fresh buying seen at lower levels.
The Week Ahead
The price of bitcoin is moving in a strongly bullish momentum, and the immediate targets are $32,000 and $33,500.
The daily RSI is printing at 50 which means that the medium range demand continues to be NEUTRAL.
We are now looking at a fresh rally into the markets with targets of $33,500 and $35,000 next week.
The prices of BTCUSD will need to remain above the important support levels of $31,000 this week.
The weekly outlook is projected at $33,500 with a consolidation zone of $32,000.
Technical Indicators:
The moving averages convergence divergence (12,26): at 390 indicating a BUY
The average directional change (14 days): at 45.56 indicating a BUY
The rate of price change: at 3.12 indicating a BUY
The commodity channel index (14 days): at 45.18 indicating a NEUTRAL level
Ripple was unable to sustain its bearish momentum last week and after touching a low of 0.3762 on 27th May started to correct upwards due to the formation of a demand zone above 0.4000.
We can see the formation of a fresh demand zone above the 0.4100 handle in the European trading session today.
We can clearly see a bullish engulfing pattern above the 0.3750 handle which signifies the end of a downtrend and a shift towards an uptrend.
The short-term outlook for Ripple has turned strongly bullish; the medium-term outlook is bullish; and the long-term outlook is neutral under present market conditions.
The relative strength index is at 66 which signifies a STRONG demand for Ripple at the current market prices and the continuation of an uptrend this week.
All of the moving averages are giving a STRONG BUY signal at the current market levels of 0.4202.
Ripple is now trading above its pivot level of 0.4168 and facing its classic resistance level of 0.4192 and Fibonacci resistance level of 0.4204 after which the path towards 0.4500 will get cleared.
ALL of the major technical indicators are giving a STRONG BUY signal.
Ripple: Bullish Reversal seen Above 0.3750
We can see a fresh wave of consolidation in Ripple above the 0.4100 handle which further validates that the medium-term uptrend is in focus.
We can see the formation of a white morning star in the hourly chart, and the formation of a bullish harami pattern in the 4-hour chart confirming that now we are looking at the immediate targets of 0.4350 and 0.4500.
We are moving into a consolidation pattern below the 0.4200 level after which a fresh upside wave is expected.
We can see that XRP touched a low of 0.4069 in the Asian trading session and an intraday high of 0.4340 in the European trading session today.
The price of XRPUSD has increased by 5.56% with a price change of $0.02258 in the past 24hrs, and has a trading volume of 1.681 billion USD.
We can see a 63.86% increase in the trading volume of Ripple as compared to yesterday, which is due to buying at lower levels.
The Week Ahead
The price of XRPUSD is now moving in a consolidation channel above the 0.4100 handle, and next visible targets are 0.4250 and 0.4350.
Ripple is now entering into a bullish zone formation and this is expected to continue next week.
Next week also, Ripple is expected to enter a consolidation channel above the 0.4250 handle.
The weekly outlook for Ripple is projected at 0.4450 with a consolidation zone of 0.4300.
Technical Indicators:
The average directional change (14 days): at 37.17 indicating a BUY
The Williams percent range: at -32.15 indicating a BUY
Bull/Bear power (13 days): at 0.0240 indicating a BUY
The commodity channel index: at 106.14 indicating a BUY
EUR/USD struggled near 1.0785 and corrected lower. USD/JPY is rising and might continue to gain pace towards the 130.20 resistance
· The Euro started a downside correction after it failed to surpass 1.0785.
· There is a key bearish trend line forming with resistance near 1.0725 on the hourly chart of EUR/USD.
· USD/JPY gained pace after it broke the 127.50 resistance zone.
· It surpassed a major bearish trend line with resistance near 127.55 on the hourly chart.
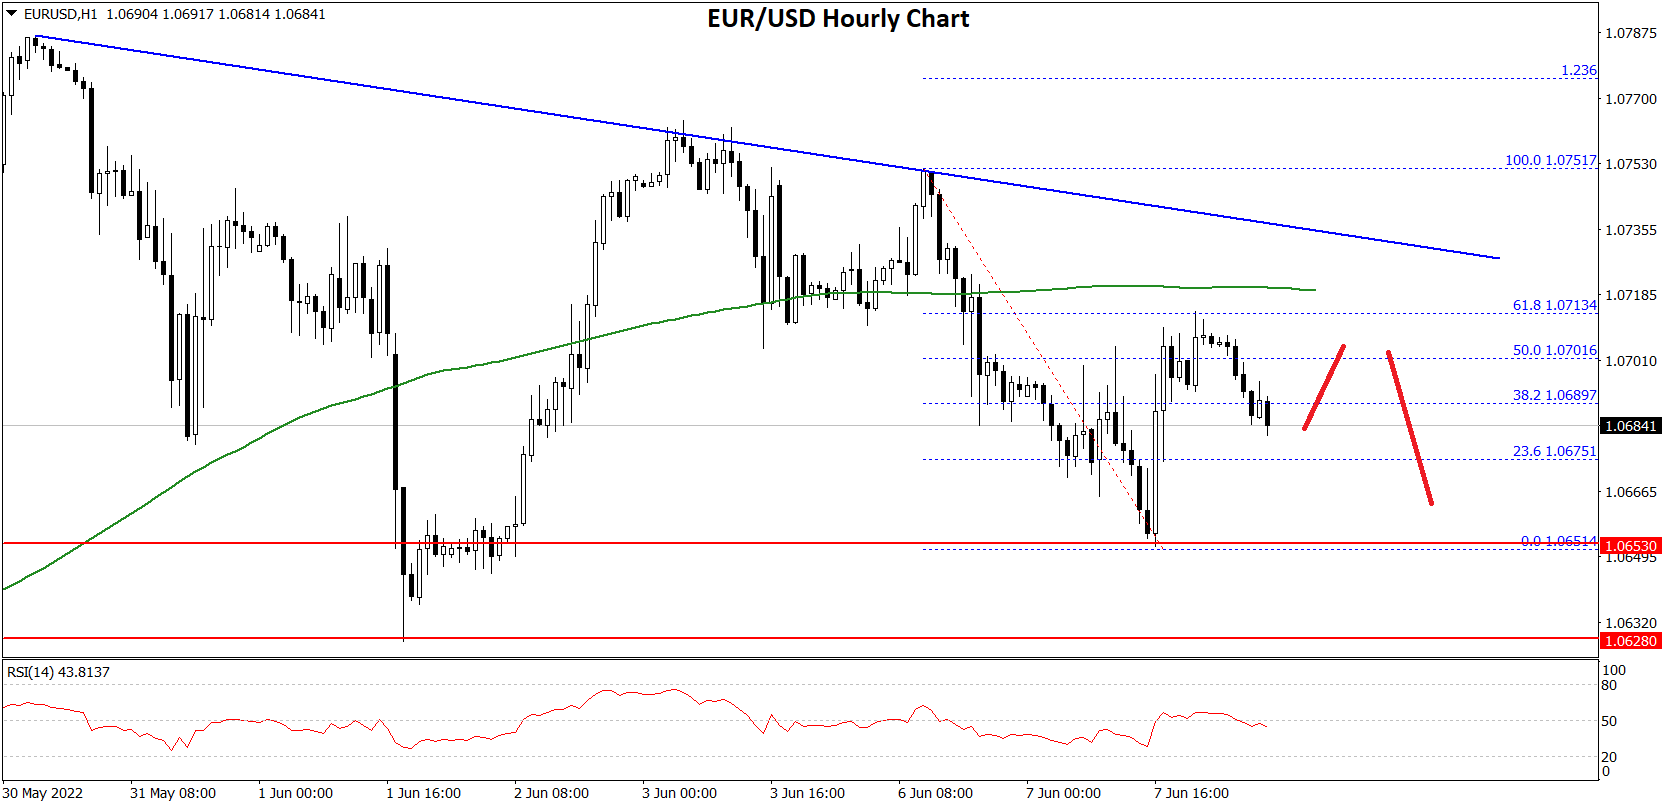
This past week, the Euro started a decent recovery wave above the 1.0680 level against the US Dollar. The EUR/USD pair cleared the 1.0720 and 1.0740 resistance levels.
However, the pair faced sellers near the 1.0785 level. A high was formed near 1.0786 and EUR/USD started a downside correction. There was a move below the 1.0740 support and the 50 hourly simple moving average.
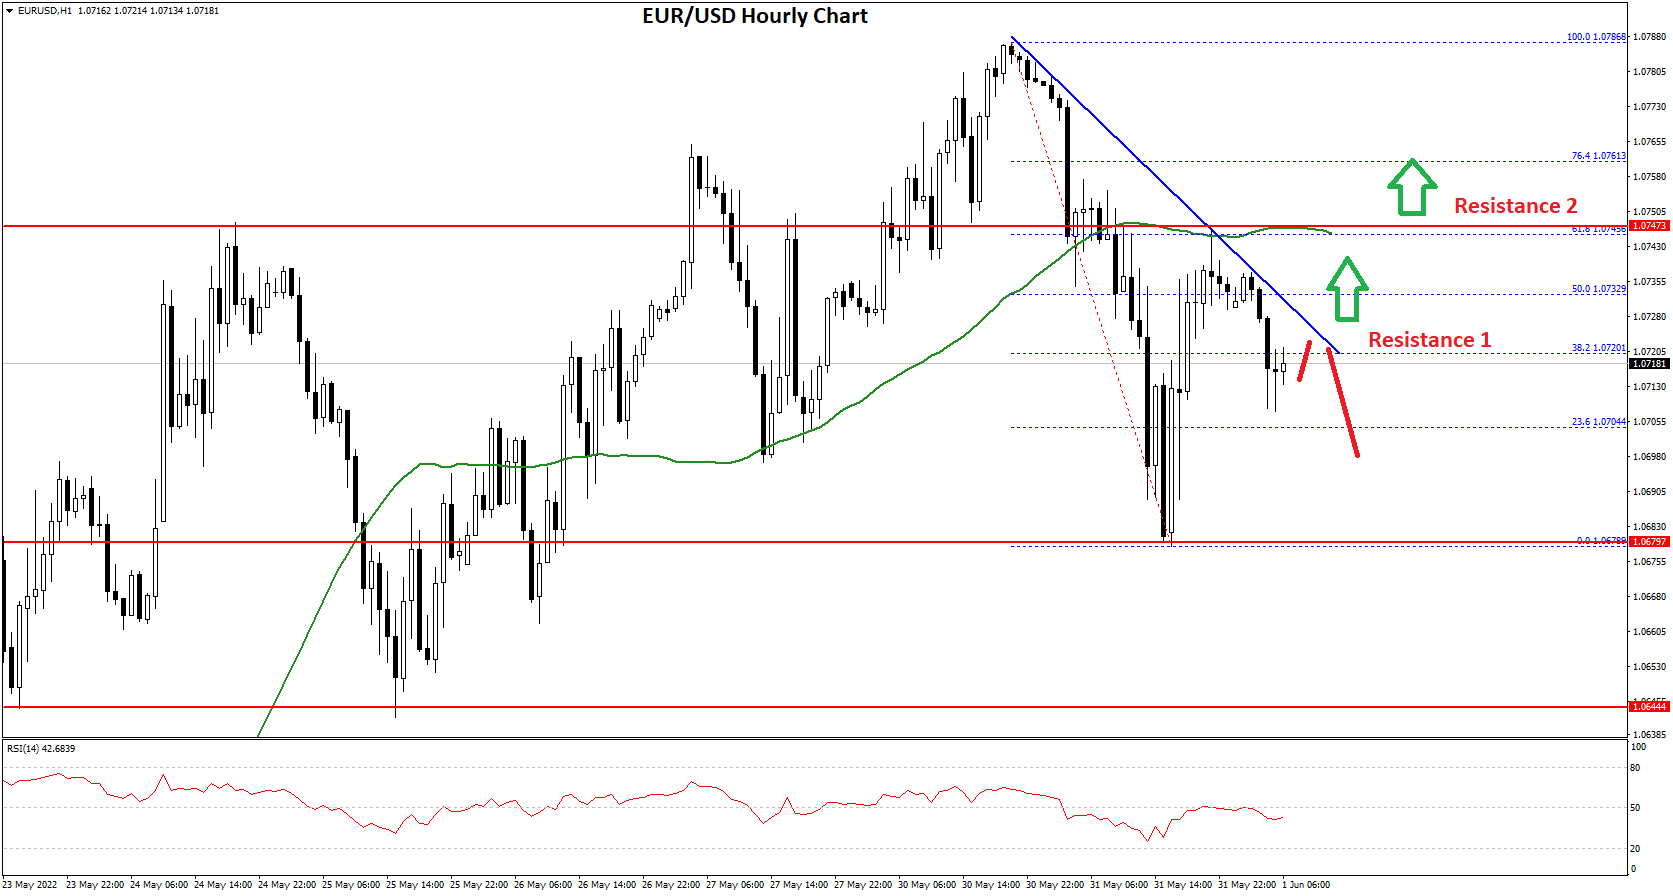
EUR/USD Hourly Chart
A low was formed near 1.0679 and the pair is now correcting higher. There was a move above the 1.0700 resistance level. It even spiked above the 50% Fib retracement level of the downward move from the 1.0786 swing high to 1.0679 low.
However, the pair failed to gain pace above the 1.0740 level. It failed near the 61.8% Fib retracement level of the downward move from the 1.0786 swing high to 1.0679 low.
There is also a key bearish trend line forming with resistance near 1.0725 on the hourly chart of EUR/USD. It is now moving lower and trading below 1.0710. An immediate resistance on the upside is near the 1.0725 level.
The next major resistance is near the 1.0740 level. The main resistance is near the 1.0785 level. An upside break above 1.0785 could set the pace for a steady increase.
If not, the pair might drop and test the 1.0675 support. The next major support is near 1.0650, below which the pair could drop to 1.0580 in the near term.
The US Dollar started a downside correction from the 131.35 resistance zone against the Japanese Yen. The USD/JPY pair traded below the 130.00 support zone.
It traded as low as 126.35 before the bulls emerged. The pair started a fresh increase above the 127.50 resistance and the 50 hourly simple moving average. There was a break above a major bearish trend line with resistance near 127.55 on the hourly chart.
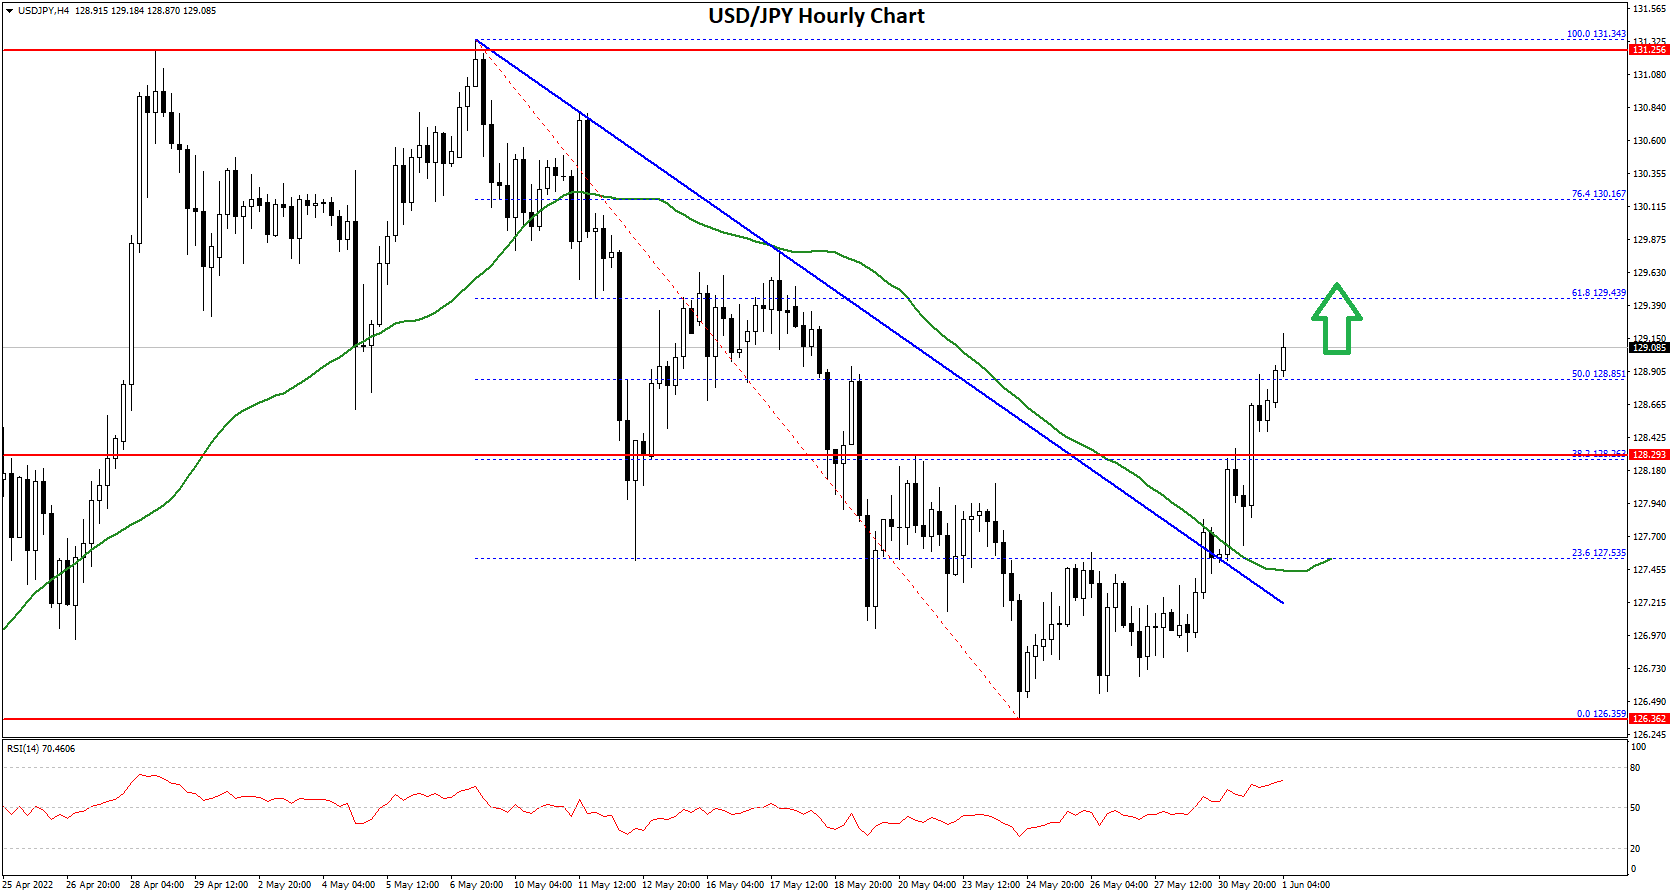
USD/JPY Hourly Chart
The pair traded above the 50% Fib retracement level of the downward move from the 131.34 swing high to 126.35 low. On the upside, an initial resistance is near the 129.40 level.
The 61.8% Fib retracement level of the downward move from the 131.34 swing high to 126.35 low is also near the 129.43 level. The next major resistance is near the 130.00. Any more gains could send the pair towards the 131.35 level. The next key hurdle is near the 132.00 level.
An initial support on the downside is near the 128.50 level. The next major support is near the 128.20 level. Any more downsides might lead the pair towards the 126.50 support zone, below which the bears might aim a test of the 125.40 support zone.
Ethereum was unable to sustain its bullish momentum last week and after touching a high of 2011 on 31st May started to decline heavily against the US Dollar.
We can see a strong bearish momentum this week and this is putting downwards pressure on the prices of Ethereum below the 1850 handle in the European Trading session today.
We can see the formation of a Major bearish trend line today on the hourly chart and the pair is poised to decline further given the weak investor sentiments.
The prices touched an Intraday Low of $1794 in the Asian trading session and an Intraday High of $1843 in the European Trading session today.
We can clearly see a Bearish Engulfing Pattern Below the $2015 handle which is a Bearish pattern and signifies the end of a Bullish phase and the start of a Bearish phase in the markets.
ETH is now trading just above its Pivot levels of 1817 and is moving into a Strong bearish channel. The price of ETHUSD is now testing its Classic support levels of 1767 and Fibonacci support levels of 1805 after which the path towards 1700 will get cleared.
Relative Strength Index is at 40 indicating a WEAK market and the continuation of the decline after the consolidation phase gets over.
The STOCHRSI is indicating Oversold levels which means that the prices are due to correct upwards in the short-term range.
ALL of the of the Technical indicators are giving a STRONG SELL market Signal.
All of the Moving Averages are giving a STRONG SELL Signal and we are now looking at the levels of $1700 to $1600 in the short-term range.
ETH is now trading Below its both the 100 Hourly and Exponential Moving Averages.
Ether Bearish Continuation Seen Below $2015
ETHUSD is now moving into a Strong Bearish channel with the prices trading below the $1850 handle in the European Trading session today.
We can see the formation of a Major Bearish trend line in the hourly chart which suggests that further decline in the prices of Ethereum are expected.
The prices of Ethereum are moving into a consolidation channel now and after the consolidation phase is over a further decline in its levels is expected.
The key resistance levels to watch are $1919 and $2046 and the prices of ETHUSD need to cross these levels for a potential Bullish reversal.
ETH has declined by 5.80% with a price change of 112$ in the past 24hrs and has a trading volume of 21.678 Billion USD.
We can see an Increase of 22.75% in the total trading volume in last 24 hrs. which is due to the continuation of the selling pressure across the global markets.
The Week Ahead
The global investor sentiments are weak and they are not willing to enter into the markets now, which is the main reason for the continuous fall in the prices of the Ethereum.
The delay in the implementation of the ETH 2.0 upgrade continues to affect the prices of Ethereum in the short-term range.
The immediate short-term outlook for the Ether has turned as Strongly BEARISH, the medium-term outlook has turned BEARISH, and the long-term outlook for Ether is NEUTRAL in present market conditions.
In this week Ether is expected to move in a range between the $1600 and $1800 and in the next week Ether is expected to enter into a Consolidation phase above the $1800 levels.
Technical Indicators:
Williams Percent Range: It is at -78.90 indicating a SELL.
Moving Averages Convergence Divergence (12,26): It is at -16.00 indicating a SELL.
Ultimate Oscillator: It is at 40.51 indicating a SELL.
Rate of Price Change: It is at -4.16 indicating a SELL.
Litecoin was unable to sustain its bullish momentum last week and after touching a high of 70.02 on 01st June started to decline heavily against the US Dollar.
The ongoing bearish momentum pulled down the prices of Litecoin below the $64 handle touching a low of 62.07 in the European Trading session today.
The selling pressure continues and we are expecting more downsides in the levels of Litecoin towards the levels of $60 and $55 in this week.
We can clearly see a Bearish Piercing Pattern below the $70 handle which is a Bearish pattern and signifies the end of a Bullish phase and the start of a Bearish phase.
Litecoin is now trading Below its 100 hourly Simple moving averages and 200 hourly Exponential moving averages. The price of LTCUSD is just below its Pivot levels of 64.43
Relative Strength Index is at 40 indicating a WEAK market, and the continuation of the selling pressure this week.
The prices of Litecoin continue to remain Below ALL of the Moving Averages, which are now giving a STRONG SELL Signal at current market levels of 63.50
The Williams Percent Range and STOCHRSI are indicating Oversold levels, which means that the prices are expected to correct upwards soon.
The Short-Term outlook for the Litecoin has turned Strong BEARISH.
Litecoin Bearish Continuation Below $70
We can see the formation of a consolidation pattern in Litecoin above the $62 handle which is expected to stabilize the downfall.
The price of LTCUSD is now facing its Classic support levels of 60.70 and Fibonacci support levels of 62.20 after which the path towards $55 will get cleared.
The Daily RSI is printing at 38 which is indicating a Bearish market and the continuation of the downwards trend.
LTC has declined 4.75% with a price change of -6.97$ in the past 24hrs and has a trading volume of 0.671 Billion USD.
Litecoin trading volume has increased by 5.24% as compared to yesterday which appears to be Normal.
The Week Ahead
In this week we are looking at the support levels of $60 and the shift towards the consolidation channel above the $62 handle.
If the prices remain above these levels, we can see some bullish moves in the next week.
The short-term outlook for Litecoin has turned as Strong BEARISH, the medium-term outlook is BEARISH, and the long-term outlook is NEUTRAL at present market conditions.
In this week we are looking at levels of $60 to $65 and in the next week Litecoin is expected to consolidate at levels above $65.
Technical Indicators:
Relative Strength Index(14days): It is at 40 indicating a SELL.
Moving Averages Convergence Divergence (12,26): It is at -0.710 indicating a SELL.
Rate of Price Change: It is at -3.78 indicating a SELL.
Ultimate Oscillator: It is at 41.11 indicating a SELL.
AUD/USD extended increase above the 0.7200 resistance. NZD/USD is also showing a lot of positive signs above the 0.6500 level.
· The Aussie Dollar started a fresh increase from the 0.7150 support zone against the US Dollar.
· There was a break above a short-term contracting triangle with resistance near 0.7162 on the hourly chart of AUD/USD.
· NZD/USD also started a decent increase after it cleared the 0.6500 resistance zone.
· There was a move above a major bearish trend line with resistance near 0.6520 on the hourly chart of NZD/USD.
The Aussie Dollar formed a base above the 0.7150 level and started a fresh increase against the US Dollar. The AUD/USD pair gained pace for a move above the 0.7185 resistance zone.
There was a break above a short-term contracting triangle with resistance near 0.7162 on the hourly chart of AUD/USD. The pair even settled above the 0.7240 level and the 50 hourly simple moving average.
AUD/USD Hourly Chart
It traded as high as 0.7282 on FXOpen and is currently correcting gains. There was a move below the 0.7270 support zone.
However, the pair is still above the 23.6% Fib retracement level of the upward move from the 0.7140 swing low to 0.7282 high. On the downside, an initial support is near the 0.7250 level.
The next support could be the 0.7230 level. The main support is near the 0.7210 level and the 50 hourly simple moving average. It is close to the 50% Fib retracement level of the upward move from the 0.7140 swing low to 0.7282 high.
If there is a downside break below the 0.7210 support, the pair could extend its decline towards the 0.7150 level. Any more downsides might send the pair toward the 0.7080 level.
On the upside, the AUD/USD pair is facing resistance near the 0.7280 level. The next major resistance is near the 0.7320 level. A close above the 0.7320 level could start a steady increase in the near term. The next major resistance could be 0.7450.
The New Zealand Dollar also followed a similar path from the 0.6460 zone against the US Dollar. The NZD/USD pair gained pace above the 0.6500 resistance zone.
There was a clear move above the 0.6540 resistance zone and the 50 hourly simple moving average. Besides, there was a move above a major bearish trend line with resistance near 0.6520 on the hourly chart of NZD/USD.
NZD/USD Hourly Chart
It even spiked above the 0.6570 level and traded as high as 0.6575. It is now correcting gains and trading close to the 23.6% Fib retracement level of the upward move from the 0.6460 swing low to 0.6575 high.
On the downside, an initial support is near the 0.6540 level. The next support could be the 0.6520 zone. It is near the 50% Fib retracement level of the upward move from the 0.6460 swing low to 0.6575 high. If there is a downside break below the 0.6520 support, the pair could extend its decline towards the 0.6160 level.
On the upside, an initial resistance is near the 0.6575 level. The next major resistance is near the 0.6600 level. A clear move above the 0.6600 level might even push the pair towards the 0.6650 level.
GBP/USD started a fresh decline below the 1.2560 support. USD/CAD is also moving lower and might extend losses below the 1.2550 support.
· The British Pound started a fresh decline from the 1.2655 resistance zone.
· There is a major bearish trend line forming with resistance near 1.2540 on the hourly chart of GBP/USD.
· USD/CAD also started a fresh increase from well below the 1.2800 zone.
· There is a key bearish trend line forming with resistance near 1.2610 on the hourly chart.
After struggling to clear the 1.2655 resistance zone, the British Pound found started a fresh decline against the US Dollar. GBP/USD traded below the 1.2550 support level to move into a bearish zone.
The bears gained strength for a move below the 1.2500 level and the 50 hourly simple moving average. The pair even spiked below the 1.2480 level and traded as low as 1.2477 on FXOpen. The pair is now consolidating losses above the 1.2480 level.
GBP/USD Hourly Chart
An immediate resistance is near the 1.2505 level. It is near the 23.6% Fib retracement level of the downward move from the 1.2589 swing high to 1.2477 low.
The next key resistance is near the 1.2535 level. It is near the 50% Fib retracement level of the downward move from the 1.2589 swing high to 1.2477 low. There is also a major bearish trend line forming with resistance near 1.2540 on the hourly chart of GBP/USD.
If there is an upside break above the 1.2540 zone, the pair could rise towards 1.2600. The next key resistance could be 1.2655, above which the pair could gain strength.
On the downside, an initial support is near the 1.2475 area. The first major support is near the 1.2450 level. If there is a break below 1.2450, the pair could extend its decline. The next key support is near the 1.2400 level. Any more losses might call for a test of the 1.2320 support.
The US Dollar started a fresh decline from the 1.2840 zone against the Canadian Dollar. USD/CAD gained pace for a move below the 1.2700 support zone.
The pair settled below the 1.2650 level and the 50 hourly simple moving average. A low is formed near 1.2551 and the pair is now recovering losses. There was a move above the 1.2580 level. The pair climbed above the 23.6% Fib retracement level of the downward move from the 1.2685 swing high to 1.2551 low.
USD/CAD Hourly Chart
On the upside, the pair is facing resistance near 1.2600 or the 38.2% Fib retracement level of the downward move from the 1.2685 swing high to 1.2551 low.
The next major resistance is near the 1.2610 level. There is also a key bearish trend line forming with resistance near 1.2610 on the hourly chart. A clear break above the 1.2610 level could open the doors for more gains. The next major resistance is near the 1.2650 level.
An immediate support is near the 1.2565 level. The first major support is near the 1.2550 level. Any more losses may possibly open the doors for a drop towards the 1.2480 support.
Bitcoin was not able to sustain its bullish momentum this week and after touching a high of 31,730 on 06th June, started to decline against the US dollar.
Bitcoin entered into a bearish trend channel below the $31,750 handle and continues to decline touching a low of 29,217 in the European trading session today.
We can see a weak demand for bitcoin in the medium-term range, and the prices are expected to fall further towards the $25,000 level.
We can clearly see a bearish doji star pattern below the $31,750 handle which is a bearish reversal pattern because it signifies the end of an uptrend and a shift towards a downtrend.
Both the Stoch and Williams percent range are indicating an overbought level which means that in the immediate short term a decline in the prices is expected.
The relative strength index is at 29 indicating a WEAK demand for Bitcoin at the current market levels.
Bitcoin is now moving below its 100 hourly and 200 hourly simple MAs.
All of the major technical Indicators are giving a STRONG SELL signal, which means that in the immediate short term we are expecting targets of 28,000 and 27,500.
The average true range is indicating LESS market volatility with a strong bearish momentum.
Bitcoin: Bearish Reversal Seen Below $31,750
Bitcoin continues to move into a consolidation channel above the $29,500 handle in the European trading session today.
We can see the formation of a falling trend channel below the $30,000 handle and now we are looking at the projected levels of $28,000 and $25,000.
The immediate short-term outlook for bitcoin is strongly bearish; the medium-term outlook has turned bearish; and the long-term outlook remains neutral under present market conditions.
Bitcoin continues to consolidate above its important support level of $29,000 and further decline in its price is expected in the US trading session.
The price of BTCUSD is now facing its classic support level of 29,361 and Fibonacci support level of 29,571 after which the path towards 28,000 will get cleared.
In the last 24hrs, BTCUSD has declined by 5.64% with a price change of 17,71$ and has a 24hr trading volume of USD 35.441 billion. We can see an Increase of 31.14 % in the trading volume as compared to yesterday, which is due to selling by the medium-term investors.
The Week Ahead
The price of bitcoin is moving in a strongly bearish momentum, and the immediate targets are $28,000 and $27,500.
The daily RSI is printing at 44 which means that the medium-range demand continues to be NEUTRAL.
The price of bitcoin is moving in an uncertain range-bound movement between the $28,000 and $32,000 over the past few weeks. We will have to wait till a clear trend is visible in the medium-term range.
The prices of BTCUSD will need to remain above the important support level of $29,000 this week.
The weekly outlook is projected at $29,500 with a consolidation zone of $28,000.
Technical Indicators:
Moving averages convergence divergence (12,26): at -344 indicating a SELL
The ultimate oscillator: at 44.88 indicating a SELL
The rate of price change: at -5.92 indicating a SELL
The commodity channel index (14 days): at -52.34 indicating a SELL
Ripple was unable to sustain its bullish momentum last week and after touching a high of 0.4089 on 06th June started to decline against the US dollar.
We can see that the price of Ripple continues to remain under pressure, now trading below the 0.4000 handle in the European trading session today.
We can clearly see a double top pattern below the 0.4090 handle which signifies the end of an uptrend and a shift towards a downtrend.
The short-term outlook for Ripple has turned strongly bearish; the medium-term outlook is neutral; and the long-term outlook is neutral under present market conditions.
The relative strength index is at 38 which signifies a WEAK demand for Ripple at the current market prices and the continuation of the downtrend this week.
All of the moving averages are giving a STRONG SELL signal at the current market level of 0.3903.
Ripple is now trading below its pivot level of 0.3906 and facing its classic support level of 0.3855 and Fibonacci support level of 0.3894 after which the path towards 0.3500 will get cleared.
ALL of the major technical indicators are giving a STRONG SELL signal.
Ripple: Bearish Reversal Seen Below 0.4090
We can see that the price of Ripple has entered into a consolidation channel above the 0.3850 handle in the European trading session today.
We can see that the price is struggling to retain the bullish bias against the US dollar. If the selling pressure continues, the immediate support level will be broken leading to the 0.3500 handle.
We can see that XRP touched a low of 0.3848 in the Asian trading session and an intraday high of 0.4035 in the European trading session today.
The price of XRPUSD has declined by 3.99% with a price change of $0.01623 in the past 24hrs and has a trading volume of 1.366 billion USD.
We can see an increase of 31.63% in the trading volume of Ripple as compared to yesterday, which is due to selling by the medium-term investors.
This Week Ahead
The price of XRPUSD is now moving into a consolidation channel above the 0.3800 handle and the next visible targets are 0.3750 and 0.3500.
We can see that the support channel has been broken in the 15 minutes time frame, and now more downsides are visible next week. Next week, Ripple is expected to enter into a fresh wave of selling below the 0.3800 handle.
The weekly outlook for Ripple is projected at 0.3700 with a consolidation zone of 0.3500.
Technical Indicators:
The StochRSI (14 days): at 41.19 indicating a SELL
The Williams percent range: at -70.56 indicating a SELL
Bull/Bear power (13 days): at -0.005 indicating a SELL
The commodity channel index: at -54.10 indicating a SELL
EUR/USD is slowly moving lower below 1.0750. USD/CHF is rising and might accelerate further higher above 0.9720 resistance zone.
· The Euro failed to gain pace for a move above the 1.0780 resistance zone against the US Dollar.
· There is a major bearish trend line forming with resistance near 1.0720 on the hourly chart of EUR/USD.
· USD/CHF gained pace and was able to clear the 0.9700 resistance zone.
· There is a key bullish trend line forming with support near 0.9730 on the hourly chart.
The Euro gained pace above the 1.0700 resistance zone against the US Dollar. The EUR/USD pair climbed above the 1.0720 resistance zone to move into a bullish zone.
The pair attempted a clear move above the 1.0750 resistance, but the bears remained active. The recent high was formed near 1.0751 before the pair started a fresh decline. The price declined below the 1.0700 level and traded as low as 1.0651 on FXOpen.
EUR/USD Hourly Chart
There was a recovery wave above the 1.0680 level. It cleared the 50% Fib retracement level of the recent decline from the 1.0751 swing high to 1.0651 low.
However, the pair faced sellers near the 1.0710 level and the 50 hourly simple moving average. Besides, there is a major bearish trend line forming with resistance near 1.0720 on the hourly chart of EUR/USD. The 61.8% Fib retracement level of the recent decline from the 1.0751 swing high to 1.0651 low is also acting as a resistance.
The next major resistance is near the 1.0750 level. A clear move above the 1.0750 resistance zone could set the pace for a larger increase towards 1.0850. The next major resistance is near the 1.0920 zone.
On the downside, an immediate support is near the 1.0650 level. The next major support is near the 1.0620 level. A downside break below the 1.0620 support could start another decline.
The US Dollar formed a base above the 0.9550 level against the Swiss franc. The USD/CHF pair started a major increase above the 0.9600 and 0.9650 resistance levels.
The upward move gained pace above the 0.9700 level and the 50 hourly simple moving average. A high is formed near 0.9778 and the pair is now consolidating gains. It corrected lower and tested the 0.9730 support zone.
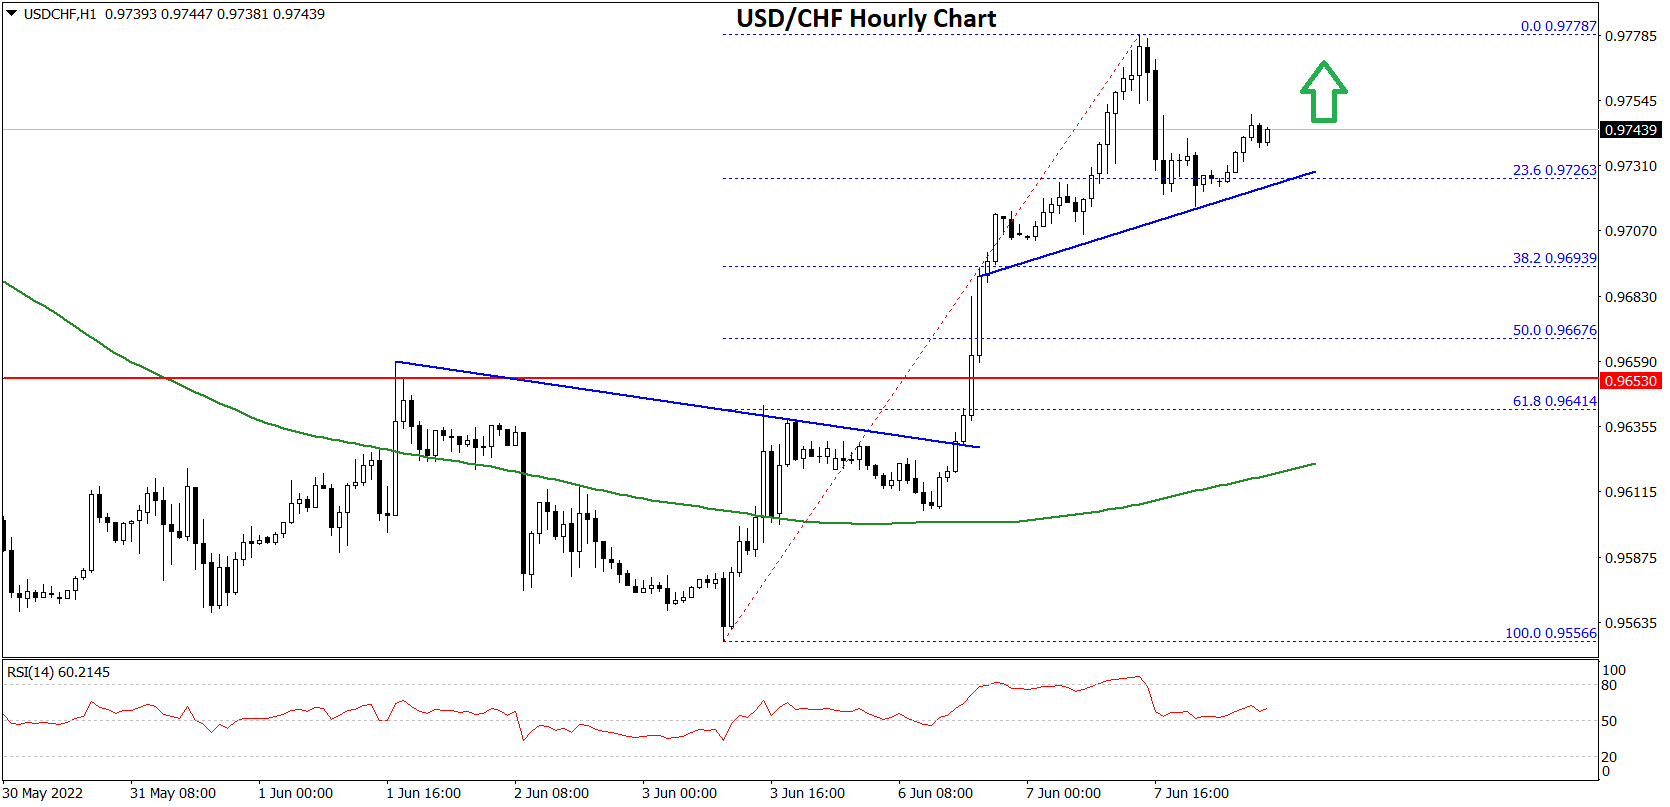
USD/CHF Hourly Chart
There is also a key bullish trend line forming with support near 0.9730 on the hourly chart. The trend line is close to the 23.6% Fib retracement level of the upward move from the 0.9556 swing low to 0.9778 high.
If the bears remain in action, the pair could decline towards the 0.9700 support. The main support is now forming near the 0.9670 level. It is near the 50% Fib retracement level of the upward move from the 0.9556 swing low to 0.9778 high.
Any more losses may possibly open the doors for a move towards the 0.9600 level, where the bulls might take a stand.
On the upside, the pair is now facing resistance near the 0.9750 level. The next major resistance is near the 0.9780 level. If there is a clear break above the 0.9780 resistance zone, the pair could start another increase.
Ethereum was unable to sustain its bearish momentum this week and after touching a low of 1,725 on 07th June started to correct upwards against the US dollar.
We can see a strong pullback action in the markets which is keeping the prices of Ethereum above the $1,800 handle in the European trading session today.
We can see the formation of a bullish ascending channel above the $1,800 handle, and now we are looking at $1,900 and $2,050 as the immediate targets.
The prices touched an intraday low of $1,777 in the Asian trading session, and an intraday high of $1,821 in the European trading session today.
We can clearly see a double bottom pattern above the $1,725 handle which is a bullish pattern and signifies the end of a bearish phase and the start of a bullish phase in the markets.
ETH is now trading just above its pivot level of 1,814 and moving in a strongly bullish channel. The price of ETHUSD is now testing its classic resistance level of 1,820 and Fibonacci resistance level of 1,825, after which the path towards 1,900 will get cleared.
The relative strength index is at 58 indicating a strong market and the continuation of the uptrend this week.
The StochRSI and Williams percent range are indicating an oversold level which means that the price is due to correct upwards in the short-term range.
All of the technical indicators are giving a strong buy market signal. All of the moving averages are giving a strong buy signal, and we are now looking at the levels of $1,900 to $2,000 in the short-term range.
ETH is now trading above the 100 hourly and exponential MAs.
Ether: Bullish Reversal Seen Above $1,725
ETHUSD is moving in a strongly bullish channel with the prices trading above the $1,800 handle in the European trading session today.
We can see the formation of a bullish harami cross pattern in the 15-minute time frame indicating the potential bullish nature of the present markets.
The prices of Ethereum may continue to move upwards against the US dollar, as the medium-term investors are coming back into the markets.
The key resistance levels to watch are $1,907 and $2,077, and the price of ETHUSD needs to cross these levels for the continuation of the bullish reversal.
ETH has declined by 0.90% with a price change of 16$ in the past 24hrs and has a trading volume of 13.881 billion USD.
We can see a decrease of 37.41% in the total trading volume in the last 24 hrs which is due to the uncertain nature of the global markets.
The Week Ahead
The global investor sentiments have improved leading to a pullback action in the markets, and now we are looking at $1,900 and $2,050 as the immediate targets.
The immediate short-term outlook for Ether has turned strongly bullish, the medium-term outlook has turned NEUTRAL, and the long-term outlook for Ether is neutral in present market conditions.
This week, Ether is expected to move in a range between $1,800 and $2,000, and next week, it is expected to enter into a consolidation phase above $2,000.
Technical Indicators:
STOCH (9,6): at 65.83 indicating a BUY
The moving averages convergence divergence (12,26): at 3.66 indicating a BUY
The ultimate oscillator: at 68.27 indicating a BUY
The rate of price change: at 1.82 indicating a BUY
Litecoin was unable to sustain its bearish momentum last week and after touching a low of 60.13 on 07th June started to move upwards against the US dollar.
We can see some pullback action in the markets at levels above $60, and now we are looking at $65 and $70 as the immediate targets.
We can clearly see a double-bottom pattern above the $60 handle which is a bullish pattern and signifies the end of a bearish phase and the start of a bullish phase.
Litecoin is now trading Below its 100 hourly simple and 200 hourly exponential moving averages. The price of LTCUSD is just above its pivot level of 62.10.
The relative strength index is at 55 indicating a strong market, and the continuation of the buying pressure this week.
The price of Litecoin continues to remain above all of the MAs, which are now giving a BUY Signal at current market levels of 62.10.
The Williams percent range and STOCHRSI are indicating an overbought level, which means that the prices are expected to decline in the short-term range.
The short-term outlook for Litecoin has turned strongly bullish.
Litecoin: Bullish Reversal Seen Above $60
We can see that the price of Litecoin is now moving in a consolidation channel above $62 and more upsides are projected this week.
We can see the formation of SMA5 and EMA5 crossover patterns located at 61.86 and 62.09 indicating a potential bullish reversal in the markets in the 5-hour time frame.
The price of LTCUSD is now facing its classic resistance level of 62.50 and Fibonacci resistance level of 62.70 after which the path towards $65 will get cleared.
The daily RSI is printing at 39 which is indicating a bearish market and the continuation of the downwards trend.
LTC has increased by 0.24% with a price change of 0.1469$ in the past 24hrs, and has a trading volume of 0.469 billion USD.
Litecoin’s trading volume has decreased by 25.56% compared to yesterday which appears to be normal.
The Week Ahead
This week, we are looking at the continuation of the consolidation channel above the $62 handle. If the prices remain above this level, we may see some bullish moves next week.
The short-term outlook for Litecoin has turned bullish, the medium-term outlook is neutral, and the long-term outlook is neutral at present market conditions.
This week, we are looking at levels of $60 to $65, and next week, Litecoin is expected to consolidate at levels above $65.
Technical Indicators:
The relative strength index (14 days): at 54 indicating a NEUTRAL level
The average directional change (14 days): at 35 indicating a BUY
The rate of price change: at 0.646 indicating a BUY
The ultimate oscillator: at 62.18 indicating a BUY
Gold price is struggling to clear the $1,855 resistance zone. Crude oil price is rising and might continue to gain pace above the $120.00 resistance.
· Gold price struggled above $1,860 and corrected lower against the US Dollar.
· There was a break below a key bullish trend line with support near $1,850 on the hourly chart of gold.
· Crude oil price gained pace after it broke the $118 and $120 resistance levels.
· There is a major bullish trend line forming with support near $118.50 on the hourly chart of XTI/USD.
Gold price formed a base above the $1,830 and $1,835 levels against the US Dollar. The price started a fresh increase after it broke the $1,840 resistance zone.
There was a clear move above the $1,850 level and the 50 hourly simple moving average. The price even cleared the $1,855 level and traded as high as $1,859 on FXOpen. Recently, there was a downside correction below $1,855.
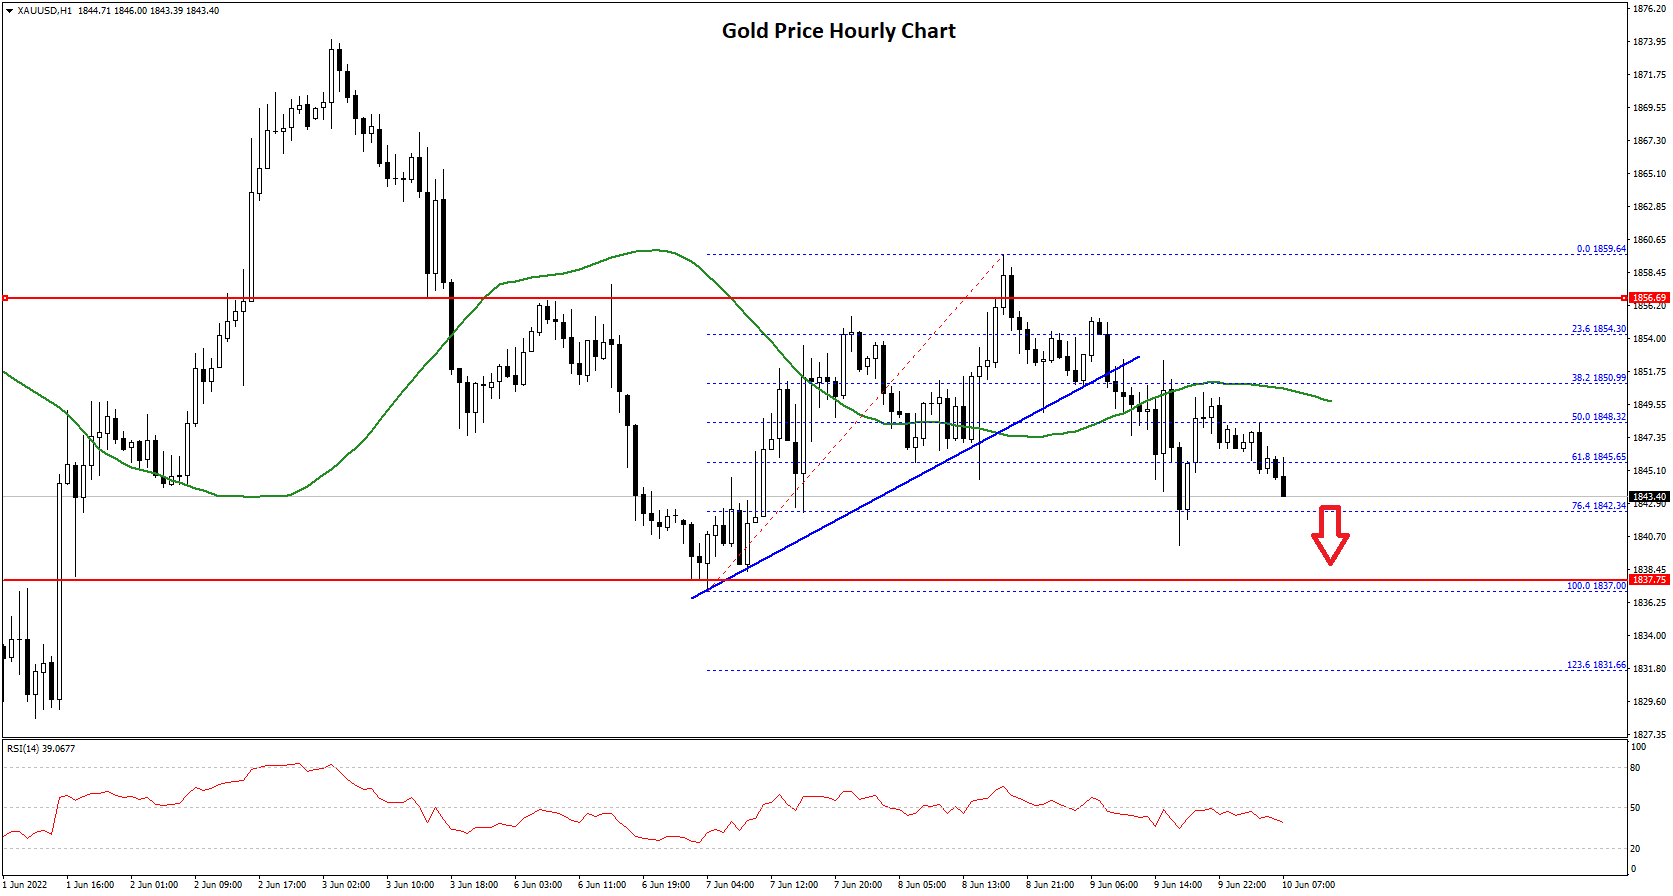
Gold Price Hourly Chart
The price declined below the 50% Fib retracement level of the upward move from the $1,837 swing low to $1,859 high. There was also a break below a key bullish trend line with support near $1,850 on the hourly chart of gold.
The price also tested the 76.4% Fib retracement level of the upward move from the $1,837 swing low to $1,859 high. On the downside, an initial support is near the $1,840 level.
The next major support is near the $1,835 level, below which there is a risk of a larger decline. In the stated case, the price could decline sharply towards the $1,810 support zone. On the upside, the price is facing resistance near the $1,850 level.
The main resistance is now forming near the $1,860 level. A close above the $1,860 level could open the doors for a steady increase towards $1,875. The next major resistance sits near the $1,888 level.
Crude oil price formed a base above the $112 level against the US Dollar. The price started a major increase above the $116 and $118 resistance levels.
The price climbed above the $120 level and the 50 hourly simple moving average. The price traded as high as $121.31 and is currently correcting gains. It traded below the 38.2% Fib retracement level of the recent increase from the $115.67 swing low to $121.31 high.
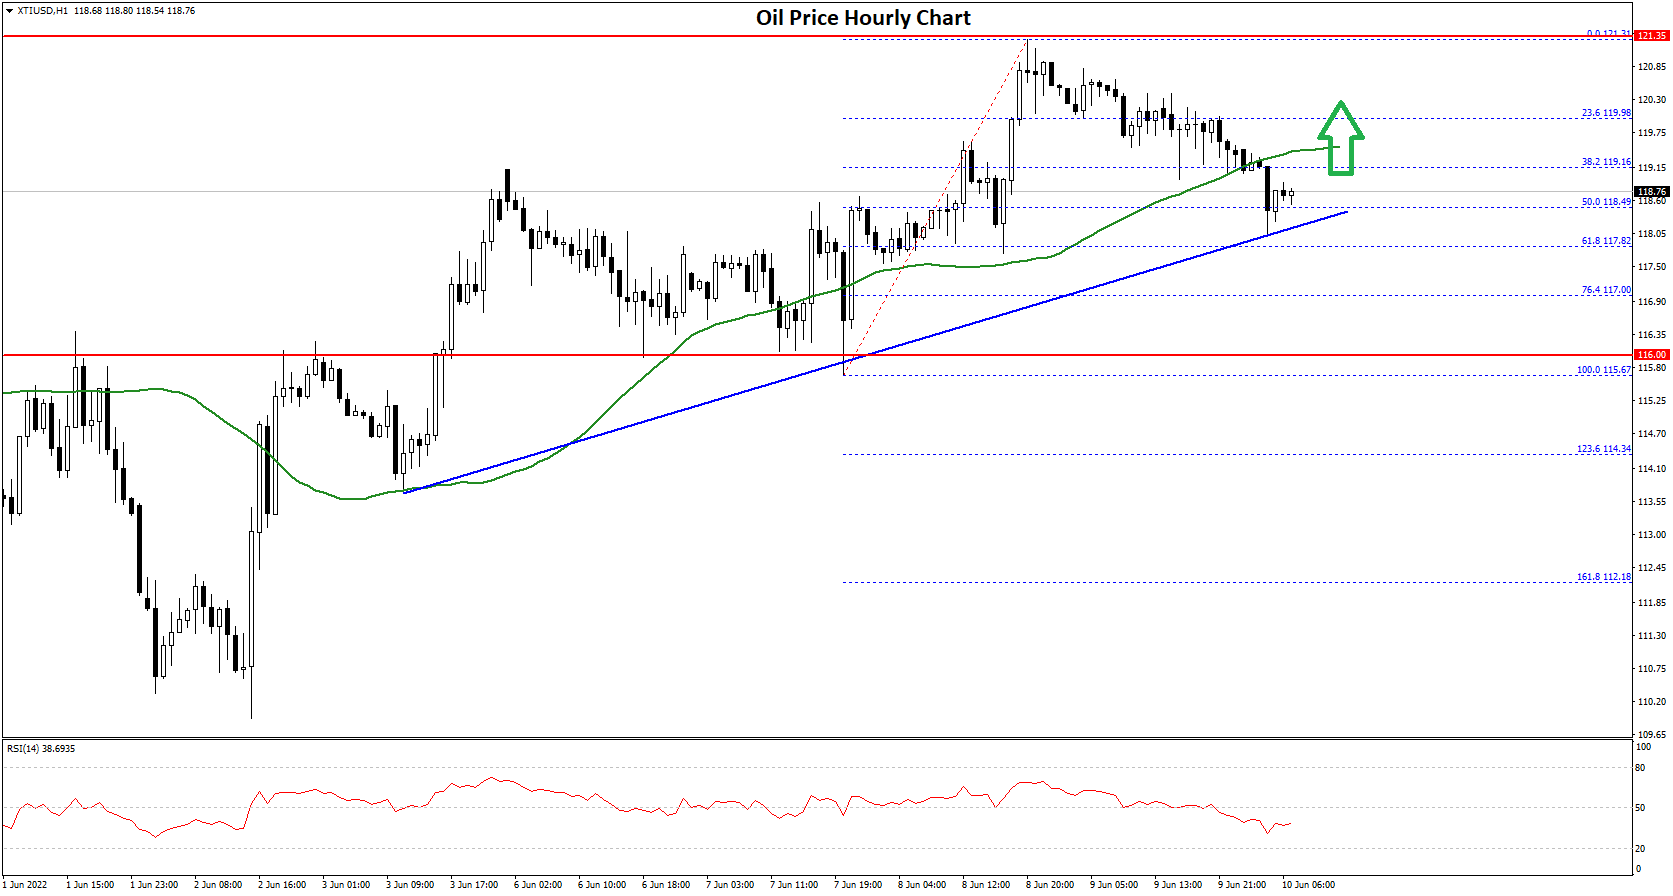
Oil Price Hourly Chart
On the downside, an immediate support is near the $118.50 level. There is also a major bullish trend line forming with support near $118.50 on the hourly chart of XTI/USD.
The trend line is close to the 50% Fib retracement level of the recent increase from the $115.67 swing low to $121.31 high. The next major support is near the $117.00 level. If there is a downside break, the price might decline towards $115.
Any more losses may perhaps open the doors for a move towards the $112 support zone in the coming sessions. On the upside, an immediate resistance is near the $119.80 level.
The next key resistance is near the $120.00 level, above which the price might accelerate higher towards $121.50 or even $122.00.
GBP/USD started a fresh decline from the 1.2600 resistance zone. GBP/JPY is declining and remains at a risk of more losses below 165.00.
· The British Pound started a fresh decline after it failed near 1.2600 against the US Dollar.
· There was a break below a declining channel with support near 1.2465 on the hourly chart of GBP/USD.
· GBP/JPY is gaining bearish momentum below the key 166.50 support zone.
· There was a break below a major bullish trend line with support near 167.35 on the hourly chart.
This past week, the British Pound attempted an upside break above the 1.2600 resistance against the US Dollar. The GBP/USD pair failed to gain bullish momentum and started a fresh decline from the 1.2580 zone.
There was a sharp decline below the 1.2500 support and the 50 hourly simple moving average. Besides, there was a break below a declining channel with support near 1.2465 on the hourly chart of GBP/USD. The bears gained strength and the price declined below the 1.2350 support zone.
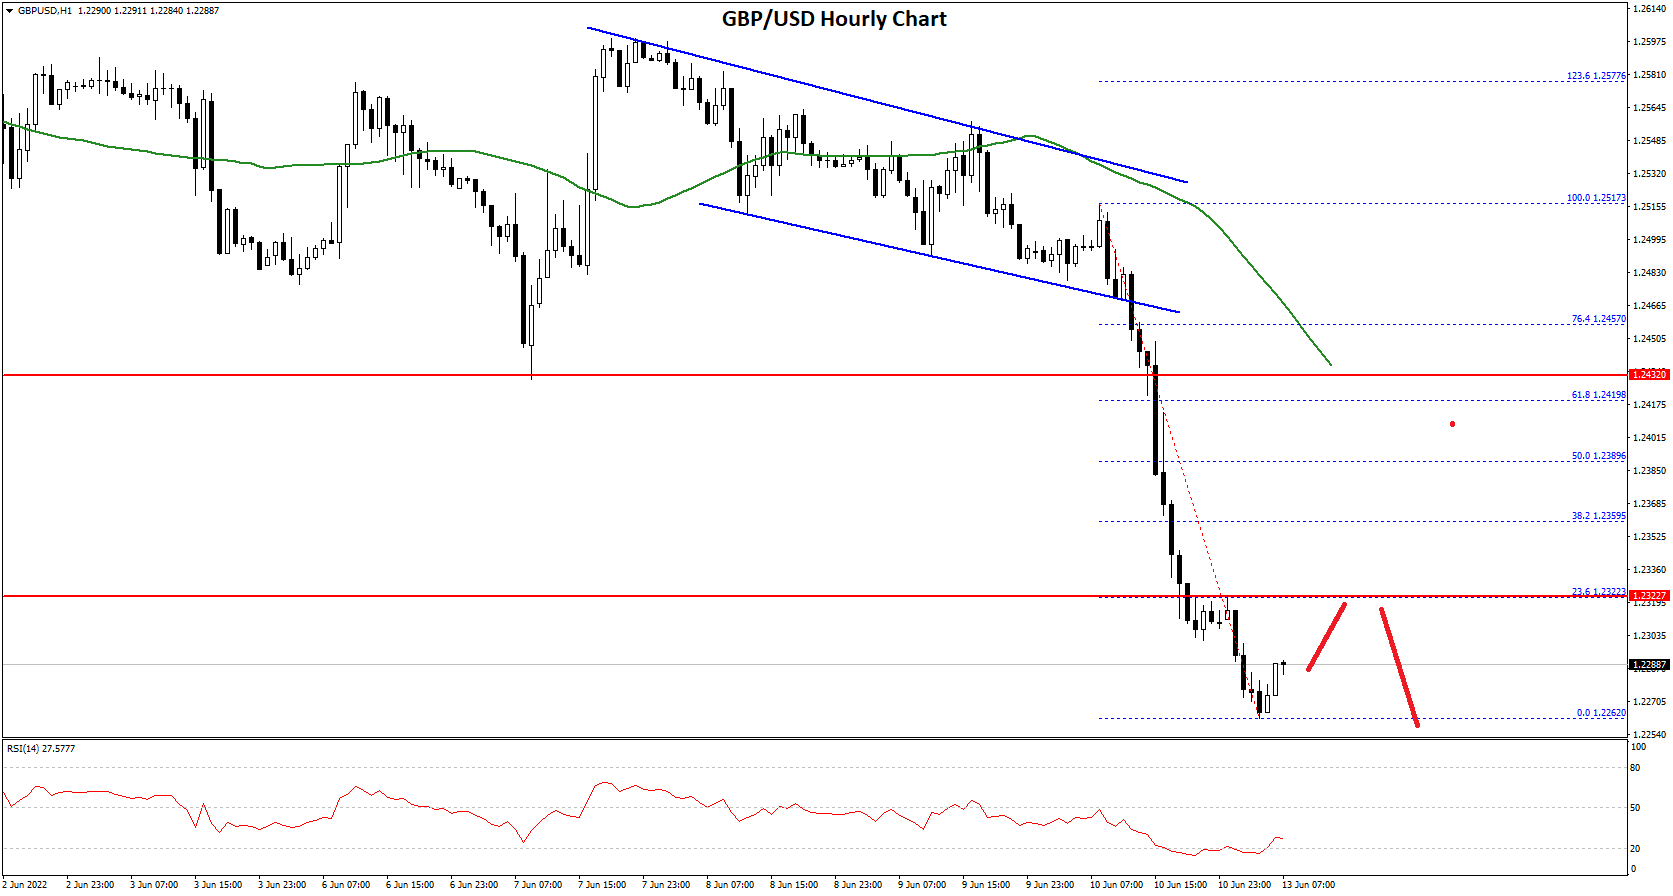
GBP/USD Hourly Chart
A low is formed near 1.2262 on FXOpen and the pair is now consolidating losses. On the upside, the pair is facing resistance near the 1.2300 level. The next major hurdle is near the 1.2320 level. It is close to the 23.6% Fib retracement level of the downward move from the 1.2517 swing high to 1.2262 low.
An upside break above 1.2320 could set the pace for a move towards the 1.2400 resistance zone. It is near the 50% Fib retracement level of the downward move from the 1.2517 swing high to 1.2262 low.
If there is no upside break above 1.2320, the pair could start a fresh decline. An immediate support is near the 1.2260. The next major support is near the 1.2220 level. If there is a break below the 1.2220 support, the pair could test the 1.2150 support.
The British Pound also started a fresh decline from the 168.70 zone against the Japanese Yen. The GBP/JPY pair gained pace below the 168.00 and 167.50 support levels.
There was a clear move below the 167.00 level and the 50 hourly simple moving average. Besides, there was a break below a major bullish trend line with support near 167.35 on the hourly chart. The pair even declined below the 50% Fib retracement level of the upward move from the 162.90 swing low to 168.71 high.
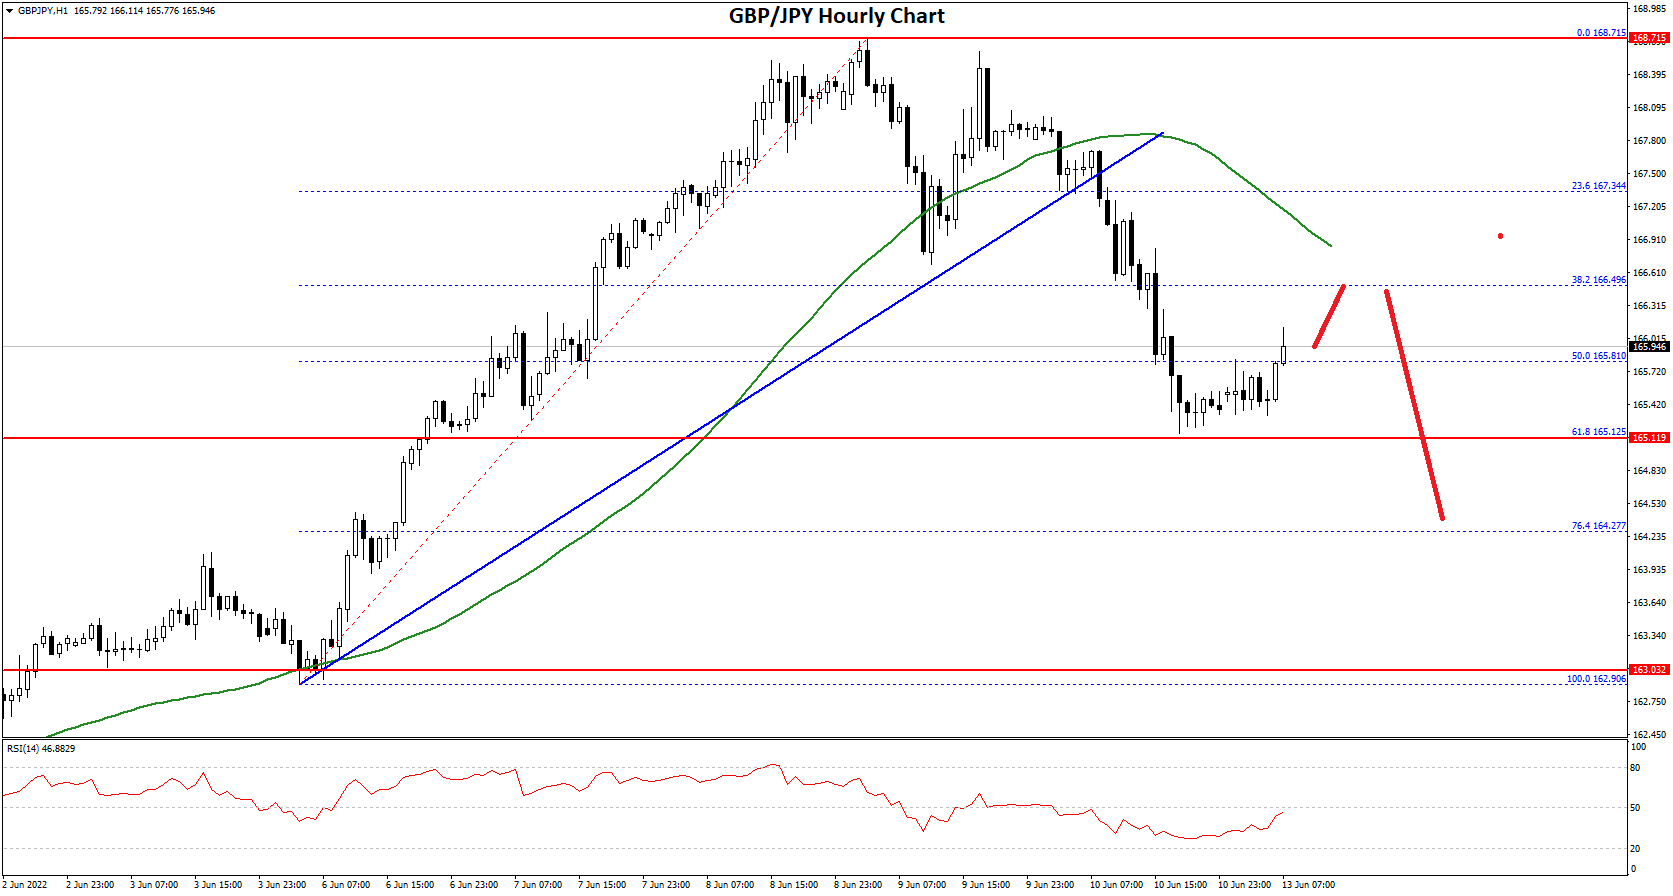
GBP/JPY Hourly Chart
It even declined below 165.50 and traded close to 165.00. There was a test of the 61.8% Fib retracement level of the upward move from the 162.90 swing low to 168.71 high.
On the upside, GBP/JPY is facing resistance near the 166.50 level. The next key resistance could be 167.00 and the 50 hourly simple moving average. A clear break above the 167.00 resistance could push the pair towards the 167.50 resistance.
On the downside, an initial support is near the 165.25 level. The next major support is near the 165.00. If there is a downside break below the 165.00 support, the pair could decline towards the 163.50 support zone. Any more losses might send the pair towards the 162.00 level in the near term.
Bitcoin continues its bearish momentum from last week and plunged below the $21000 handle touching a low of 20850 in the European Trading session today.
The global investor sentiments are weak and the continuation of the selling pressure across the global cryptocurrency exchanges is causing the massive slide in Bitcoin.
Bitcoin entered into a Major Bearish trend channel below the $28300 handle and continued to decline below the $21000 handle today, the lowest level seen in 2 years.
We can see a very weak demand for the Bitcoin in the medium-term range and the prices are expected to fall further towards the $20000 levels.
We can clearly see a Bearish Harami Pattern Below the $28300 handle which is a Bearish reversal pattern because it signifies the end of an Uptrend and a shift towards a Downtrend.
Both the STOCH and Williams Percent Range are indicating Overbought levels which means that in the immediate short term a decline in the prices is expected.
Relative Strength Index is at 40 indicating a WEAK demand for the Bitcoin at the current market levels.
Bitcoin is now moving Below its 100 hourly Simple Moving average and its 200 hourly Simple Moving averages.
All of the Major Technical Indicators are giving a SELL Signal, which means that in the immediate short term we are expecting targets of 21000 and 20500.
Average True Range is indicating LESS Market Volatility with a Strong Bearish Momentum.
The prices of Bitcoin nosedived below the $21000 handle today, after which we can see a move towards the consolidation channel above the $22000 handle in the European Trading session today.
We can see the formation of a Falling Trend channel below the $27900 handle and now we are looking at the projected levels of $21000 and $20000.
The immediate short-term outlook for Bitcoin is Strong Bearish, Medium-term outlook has turned as Bearish, and the long-term outlook remains Neutral under present market conditions.
Bitcoin continues to consolidate above its important support levels of $22000 and further decline in its prices is expected in the US Trading session.
The price of BTCUSD is now facing its Classic support levels of 21775 and Fibonacci support levels of 22293 after which the path towards 21000 will get cleared.
In the last 24hrs BTCUSD has declined by 7.49% by 1808$ and has a 24hr trading volume of USD 67.482 Billion. We can see an Increase of 18.28% in the Trading volume as compared to yesterday, which is due to the selling by the medium-term investors.
The prices of Bitcoin are moving in a Strong Bearish momentum and the immediate targets are $21000 and $20500
The Daily RSI is printing at 23 which means that the medium range demand continues to be WEAK.
We can see that the prices of Bitcoin have stabilized above the $22000 handle and now we are looking at the important support levels of $21000 and $21775.
The prices of BTCUSD will need to remain above the important support levels of $21000 this week.
Weekly outlook is projected at $21500 with a consolidation zone of $20500.
Moving Averages Convergence Divergence (12,26): It is at -694 indicating a SELL.
Ultimate Oscillator: It is at 44.05 indicating a SELL.
Rate of Price Change: It is at -4.05 indicating a SELL.
Commodity Channel Index(14days): It is at -10.55 indicating a NEUTRAL level.
Ripple continues its bearish momentum this week and its prices declined below the 0.3200 handle in the European Trading session today.
We can see that Ichimoku Cloud in the 30 minutes time frame, the prices are below the cloud indicating that the trend is down.
We can see that the prices of Ripple continue to remain under pressure, now trading below the 0.3200 handle in the European Trading session today.
We can clearly see a Bearish Engulfing Pattern Below the 0.4100 handle which signifies the end of an Uptrend and a shift towards a Downtrend.
The Short-term outlook for Ripple has turned as Strong Bearish, Medium-term outlook is Neutral, and the Long-Term outlook is Neutral under present market conditions.
Relative Strength Index is at 46 which signifies a WEAK demand for the Ripple at the current market prices and the continuation of the Downtrend this week.
All of the Moving Averages are giving a STRONG SELL Signal at the current market levels of 0.3134
Ripple is now trading Below its Pivot levels of 0.3144 and is now facing its Classic Support levels of 0.3041 and Fibonacci Support levels of 0.3120 after which the path towards 0.3000 will get cleared.
ALL of the Major Technical Indicators are giving a SELL Signal.
We can see that the prices of Ripple have entered into a consolidation channel above the 0.3000 handle in the European Trading session today.
We can see that the Adaptive Moving Average AMA50 is indicating a Bearish trend in the 15 minutes time frame.
We can see that XRP touched a Low of 0.2935 in the Asian Trading session and an Intraday High of 0.3224 in the European Trading session today.
The price of XRPUSD has declined by 0.32% with a price change of $0.001016 in the past 24hrs and has a trading volume of 2.437 Billion USD.
We can see an Increase of 18.45% in the Trading volumes of Ripple as compared to yesterday, which is due to the selling by the medium-term investors.
This Week Ahead
The prices of XRPUSD are now moving into a Consolidation Channel above the 0.3100 handle and the next visible targets are 0.3000 and 0.2800
We can see that Doji is indicating a Neutral market in the 1 hour and 2-hour time frames. We can see the formation of MA10 crossover pattern located at 0.3128 indicating that after touching these levels a potential rise in the levels of Ripple is expected.
In the next week Ripple is expected to enter into a fresh wave of selling below the 0.3100 handle
The weekly outlook for Ripple is projected at 0.3100 with a consolidation zone of 0.3000
Technical Indicators:
Moving Averages Convergence Divergence (12,26): It is at -.004 indicating a SELL.
Average Directional Change(14days): It is at 21.83 indicating a SELL.
Bull/ Bear Power(13days): It is at -0.0028 indicating a SELL.
Ultimate Oscillator: It is at 44.90 indicating a SELL.
EUR/USD started a fresh decline and traded below 1.0500. EUR/JPY is recovering higher and might correct above the 141.20 resistance zone.
· The Euro started a major decline from the 1.0780 and 1.0800 resistance levels.
· There is a key bearish trend line forming with resistance near 1.0445 on the hourly chart.
· EUR/JPY formed a base near 139.40 and started an upside correction.
· There is a major bearish trend line forming with resistance near 141.20 on the hourly chart.
The Euro failed to clear the 1.0780 resistance against the US Dollar. The EUR/USD pair started a major decline below the 1.0650 and 1.0600 support levels.
There was a clear move below the 1.0550 level and the 50 hourly simple moving average. The pair even settled below the 1.0500 level. A low was formed near 1.0397 on FXOpen and the pair is now consolidating losses.
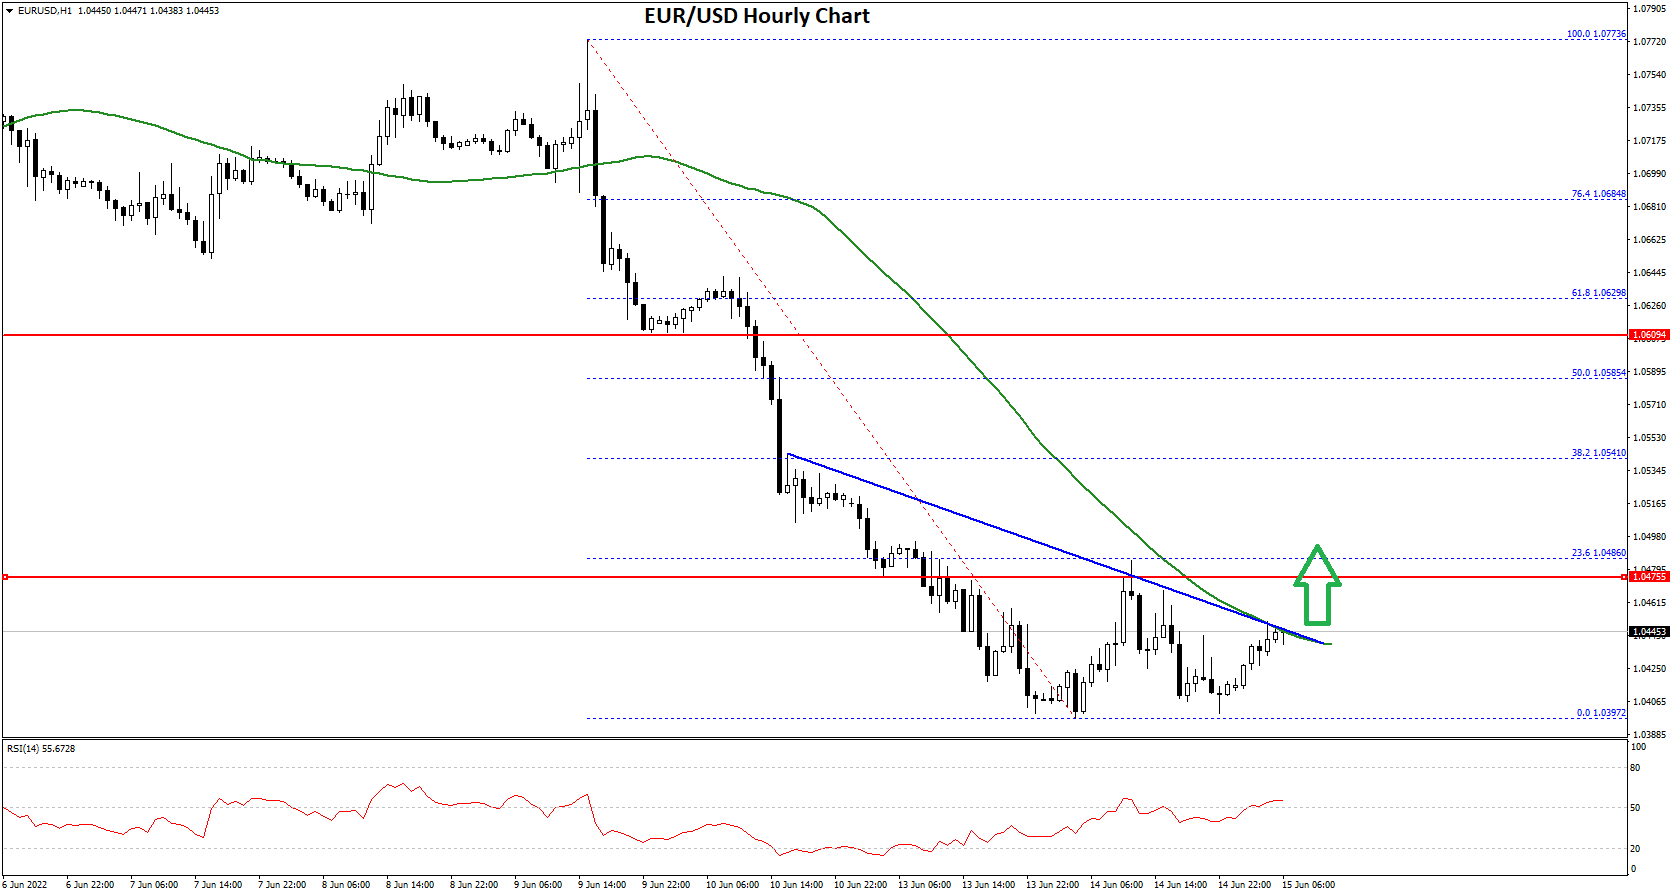
EUR/USD Hourly Chart
On the upside, the pair is facing resistance near the 1.0445 level. There is also a key bearish trend line forming with resistance near 1.0445 on the hourly chart.
The next major resistance is near the 1.0485 level. It is near the 23.6% Fib retracement level of the downward move from the 1.0773 swing high to 1.0397 low. A clear break above the 1.0485 resistance could push EUR/USD towards 1.0540.
If the bulls remain in action, the pair could revisit the 1.0585 resistance zone in the near term. The 50% Fib retracement level of the downward move from the 1.0773 swing high to 1.0397 low is near the 1.0585 level.
On the downside, the pair might find support near the 1.0420 level. The next major support sits near the 1.0400 level. If there is a downside break below the 1.0400 support, the pair might accelerate lower in the coming sessions.
The Euro also started a fresh decline from the 144.25 resistance against the Japanese Yen. The EUR/JPY pair gained pace and traded below the 142.00 support level.
The pair even broke the 140.00 level and the 50 hourly simple moving average. It traded as low as 139.38 and is currently correcting losses. There was a move above the 23.6% Fib retracement level of the downward move from the 144.24 swing high to 139.38 low.
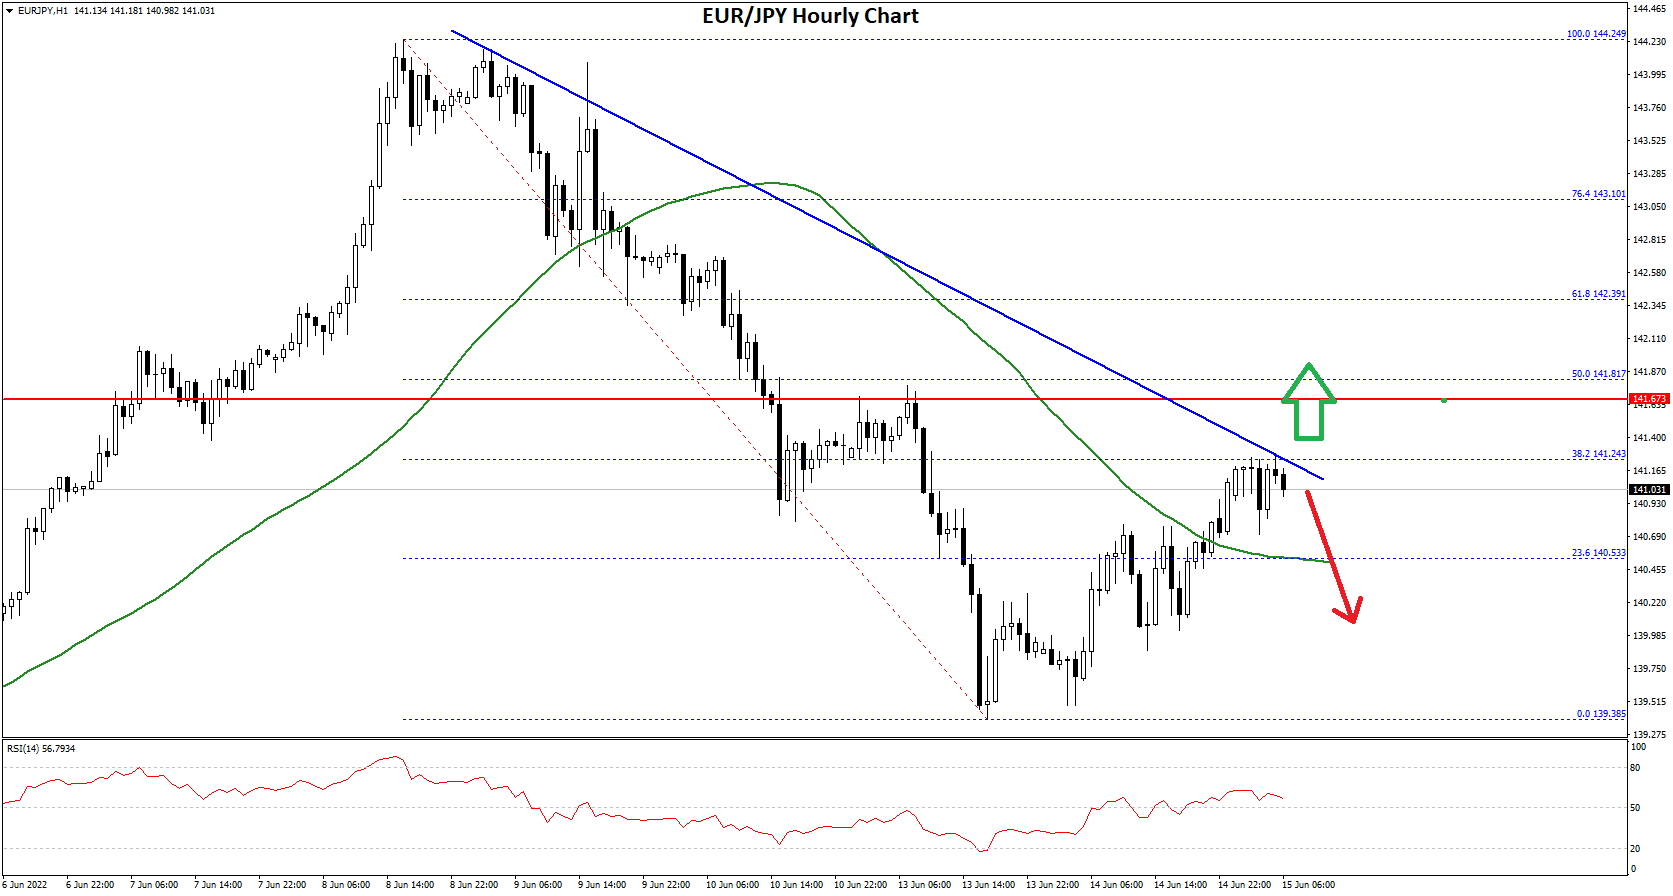
EUR/JPY Hourly Chart
It is now trading near the 144.20 resistance. There is also a major bearish trend line forming with resistance near 141.20 on the hourly chart.
If there is an upside break above the 141.20 resistance, the pair could test the 141.80 resistance. It is near the 50% Fib retracement level of the downward move from the 144.24 swing high to 139.38 low. The next major resistance could be near the 142.50 level, above which the pair could gain bullish momentum. In the stated case, the pair could rise towards the 143.50 level.
If not, the pair could start a fresh decline below the 140.50 support. The next major support is near the 140.00 level. The main support sits near the 139.40 level. Any more losses could lead the pair towards the 138.00 support level in the near term.


