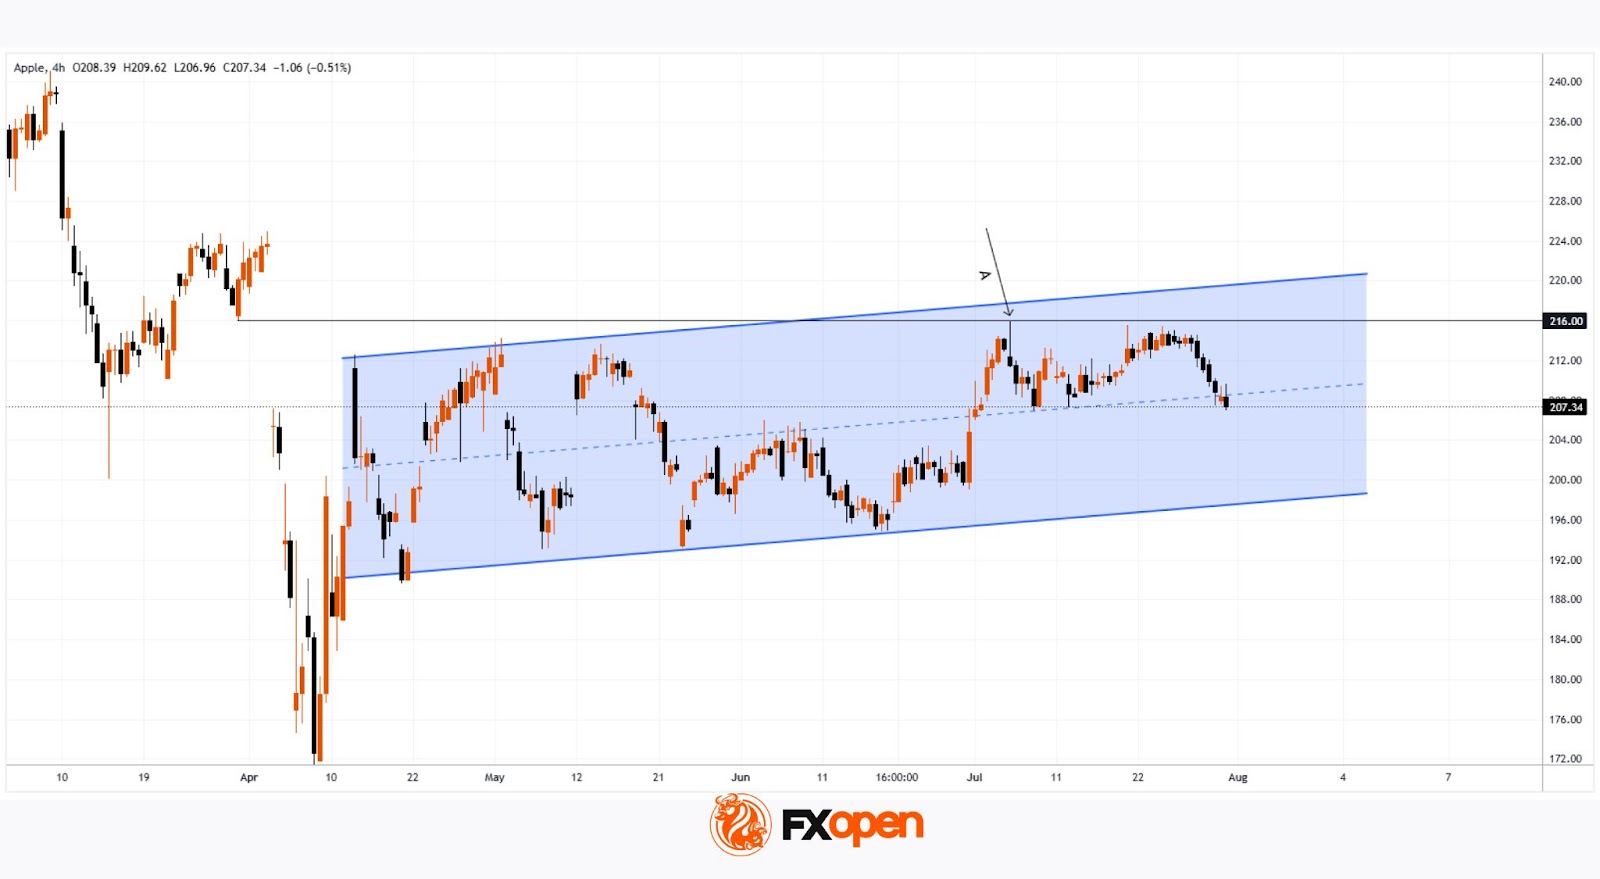
Apple (AAPL) Shares Jump Following Earnings Report
Yesterday, after the close of the regular trading session, Apple released its earnings report, which surpassed analysts’ expectations:
→ Earnings per share: actual = $1.57, forecast = $1.43;
→ Revenue: actual = $94.04 billion, forecast = $89.35 billion.
As a result, AAPL shares surged in the post-market, rising from $207.57 to $212.51.
Media Commentary:
→ The company reported a 13% year-on-year increase in iPhone sales.
→ However, according to Tim Cook, tariffs have already cost the company $800 million and this figure could exceed $1 billion in the next quarter.
TO VIEW THE FULL ANALYSIS, VISIT FXOPEN BLOG
Disclaimer: This article represents the opinion of the Companies operating under the FXOpen brand only (excluding FXOpen EU). It is not to be construed as an offer, solicitation, or recommendation with respect to products and services provided by the Companies operating under the FXOpen brand, nor is it to be considered financial advice.
What Is an Iceberg Order, and How Can You Use It for Trading?
An iceberg order is a type of execution strategy that hides the full size of a trade by revealing only small portions at a time. Used by institutions and large traders, it helps reduce market impact. Understanding how iceberg orders work, where they’re used, and their risks can help traders more accurately analyse market activity. This article breaks down everything you need to know about iceberg orders and their role in trading.
What Is an Iceberg Order?
An iceberg order is a type of order designed to execute large trades without revealing the full size to the market. Instead of placing one massive position that could disrupt prices, traders split it into smaller portions, with the rest hidden. As each portion gets filled, the next one is placed automatically until the full order is executed.
The key feature of this type of entry is that only a fraction—known as the display quantity—is visible in the order book at any given time. The rest remains hidden until it’s gradually revealed. This prevents other traders from immediately recognising the true size of the position, which helps avoid unnecessary market movements.
For example, if a trader wants to buy 50,000 shares of a stock, placing the full position in the market at once could cause prices to rise before execution is complete. Instead, they might set an iceberg order with a display size of 5,000 shares. Once the first 5,000 are bought, another 5,000 are automatically placed, repeating until the full 50,000 are executed.
TO VIEW THE FULL ARTICLE, VISIT FXOPEN BLOG
Disclaimer: This article represents the opinion of the Companies operating under the FXOpen brand only (excluding FXOpen EU). It is not to be construed as an offer, solicitation, or recommendation with respect to products and services provided by the Companies operating under the FXOpen brand, nor is it to be considered financial advice.
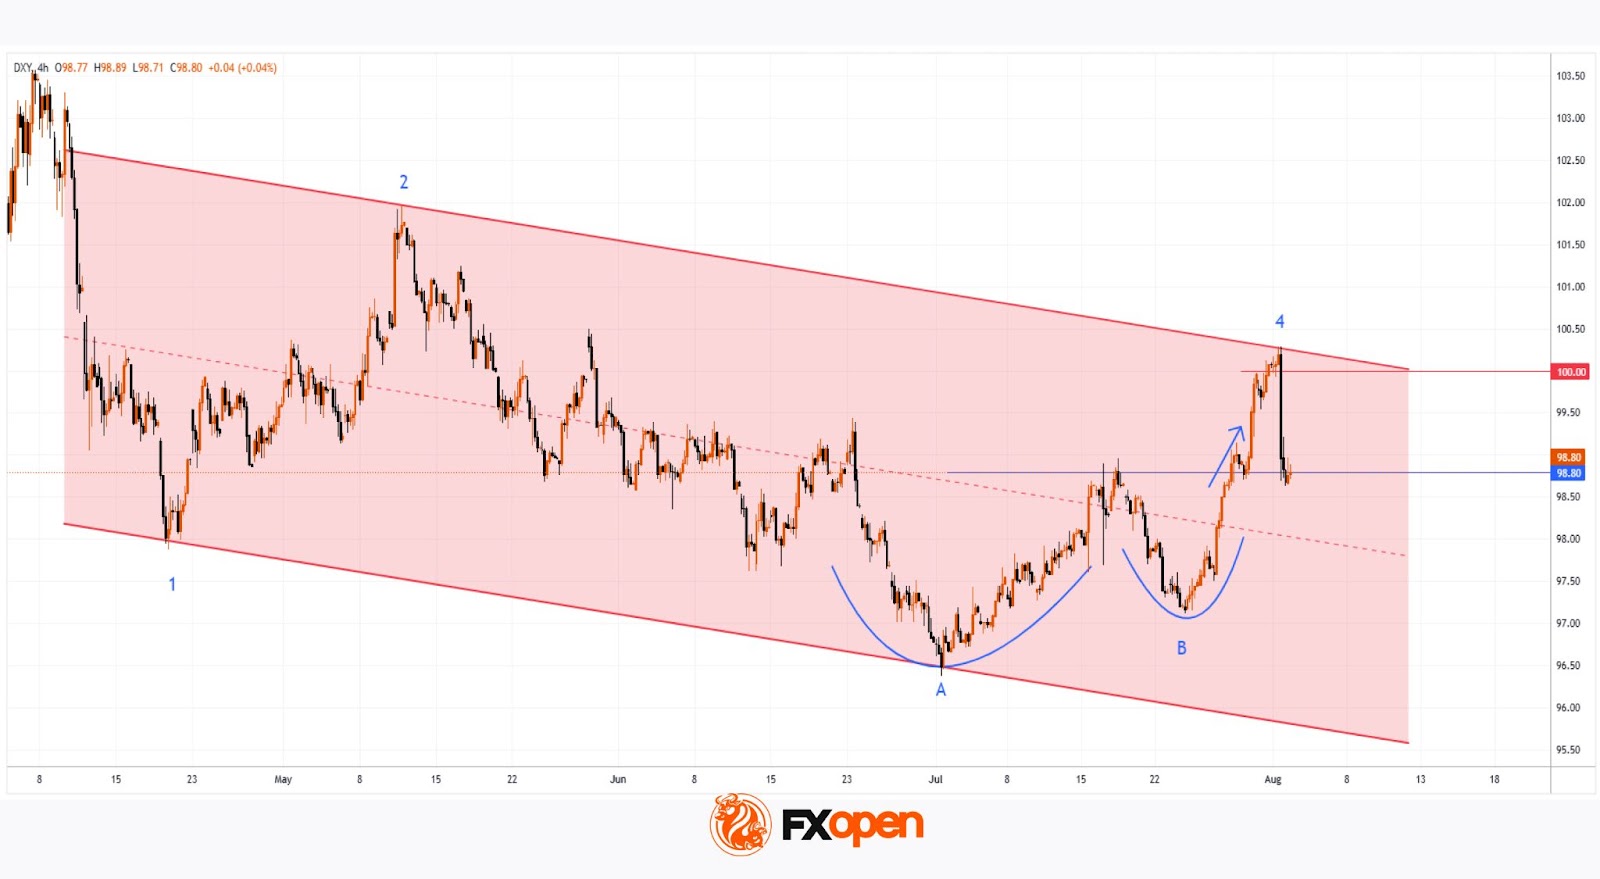
US Dollar Index (DXY) Plummets Following Labour Market Data
The US Dollar Index (DXY) fell by approximately 1.4% on Friday after the release of disappointing US labour market figures. According to Forex Factory:
→ The unemployment rate rose from 4.1% to 4.2%;
→ The Nonfarm Employment Change figure came in at 73K, well below the forecast of 103K. This is the lowest level of job creation in the nonfarm sector in 2025 and is roughly half the previous month’s reading (prior to revisions).
→ Furthermore, revisions for May and June were significantly more severe than usual. The May figure was revised downward by 125,000 — from +144,000 to +19,000. Similarly, the June figure was revised down by 133,000 — from +147,000 to +14,000.
These results point to a weakening labour market, which increases the likelihood of a rate cut aimed at supporting economic growth. In turn, expectations of a Fed rate cut are acting as a bearish driver for the US dollar.
TO VIEW THE FULL ANALYSIS, VISIT FXOPEN BLOG
Disclaimer: This article represents the opinion of the Companies operating under the FXOpen brand only (excluding FXOpen EU). It is not to be construed as an offer, solicitation, or recommendation with respect to products and services provided by the Companies operating under the FXOpen brand, nor is it to be considered financial advice.
Meta Platforms (META) Shares Decline
Shares of the US tech giant Meta Platforms (META) hit a record high last week, climbing above $780 following the release of a strong earnings report:
→ Earnings per share (EPS) came in at $7.14, significantly exceeding the forecast of $5.88.
→ The company also outperformed expectations on key metrics related to advertising growth.
→ Additionally, the media has highlighted the growing importance of AI technology to Meta’s business.
However, shortly after reaching an all-time high, META shares began to show bearish momentum.
TO VIEW THE FULL ANALYSIS, VISIT FXOPEN BLOG
Disclaimer: This article represents the opinion of the Companies operating under the FXOpen brand only (excluding FXOpen EU). It is not to be construed as an offer, solicitation, or recommendation with respect to products and services provided by the Companies operating under the FXOpen brand, nor is it to be considered financial advice.
Market Insights with Gary Thomson: 4 - 8 August
In this video, we’ll explore the key economic events, market trends, and corporate news shaping the financial landscape. Get ready for expert insights into forex, commodities, and stocks to help you navigate the week ahead. Let’s dive in!
In this episode of Market Insights, Gary Thomson unpacks the strategic implications of the week’s most critical events driving global markets.
 Key topics covered in this episode:
— BoE Interest Rate Decision Markets expect a 25 bps rate cut from the Bank of England on 7 August, but GBP volatility may hinge more on the MPC vote split and policy tone. Inflation has eased but remains above target, keeping the BoE cautious. What factors can trigger volatility in GBP pairs?
— Unemployment Rate in Canada Canada’s jobs data due 8 August could sway rate cut expectations. Last month’s surprise drop in unemployment eased pressure on the Bank of Canada. Will the upcoming jobs report revive rate cut bets and weigh on the Canadian dollar?
— Corporate Earnings Statements This week’s earnings spotlight major tech and consumer firms. Key focus areas include AI adoption, data center growth, and consumer spending trends, with Palantir, AMD, Super Micro, Disney, and Shopify all in play. Which company’s earnings do you think will have the biggest market impact — and why?
— Trade Tensions Trade tensions remain a market risk, even without new Trump announcements this week. Reactions from major partners like India, the EU, China, and Canada could spark volatility.
Gain insights to strengthen your trading knowledge.

Watch it now and stay updated with FXOpen.
Don’t miss out on this invaluable opportunity to sharpen your trading skills and make informed decisions.
Disclaimer: This video represents the opinion of the Companies operating under the FXOpen brand only. It is not to be construed as an offer, solicitation, or recommendation with respect to products and services provided by the Companies operating under the FXOpen brand, nor is it to be considered financial advice.
Understanding Liquidity Sweeps: Definition, Mechanism, and Trading Applications
Gaining a solid understanding of key concepts such as liquidity is essential for refining trading strategies. This article delves into the concept of a liquidity sweep—a significant market event in which institutional participants influence price movements by activating clusters of pending orders—and explains how traders leverage this phenomenon for deeper trading insights.
Understanding Liquidity in Trading
In trading, liquidity refers to the ability to buy or sell assets quickly without causing significant price changes. This concept is essential as it determines the ease with which transactions can be completed. High liquidity means that there are sufficient buyers and sellers at any given time, which results in tighter spreads between the bid and ask prices and more efficient trading.
Liquidity is often visualised as the market’s bloodstream, vital for its smooth and efficient operation. Financial assets rely on this seamless flow to ensure that trades can be executed rapidly and at particular prices. Various participants, including retail investors, institutions, and market makers, contribute to this ecosystem by providing the necessary volume of trades.
Liquidity is also dynamic and influenced by factors such as notable news and economic events, which can all affect how quickly assets can be bought or sold. For traders, understanding liquidity is crucial because it affects trading strategies, particularly in terms of entry and exit points in the markets.
TO VIEW THE FULL ARTICLE, VISIT FXOPEN BLOG
Disclaimer: This article represents the opinion of the Companies operating under the FXOpen brand only (excluding FXOpen EU). It is not to be construed as an offer, solicitation, or recommendation with respect to products and services provided by the Companies operating under the FXOpen brand, nor is it to be considered financial advice.
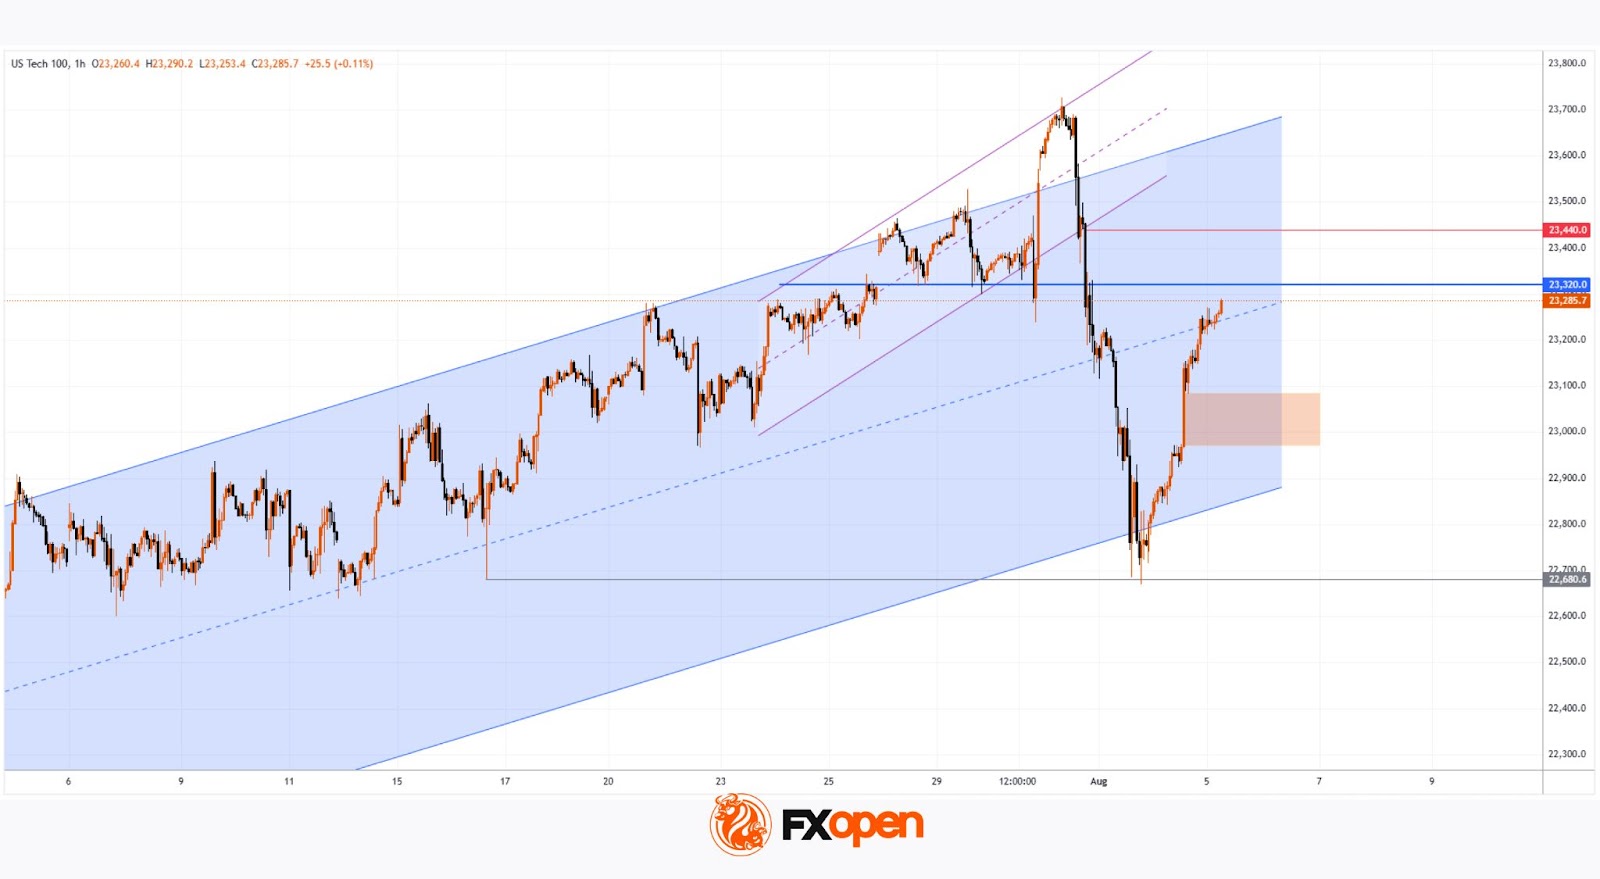
Nasdaq 100 Analysis: Index Rebounds After Friday’s Decline
The release of disappointing US labour market data on Friday unsettled both stock market participants and the President of the United States:
→ Donald Trump promptly dismissed Erica McEntarfer, Commissioner of the Bureau of Labor Statistics, accusing her of falsifying employment data.
→ Stock indices accelerated their decline, with the Nasdaq 100 Index (US Tech 100 mini on FXOpen) falling below its 16 June low.
However, US stock indices staged a strong recovery on Monday. According to Reuters, yesterday marked the largest daily percentage gain since 27 May.
Why Did Stock Indices Rise?
Possible reasons include:
→ Buyers were attracted by the falling share prices of companies that, for the most part, had delivered strong quarterly earnings;
→ Market participants are betting on a potential rate cut by the Federal Reserve in September (a move strongly advocated by Trump), which could support both the economy and the stock market.
TO VIEW THE FULL ANALYSIS, VISIT FXOPEN BLOG
Disclaimer: This article represents the opinion of the Companies operating under the FXOpen brand only (excluding FXOpen EU). It is not to be construed as an offer, solicitation, or recommendation with respect to products and services provided by the Companies operating under the FXOpen brand, nor is it to be considered financial advice.
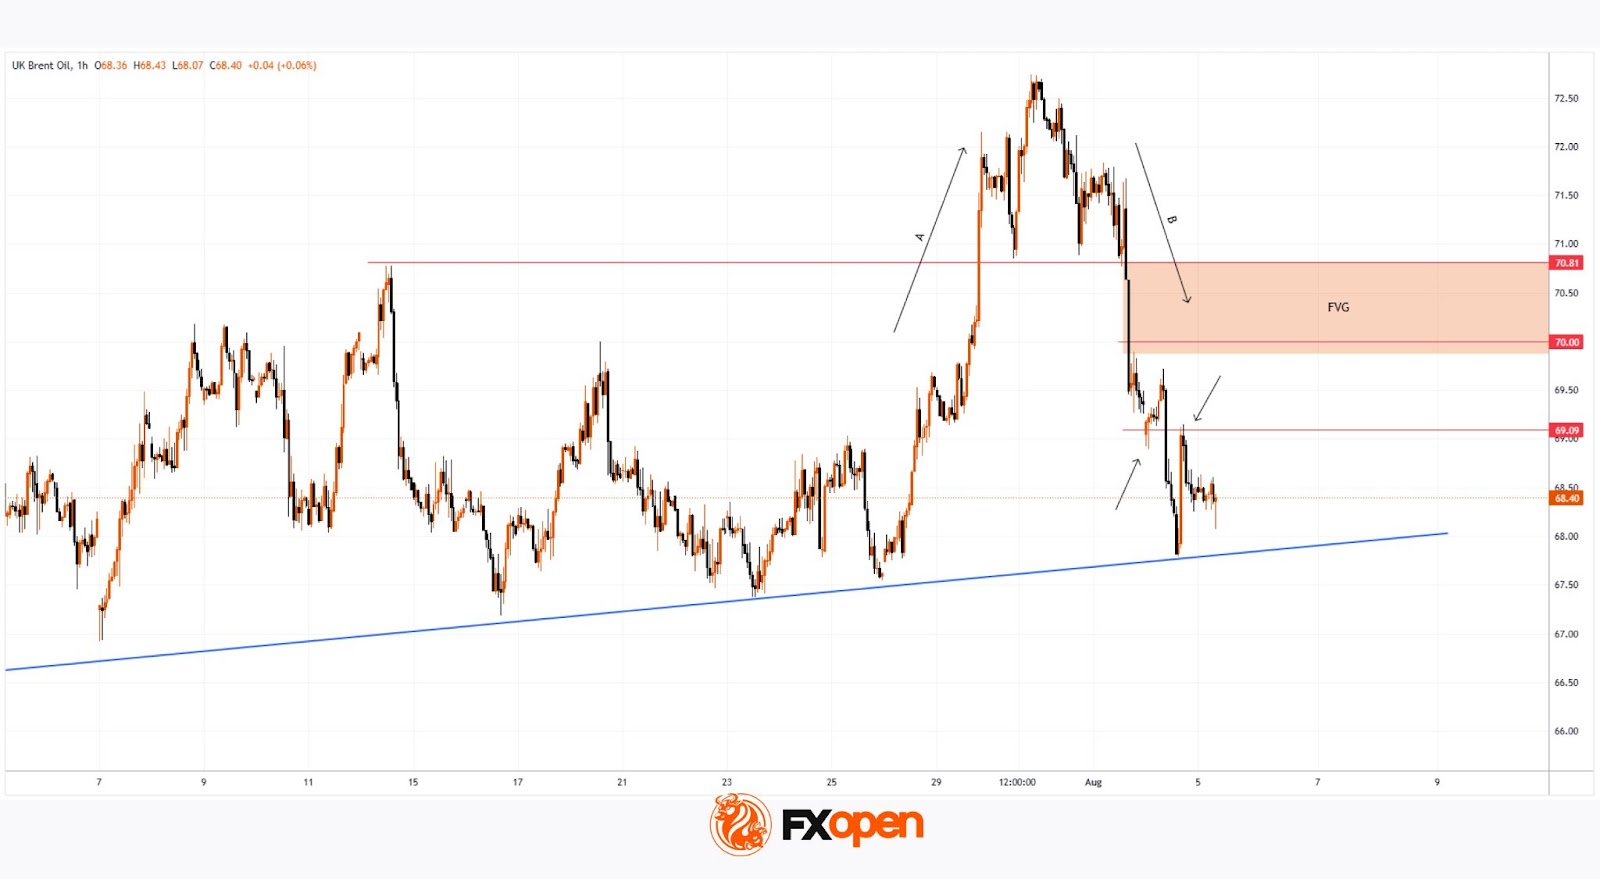
XBR/USD Chart Analysis: Oil Price Declines Towards Key Support
As the XBR/USD chart shows, Brent crude oil has made two significant moves recently:
- Last week’s price increase (A) followed President Donald Trump’s intentions to impose tariffs on India due to its purchases of Russian oil. This could have disrupted established oil supply chains.
- The price decline (B) may have been driven by both the decision of OPEC+ countries to increase production and reports of a weakening US labour market.
Thus, there is reason to believe that the more than 4.5% decline in Brent crude oil prices since the beginning of August reflects market participants’ scepticism about sustained high oil prices:
→ this has a negative impact on the US economy (JP Morgan analysts raised concerns about recession risks this week);
→ increased activity from oil producers may offset supply chain disruption risks.
TO VIEW THE FULL ANALYSIS, VISIT FXOPEN BLOG
Disclaimer: This article represents the opinion of the Companies operating under the FXOpen brand only (excluding FXOpen EU). It is not to be construed as an offer, solicitation, or recommendation with respect to products and services provided by the Companies operating under the FXOpen brand, nor is it to be considered financial advice.
What Is a Pyramiding Strategy, and How Does It Work in Trading?
Pyramiding is a trading strategy where traders gradually increase their position size as the market moves in their favour. Instead of committing full capital upfront, they add to winning positions at key levels. This article explains how pyramiding works, common strategies, potential risks, and key considerations for traders looking to add it to their trading approach.
What Is Pyramiding?
Pyramiding is a strategy where traders gradually add to an effective position instead of going all in from the start. It’s used in trending markets, where traders look to take advantage of sustained price movements by expanding their exposure as the trend develops. The key difference between pyramiding and simply increasing position size at the outset is that pyramiding limits initial risk. Instead of committing full capital upfront, traders build up their position only when the market moves in their favour.
Applying a pyramid to a position is particularly common in markets with strong momentum. A trader, for example, might start with one unit of an asset and, if the price moves favourably, add another half-unit at a predefined level. If the trend continues, they might add another quarter-unit. This gradual scaling means more capital is committed only when conditions confirm the trend.
The logic behind pyramiding in trading is straightforward: when the market is moving in the right direction, the strategy compounds potential returns without significantly increasing initial risk. It also allows traders to adjust their exp
TO VIEW THE FULL ARTICLE, VISIT FXOPEN BLOG
Disclaimer: This article represents the opinion of the Companies operating under the FXOpen brand only (excluding FXOpen EU). It is not to be construed as an offer, solicitation, or recommendation with respect to products and services provided by the Companies operating under the FXOpen brand, nor is it to be considered financial advice.
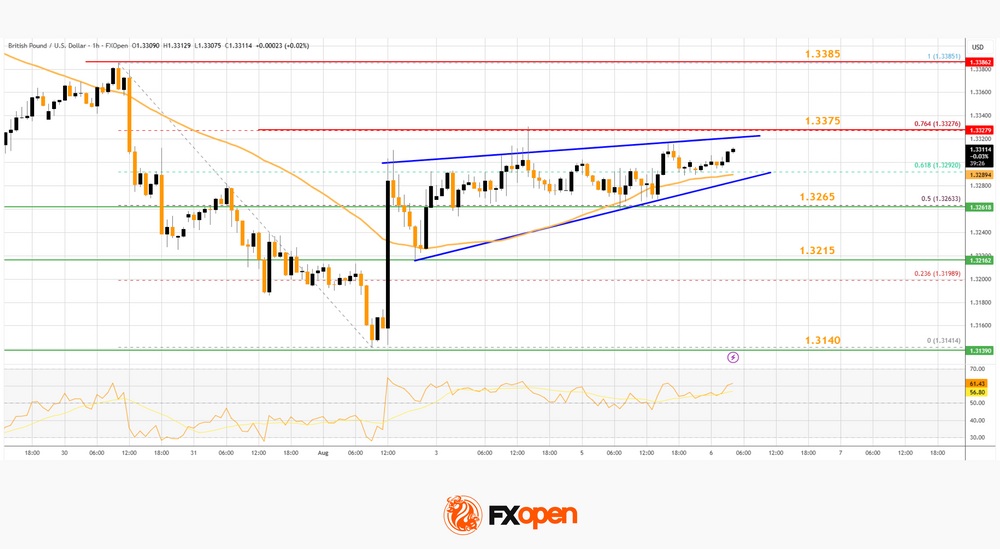
Market Analysis: GBP/USD Rebounds Cautiously, EUR/GBP Loses Momentum
GBP/USD is attempting a recovery wave above the 1.3215 resistance. EUR/GBP is consolidating and might aim for a fresh increase above 0.8700.
Important Takeaways for GBP/USD and EUR/GBP Analysis Today
- The British Pound is attempting a fresh increase above 1.3265.
- There is a contracting triangle forming with resistance at 1.3375 on the hourly chart of GBP/USD at FXOpen.
- EUR/GBP is trading in a positive zone above the 0.8665 pivot level.
- There is a short-term declining channel forming with resistance near 0.8705 on the hourly chart at FXOpen.
GBP/USD Technical Analysis
On the hourly chart of GBP/USD at FXOpen, the pair declined after it failed to clear the 1.3600 resistance. As mentioned in the previous analysis, the British Pound even traded below the 1.3350 support against the US Dollar.
Finally, the pair tested the 1.3140 zone and is currently attempting a fresh increase. The bulls were able to push the pair above the 50-hour simple moving average and 1.3215. The pair even climbed above the 1.3265 level.
The bulls were able to push the pair above the 50% Fib retracement level of the downward move from the 1.3385 swing high to the 1.3141 low.
TO VIEW THE FULL ANALYSIS, VISIT FXOPEN BLOG
Disclaimer: This article represents the opinion of the Companies operating under the FXOpen brand only (excluding FXOpen EU). It is not to be construed as an offer, solicitation, or recommendation with respect to products and services provided by the Companies operating under the FXOpen brand, nor is it to be considered financial advice.
AMD Shares Decline Despite Strong Earnings Report
Yesterday, following the close of the stock market, Advanced Micro Devices released a strong quarterly earnings report:
→ Earnings per share came in at $0.48 (roughly in line with forecasts);
→ Revenue reached $7.68 billion (versus expectations of $7.41 billion).
At the same time, CEO Lisa Su stated: “We’re well positioned to deliver significant growth in the second half.”
However, despite the solid performance and optimistic outlook, AMD shares declined in after-hours trading, falling below $165.
The decline in AMD’s share price following a strong report may be attributed to excessively high expectations and the stock’s overbought condition ahead of the announcement.
TO VIEW THE FULL ANALYSIS, VISIT FXOPEN BLOG
Disclaimer: This article represents the opinion of the Companies operating under the FXOpen brand only (excluding FXOpen EU). It is not to be construed as an offer, solicitation, or recommendation with respect to products and services provided by the Companies operating under the FXOpen brand, nor is it to be considered financial advice.
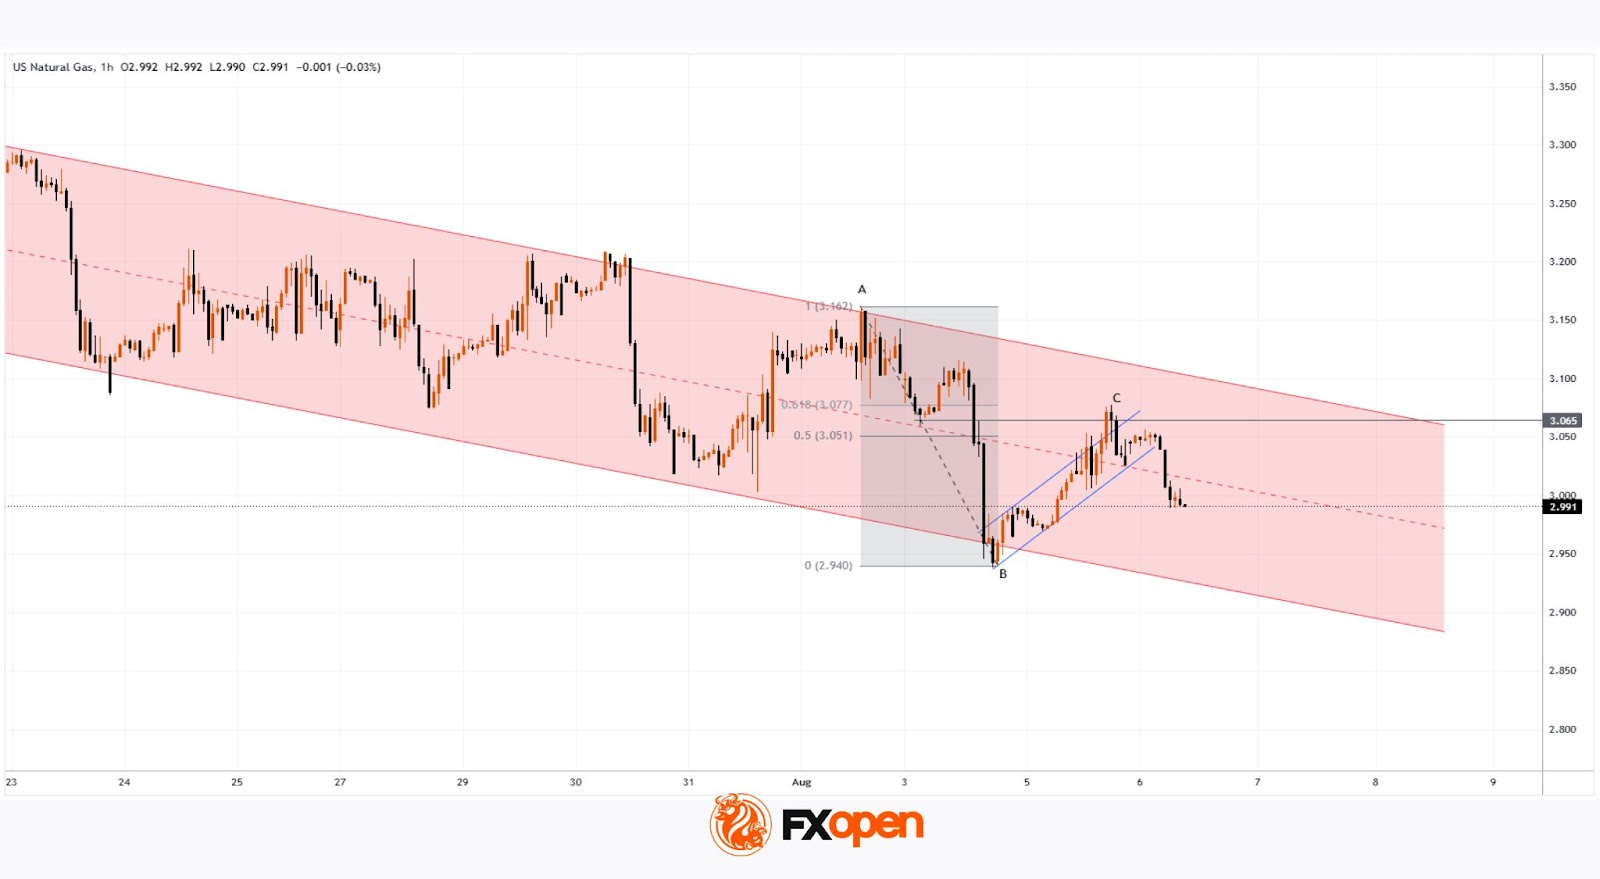
Natural Gas Prices Fall to Yearly Low
Analysing the chart on 22 July, we constructed a descending channel and assumed that natural gas prices would continue to form a bearish market structure of lower highs and lower lows. Since then, the market has declined by almost 10%.
As the XNG/USD chart shows today, natural gas prices are hovering around the psychological level of $3.000/MMBtu. Earlier this week, gas was trading around $2.940/MMBtu — the lowest level of 2025.
According to media reports, the price decline is driven by both high production levels and favourable weather forecasts for August, the hottest month of the year. What might happen next?
TO VIEW THE FULL ANALYSIS, VISIT FXOPEN BLOG
Disclaimer: This article represents the opinion of the Companies operating under the FXOpen brand only (excluding FXOpen EU). It is not to be construed as an offer, solicitation, or recommendation with respect to products and services provided by the Companies operating under the FXOpen brand, nor is it to be considered financial advice.
The Role of Automated Trading Systems
Do you know that automated trading systems are capable of executing trades in less than a millisecond? In the fast-paced world of finance, automated systems are the trading superheroes. They’re like financial wizards, using smart maths and high-tech tricks to make quick, precise, and smooth trades. Let’s dive into what these trading systems do and why they’re such a big deal in today’s world of finance.
Introduction to Automated Trading Systems
Automated trading systems, also known as algo or algorithmic trading, are like tech-savvy assistants in the financial world. They don’t need human input for each move; they follow specific rules set by a trader and execute trades when criteria are met. They focus on data analysis and risk management.
VIEW FULL ANALYSIS VISIT - FXOpen Blog…
Disclaimer: This article represents the opinion of the Companies operating under the FXOpen brand only (excluding FXOpen EU). It is not to be construed as an offer, solicitation, or recommendation with respect to products and services provided by the Companies operating under the FXOpen brand, nor is it to be considered financial advice.
EUR/USD Rises 2.3% Since the Beginning of August
As the EUR/USD chart shows today, the euro has strengthened against the US dollar, climbing above the 1.1670 level, compared to the 1.1400 area at the beginning of the month.
Why Is EUR/USD Rising?
According to Reuters, the US dollar’s weakness is being driven by:
→ Expectations of a Federal Reserve rate cut, which intensified following last week’s disappointing US labour market data.
→ Anticipation of the upcoming US inflation report, scheduled for release on 12 August at 15:30 GMT+3.
On the other hand, the euro is being supported by growing optimism around a possible resolution of the military conflict in Ukraine, as well as the potential meeting between Donald Trump and Vladimir Putin.
TO VIEW THE FULL ANALYSIS, VISIT FXOPEN BLOG
Disclaimer: This article represents the opinion of the Companies operating under the FXOpen brand only (excluding FXOpen EU). It is not to be construed as an offer, solicitation, or recommendation with respect to products and services provided by the Companies operating under the FXOpen brand, nor is it to be considered financial advice.