Daily Market Analysis By FXOpen

Amazon (AMZN) shares fall around 3% in a single day

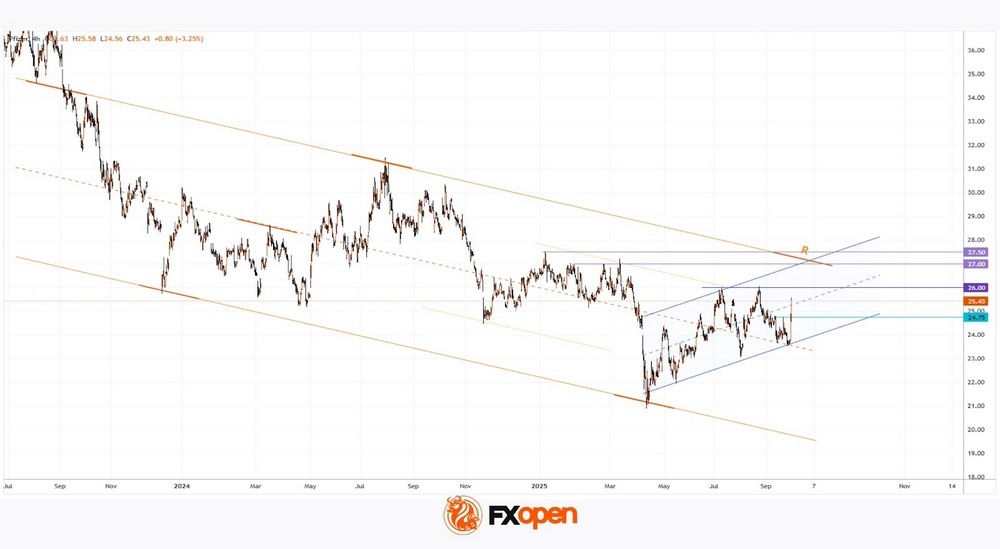
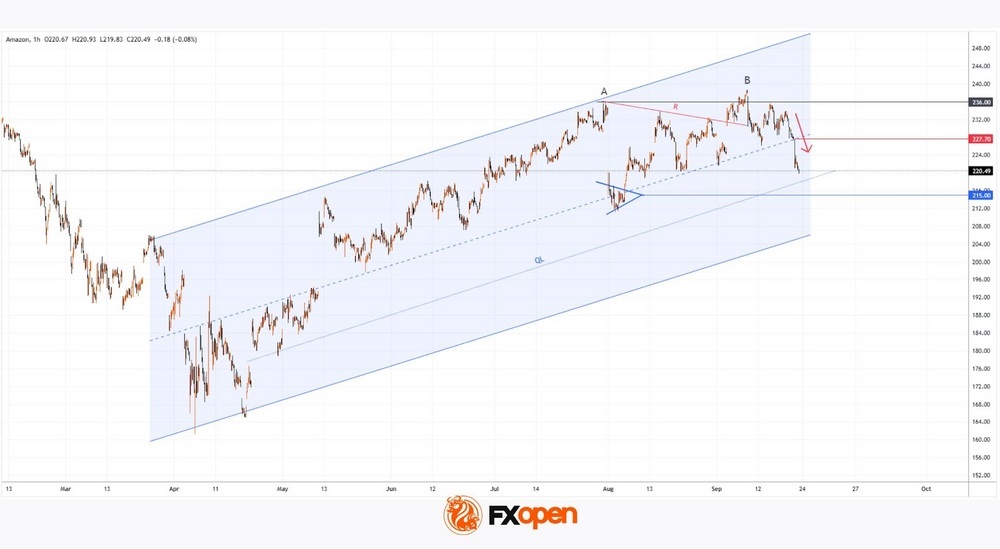
As the chart shows, Amazon (AMZN) shares fell by roughly 3% yesterday after reports that the US Federal Trade Commission has launched a probe into the company over alleged “dark patterns”.

According to the allegations, Amazon may have deliberately complicated the process of cancelling Prime subscriptions in order to retain customers. Should the charges be proven, this could result in significant fines and have a major impact on one of Amazon’s key revenue streams.

Amazon’s share price dipped below $220 yesterday for the first time since 12 August. Could the decline continue?

TO VIEW THE FULL ANALYSIS, VISIT FXOPEN BLOG

Disclaimer: This article represents the opinion of the Companies operating under the FXOpen brand only (excluding FXOpen EU). It is not to be construed as an offer, solicitation, or recommendation with respect to products and services provided by the Companies operating under the FXOpen brand, nor is it to be considered financial advice.

Gold Bulls Dominate Market, WTI Crude Oil Rebounds

Gold price started a fresh surge above $3,750 and traded to a new all-time high. Crude oil is recovering and might rise toward the $64.30 resistance zone.

Important Takeaways for Gold and WTI Crude Oil Prices Analysis Today

  • Gold price rallied to a new all-time high and traded close to $3,800 against the US Dollar.
  • A short-term bullish flag pattern is forming with resistance at $3,770 on the hourly chart of gold at FXOpen.
  • WTI Crude oil is recovering losses and trading above $62.60.
  • There is a major bearish trend line in place with resistance near $63.65 on the hourly chart of XTI/USD at FXOpen.

Gold Price Technical Analysis


On the hourly chart of Gold at FXOpen, the price formed support near $3,625. The price remained in a bullish zone and started a fresh increase above $3,660, as mentioned in the previous analysis.

The bulls pushed the price above $3,750 level and the 50-hour simple moving average. Finally, it traded to a new all-time high at $3,791. The price is now consolidating gains below $3,770 and the RSI is above 50.

Initial support on the downside is near the 23.6% Fib retracement level of the upward move from the $3,627 swing low to the $3,791 high at $3,750 and the 50-hour simple moving average.

TO VIEW THE FULL ANALYSIS, VISIT FXOPEN BLOG

Disclaimer: This article represents the opinion of the Companies operating under the FXOpen brand only (excluding FXOpen EU). It is not to be construed as an offer, solicitation, or recommendation with respect to products and services provided by the Companies operating under the FXOpen brand, nor is it to be considered financial advice.

Euro Returns to Yearly Highs: Continuation of the Rally or a Bull Trap?

European currencies are rebounding following a recent correction, with EUR/USD and EUR/JPY supported by last week’s interest rate cut by the US Federal Reserve. The Fed’s easing decision triggered a jump in the euro to a yearly high, although some of those gains were quickly pared back. The euro is now showing renewed upward momentum, but the further direction of the trend will depend on whether fresh data from the US and Europe confirm a continuation of the rally or trigger another pullback. In the coming sessions, markets will be watching the release of German business climate indices and US housing market data, which could set the tone for price movements.

EUR/USD


After a sharp rise to 1.1920, the EUR/USD pair retreated, losing around 200 points. Nevertheless, buyers of the single European currency found support just above 1.1700, and yesterday’s daily candle closed near 1.1800. Technical analysis of EUR/USD points to a possible continuation of the rise towards recent highs, as a “bullish engulfing” pattern has formed on the daily timeframe. A daily close below 1.1720 could open the way for a deeper correction, with initial targets around 1.1650.

TO VIEW THE FULL ANALYSIS, VISIT FXOPEN BLOG

Disclaimer: This article represents the opinion of the Companies operating under the FXOpen brand only (excluding FXOpen EU). It is not to be construed as an offer, solicitation, or recommendation with respect to products and services provided by the Companies operating under the FXOpen brand, nor is it to be considered financial advice.

Australian Dollar Strengthens Following Inflation Data

According to Forex Factory, Australia’s CPI index came in higher than expected: analysts had forecast an annual rate of 2.9%, while the actual figure was 3.0% (previous value: 2.8%).

This led to a strengthening of the Australian dollar, as the Reserve Bank of Australia (RBA) may adopt a more cautious stance in its monetary policy easing process (in August it cut the cash rate from 3.85% to 3.60%, following a peak of 4.35% in 2024).

On the other hand, traders are weighing the impact of yesterday’s remarks from the Chair of the Federal Reserve, who adopted a cautious tone. According to Powell, the Fed must strike a balance between persistent inflation and a weakening labour market, describing the situation as “challenging”.

TO VIEW THE FULL ANALYSIS, VISIT FXOPEN BLOG

Disclaimer: This article represents the opinion of the Companies operating under the FXOpen brand only (excluding FXOpen EU). It is not to be construed as an offer, solicitation, or recommendation with respect to products and services provided by the Companies operating under the FXOpen brand, nor is it to be considered financial advice.

EUR/USD Falls Ahead of PCE Index Release

A week ago, we wrote about significant changes in the dollar index – the DXY chart was signalling bullish trends. This week has confirmed those assumptions, which is also reflected in EUR/USD: this morning, the pair fell below 1.1660, marking a three-week low.

Trader sentiment is being influenced by:
→ News regarding President Trump’s decision to impose tariffs on pharmaceuticals (and other goods) imported into the US.
→ Expectations for the release of the Core PCE (Personal Consumption Expenditures) Price Index, scheduled for 15:30 GMT+3 – the data may provide important guidance on the inflation outlook and potential US interest rate cuts.

TO VIEW THE FULL ANALYSIS, VISIT FXOPEN BLOG

Disclaimer: This article represents the opinion of the Companies operating under the FXOpen brand only (excluding FXOpen EU). It is not to be construed as an offer, solicitation, or recommendation with respect to products and services provided by the Companies operating under the FXOpen brand, nor is it to be considered financial advice.

Apple Shares (AAPL) Close to Reaching Record High

On 10 September, we noted that following the launch of new products — including the iPhone 17 — AAPL shares had fallen by approximately 1.5%, as analysts considered the model lacked the breakthrough appeal necessary to drive further growth.

However, two weeks on, media reports point to strong demand for the new product range, highlighting that:
→ orders for the new devices exceed those for last year’s iPhone 16 series;
→ Apple has asked suppliers to increase production;
→ the base model, featuring the long‑awaited 120Hz display and the powerful A19 chip, is in especially high demand.

Positive reports of long queues at Apple Stores worldwide, along with extended delivery times — which Bank of America estimates at an average of 18 days compared to 10 days for last year’s model — have only bolstered bullish sentiment. AAPL shares are rising this week, even as broader market indices are falling.

TO VIEW THE FULL ANALYSIS, VISIT FXOPEN BLOG

Disclaimer: This article represents the opinion of the Companies operating under the FXOpen brand only (excluding FXOpen EU). It is not to be construed as an offer, solicitation, or recommendation with respect to products and services provided by the Companies operating under the FXOpen brand, nor is it to be considered financial advice.

What Are Order Blocks and Breaker Blocks in the Smart Money Concept?

Order blocks and breaker blocks are important price action structures. These formations reflect zones where large market participants—often referred to as smart money—execute significant buy or sell orders, influencing market direction.

Although many retail traders overlook these patterns, understanding them can support traders when analysing market direction and detecting potential reversals or trend continuations. This article provides a detailed breakdown of order blocks and breaker blocks, outlining their definitions, distinctions, and practical applications in market analysis.

What Are Order Blocks in Trading?

An order block, also known as a supply or demand zone, represents a significant area on the price chart where large market participants, such as banks or institutional traders, have placed substantial buy or sell orders. They’re crucial in understanding the flow and direction of an asset, as they often precede notable movements in price. Particularly in the realm of forex, where the magnitude of transactions can be immense, identifying these zones can provide traders with a strategic edge.

TO VIEW THE FULL ANALYSIS, VISIT FXOPEN BLOG

Disclaimer: This article represents the opinion of the Companies operating under the FXOpen brand only (excluding FXOpen EU). It is not to be construed as an offer, solicitation, or recommendation with respect to products and services provided by the Companies operating under the FXOpen brand, nor is it to be considered financial advice.

Analytical Forecasts for UK Interest Rates in 2025–2026

The UK’s interest rate trajectory remains a critical point of focus for investors and traders as the economy navigates persistent inflation, shifting trade relationships, and a cautious monetary policy stance from the Bank of England. In 2025, and extending into 2026, expert forecasts vary significantly, reflecting uncertainty in both domestic and global markets. In this article, we will examine institutional projections, market expectations, and key macroeconomic drivers influencing potential rate adjustments.

UK Interest Rate Landscape
The UK’s interest rate landscape has undergone significant transformations over the past few years. From the end of 2021 to the middle of 2023, the Bank of England (BoE) raised interest rates from the historic low of 0.1% to 5.25%—the highest in UK interest rates history since 2008. The decision to elevate interest rates from near-zero levels was primarily driven by the need to counteract rising inflation, which has emerged as a considerable threat to the UK’s economic stability.

TO VIEW THE FULL ANALYSIS, VISIT FXOPEN BLOG

Disclaimer: This article represents the opinion of the Companies operating under the FXOpen brand only (excluding FXOpen EU). It is not to be construed as an offer, solicitation, or recommendation with respect to products and services provided by the Companies operating under the FXOpen brand, nor is it to be considered financial advice.

GBP/USD Bounces Back, USD/CAD Maintains Bullish Consolidation

GBP/USD is attempting a recovery wave from 1.3325. USD/CAD is showing positive signs and might aim for more gains above 1.3960.

Important Takeaways for GBP/USD and USD/CAD Analysis Today

  • The British Pound started a recovery wave above 1.3370 and 1.3400.
  • There was a break above a key bearish trend line with resistance near 1.3390 on the hourly chart of GBP/USD at FXOpen.
  • USD/CAD rallied above 1.3880 and 1.3920 before the bears appeared.
  • There is a connecting bullish trend line forming with support at 1.3915 on the hourly chart at FXOpen.

GBP/USD Technical Analysis

On the hourly chart of GBP/USD at FXOpen, the pair started a fresh decline from 1.3530 after a decent increase. The British Pound traded below 1.3450 to again move into a short-term bearish zone against the US Dollar.

The pair even traded below 1.3400 and the 50-hour simple moving average. Finally, the bulls appeared near 1.3325. A low was formed near 1.3323 and the pair is now attempting a short-term recovery wave.

There was a fresh upside above 1.3370 and the 23.6% Fib retracement level of the downward move from the 1.3528 swing high to the 1.3323 low. More importantly, there was a break above a key bearish trend line with resistance near 1.3390.

TO VIEW THE FULL ANALYSIS, VISIT FXOPEN BLOG

Disclaimer: This article represents the opinion of the Companies operating under the FXOpen brand only (excluding FXOpen EU). It is not to be construed as an offer, solicitation, or recommendation with respect to products and services provided by the Companies operating under the FXOpen brand, nor is it to be considered financial advice.

The S&P 500 Index Remains Positive Against the Odds

Today, the S&P 500 Index (US SPX 500 mini on FXOpen) is trading close to a new all-time high, having opened Monday above 6,675 points. This reflects continued optimism among market participants despite factors such as:

→ The risk of a U.S. government shutdown on 1 October.
Today, President Trump will meet with Democratic and Republican leaders in Congress to try to prevent a halt to government funding. However, Reuters reports that chances of reaching an agreement are slim. At the same time, Bank of America analysts remain calm, noting that a shutdown would shave only around 0.1% off GDP per week, and historically such closures have had little impact on financial markets.

→ Jerome Powell’s hawkish stance at the September Federal Reserve meeting.
Nevertheless, most market participants expect the Fed to make another move towards cutting rates at its next meeting on 29 October. The publication of the PCE index on Friday increased this likelihood, as the figures came in line with forecasts, reducing the risk of a renewed inflation surge.

TO VIEW THE FULL ANALYSIS, VISIT FXOPEN BLOG

Disclaimer: This article represents the opinion of the Companies operating under the FXOpen brand only (excluding FXOpen EU). It is not to be construed as an offer, solicitation, or recommendation with respect to products and services provided by the Companies operating under the FXOpen brand, nor is it to be considered financial advice.

Tesla (TSLA) Share Price Rises Ahead of Earnings Report

On 16 September, we noted signs of a strong market for Tesla (TSLA) shares, including:
→ The price remaining above the psychological level of $400;
→ Reaching the highest levels since late January.

We also identified an ascending channel and suggested that the long-term outlook remained optimistic, although a correction could not be ruled out.

Since then, TSLA shares have stabilised near the upper boundary of the channel, holding above the $400 level. On Friday, they were among the market leaders, rising by more than 4%. This brings the gain since the start of September to around +30%.

Why Are TSLA Shares Rising?

Key factors supporting a bullish outlook include:

→ Sentiment ahead of the quarterly Production and Deliveries report, expected this week. According to recent forecasts, actual figures could exceed expectations (although still showing a decline compared to the previous year).

→ Target price upgrades. Dan Ives of Wedbush, one of Tesla’s most prominent bulls, last week raised his target price to $600 — the highest on Wall Street — citing substantial potential in AI and robotaxi development.

→ The “Musk factor”: Discussions around Elon Musk stepping away from politics are seen as a long-term positive driver.

TO VIEW THE FULL ANALYSIS, VISIT FXOPEN BLOG

Disclaimer: This article represents the opinion of the Companies operating under the FXOpen brand only (excluding FXOpen EU). It is not to be construed as an offer, solicitation, or recommendation with respect to products and services provided by the Companies operating under the FXOpen brand, nor is it to be considered financial advice.

Hammer Candlestick Pattern: Definition and Trading Signals

Technical analysis is a cornerstone of trading, relying on historical price movements to anticipate future trends. Among its many tools and chart formations, the hammer candlestick pattern is a popular signal of potential reversals. This article explores the meaning of the hammer candlestick pattern and how traders can interpret it on forex, stock, and cryptocurrency* charts.

What Is a Hammer Candle?
A hammer is a single-candle pattern that typically appears at the end of a downtrend, signalling a possible shift to bullish momentum. Recognised by its small body and long lower shadow, it suggests that sellers pushed prices lower during the session, but buyers regained control before the close.

TO VIEW THE FULL ANALYSIS, VISIT FXOPEN BLOG

Disclaimer: This article represents the opinion of the Companies operating under the FXOpen brand only (excluding FXOpen EU). It is not to be construed as an offer, solicitation, or recommendation with respect to products and services provided by the Companies operating under the FXOpen brand, nor is it to be considered financial advice.

Analysis of MU Shares Following Earnings Report

Memory chip manufacturer Micron Technology (MU) published a positive financial report for Q4 of fiscal year 2025 on 23 September:

→ Q4 Revenue: Actual = $11.32 billion, up 46% compared with the same period last year.
→ Adjusted Earnings Per Share (EPS): Actual = $3.03 (analysts’ expectations = $2.87).

The main driver behind these strong results was heightened demand for high-performance memory needed for data centres and AI model training. Micron also published an optimistic outlook, forecasting revenue of between $12.2 billion and $12.8 billion in the next quarter.

Despite strong results and guidance, the share price reaction in the first week after publication has been moderate. Trading volumes were significantly above average, yet the price did not rise. Why?

1 → It is worth noting that Micron shares have nearly doubled in value since the start of 2025, which may indicate “bull fatigue.”

2 → A significant portion of the positive expectations tied to the AI boom is already priced into the current valuation.

Technical analysis shows more bearish signals.

TO VIEW THE FULL ANALYSIS, VISIT FXOPEN BLOG

Disclaimer: This article represents the opinion of the Companies operating under the FXOpen brand only (excluding FXOpen EU). It is not to be construed as an offer, solicitation, or recommendation with respect to products and services provided by the Companies operating under the FXOpen brand, nor is it to be considered financial advice.

Gold Prices Plunge from Historic Peak

As shown by the XAU/USD chart, yesterday gold prices reached a new all-time high, surpassing the $3,870 level for the first time. This rise was supported by concerns over the high likelihood of a US government shutdown.

According to media reports:
→ Vice President J.D. Vance stated that the US is heading towards a government shutdown, blaming the Democrats.
→ “We have very large disagreements,” said Senate Minority Leader Chuck Schumer.

Fears over the potential impact of a shutdown boosted demand for safe-haven assets, including gold. However, today XAU/USD has dropped sharply. What might this mean?

TO VIEW THE FULL ANALYSIS, VISIT FXOPEN BLOG

Disclaimer: This article represents the opinion of the Companies operating under the FXOpen brand only (excluding FXOpen EU). It is not to be construed as an offer, solicitation, or recommendation with respect to products and services provided by the Companies operating under the FXOpen brand, nor is it to be considered financial advice.

What Is a Doji Candle and How May It Be Used in Trading?

A Doji candle is a technical analysis tool that reflects periods of market indecision. It can provide insights when co

nsidered alongside other patterns or technical indicators. Traders often observe Doji candles when trading stocks, commodities, and currencies. This article explains the characteristics of Doji candlesticks and outlines the different types commonly seen on price charts.

What Is a Doji Candle?
A Doji is a pattern that consists of a single candle. It looks very different from other candlesticks; therefore, traders of any level of experience can determine it on a price chart. The Doji has a tiny body comprising equal or almost equal open and close prices and long shadows. What does a Doji candlestick mean? A short body informs traders about the indecision of buyers and sellers as none of them can drive the market. Long shadows reflect a market uncertainty. The longer the shadows, the more significant the market uncertainties.

TO VIEW THE FULL ANALYSIS, VISIT FXOPEN BLOG

Disclaimer: This article represents the opinion of the Companies operating under the FXOpen brand only (excluding FXOpen EU). It is not to be construed as an offer, solicitation, or recommendation with respect to products and services provided by the Companies operating under the FXOpen brand, nor is it to be considered financial advice.

Silver Price: October Kicks Off with a 14-Year High

As the XAG/USD chart shows, today silver prices climbed above the $47.50 per ounce mark for the first time since 2011. Since the beginning of the month, silver has appreciated by approximately 15%.

Why is silver rising?

According to media reports, demand for so-called safe-haven assets has intensified amid the US government shutdown, which officially began on 1 October. President Trump has placed the blame on Democrats, while maintaining optimism that the shutdown could be leveraged to streamline the work of federal agencies.

Trading Economics further highlights that the Silver Institute forecasts a deficit in the global silver market. Production is expected at 844 million ounces – around 100 million ounces short of demand, which continues to be driven by the expansion of solar energy, consumer electronics, and data centres.

TO VIEW THE FULL ANALYSIS, VISIT FXOPEN BLOG

Disclaimer: This article represents the opinion of the Companies operating under the FXOpen brand only (excluding FXOpen EU). It is not to be construed as an offer, solicitation, or recommendation with respect to products and services provided by the Companies operating under the FXOpen brand, nor is it to be considered financial advice.

Pfizer Inc. (PFE) and Other Pharmaceutical Stocks Rise Following Trump’s Decision

According to media reports, US President Donald Trump launched a website allowing Americans to purchase medicines directly. He announced that Pfizer would offer some of its drugs on this platform and introduce new medicines to the US market at reduced prices. Trump added that his administration is working with other companies, including Eli Lilly, to reach “similar agreements.”

Reports state that Pfizer’s deal with the Trump administration will enable patients to receive significant discounts. In return, the company will receive a three-year exemption from any tariffs.

The news pushed pharmaceutical stocks to the top of yesterday’s gainers list:
→ Pfizer Inc. (PFE) rose by 6.8%
→ Merck & Co Inc. (MRK) rose by 6.8%
→ Eli Lilly and Co. (LLY) rose by 5.0%

TO VIEW THE FULL ANALYSIS, VISIT FXOPEN BLOG

Disclaimer: This article represents the opinion of the Companies operating under the FXOpen brand only (excluding FXOpen EU). It is not to be construed as an offer, solicitation, or recommendation with respect to products and services provided by the Companies operating under the FXOpen brand, nor is it to be considered financial advice.

Euro Balances at Strategic Levels: Focus on Macroeconomic Data

The euro is showing mixed dynamics: EUR/USD is consolidating near strategic levels, while EUR/CAD continues its upward movement, supported by Canadian dollar weakness and fluctuations in oil prices. This performance comes amid anticipation of key economic releases: in Europe, the market is focused on PMI and inflation figures, while in the US attention is on private sector employment reports and manufacturing indicators. The threat of a US government shutdown adds uncertainty, heightening investor caution. The direction of further movement will depend on the balance of signals on both sides of the Atlantic: stronger eurozone inflation and softer US data may support the euro, whereas weak European numbers combined with resilient figures from the US/Canada could trigger a deeper correction.

EUR/USD

Last week, EUR/USD found support near 1.1645 and managed to climb back above 1.1700. The bullish momentum observed over three consecutive days has now slowed somewhat. Technical analysis of EUR/USD suggests potential growth towards 1.1780–1.1820, provided 1.1700 holds as support. Should euro sellers succeed in securing a move below 1.1700, the pair might once again test the recent low near 1.1645.

TO VIEW THE FULL ANALYSIS, VISIT FXOPEN BLOG

Disclaimer: This article represents the opinion of the Companies operating under the FXOpen brand only (excluding FXOpen EU). It is not to be construed as an offer, solicitation, or recommendation with respect to products and services provided by the Companies operating under the FXOpen brand, nor is it to be considered financial advice.

Market Analysis: EUR/USD Aims Fresh Increase While USD/CHF Corrects Lower

EUR/USD started a fresh increase above 1.1700. USD/CHF declined from 0.8000 and is now struggling to stay above 0.7945.

Important Takeaways for EUR/USD and USD/CHF Analysis Today

  • The Euro started a decent upward move from 1.1650 against the US Dollar.
  • There was a break above a key bearish trend line with resistance at 1.1700 on the hourly chart of EUR/USD at FXOpen.
  • USD/CHF declined below the 0.7985 and 0.7965 support levels.
  • There is a major bearish trend line forming with resistance near 0.7965 on the hourly chart at FXOpen.

EUR/USD Technical Analysis

On the hourly chart of EUR/USD at FXOpen, the pair started a fresh increase from 1.1650. The Euro cleared 1.1685 to decrease bearish pressure and move into a bullish zone against the US Dollar.

There was a break above a key bearish trend line with resistance at 1.1700. The bulls pushed the pair above the 50-hour simple moving average and 1.1720. It opened the doors for a move above the 50% Fib retracement level of the downward move from the 1.1818 swing high to the 1.1645 low.

TO VIEW THE FULL ANALYSIS, VISIT FXOPEN BLOG

Disclaimer: This article represents the opinion of the Companies operating under the FXOpen brand only (excluding FXOpen EU). It is not to be construed as an offer, solicitation, or recommendation with respect to products and services provided by the Companies operating under the FXOpen brand, nor is it to be considered financial advice.

Hidden Divergence vs Regular Divergence: Basics and Examples

Divergence is a popular tool for spotting potential shifts in market direction. While the general principles for identifying divergence are straightforward, distinguishing between regular and hidden forms can be more complex. In this article, we outline the main differences between regular and hidden divergence and demonstrate how traders may interpret their signals using practical examples.

What Is Divergence?
In technical analysis, the term divergence has two meanings. You may have heard of the MACD indicator. It’s an abbreviation for Moving Average Convergence Divergence. In this case, divergence stands for the movement of two lines relative to each other – they move away from each other. Convergence occurs when the lines move closer together.

The second meaning relates to the topic we will discuss in this article – how the price and the indicator relate to each other. Traders look for divergence between the price and an oscillator, like the relative strength index, stochastic, awesome oscillator, or MACD. It occurs when the market forms an extreme high or low, but the indicator doesn’t follow.

TO VIEW THE FULL ANALYSIS, VISIT FXOPEN BLOG

Disclaimer: This article represents the opinion of the Companies operating under the FXOpen brand only (excluding FXOpen EU). It is not to be construed as an offer, solicitation, or recommendation with respect to products and services provided by the Companies operating under the FXOpen brand, nor is it to be considered financial advice.