Daily Market Analysis By FXOpen

Oil volatility in vogue once again as crude production set to decrease

After a very brief period of stagnation, crude oil prices are once again becoming volatile.

Oil, along with many other raw material commodities which are used as energy sources, has been at the center of discussion for over two years, first of all due to restrictions on supplies caused by logistical channels being hampered by national lockdowns in key markets such as the Antipodes, Europe and North America, swiftly followed by a curtailment of supply by many of Russia’s energy giants to European and American customers during the course of 2022.

This resulted in a huge rise in oil prices across the world, because once again the demand was unable to be met by supply as European settlements to Russian energy companies were unable to be claimed by the suppliers due to sanctions on their Euro-denominated bank accounts, resulting in many customers having to pay for oil via direct settlement to a ruble-denominated bank account in Moscow.

By the summer of last year, the cost of everyday consumer products based on oil such as fuel for motor vehicles rocketed and compounded and already serious cost of living crisis.

This subsequently dwindled and many national governments stepped in to put price caps in place, however that has not been as simple a solution as it may have initially seemed.

The price of crude oil has remained volatile despite the end user cost of fuel and domestic energy having reduced due to a combination of market conditions and government incentives, and this week, a further sudden movement has taken place.

At the end of last week, Brent Crude Oil was heading toward the $80 per barrel mark. By Thursday it had reached $79.2 per barrel, but as the European trading session opened on Friday, this high value suddenly crashed to $75 per barrel.

During the early hours of this morning, the price began to rise substantially again and is now heading toward the $78 mark, largely caused by an announcement that Russian oil firms are going to proceed with the planned cut in oil production by 500,000 barrels a day in March in response to the Western governments imposing price caps on its oil and oil products.

These price caps are bizzare in their nature, in that G7 governments have agreed that all oil from any other oil producing country will be bought at market prices, whereas oil from Russian energy firms should be capped at $45 per barrel.

Of course, Russian energy firms subject to such a cap will not supply oil on those terms, as it would represent a loss-making endeavor, so they will cut the production and not supply regions in which this cap is implemented.

This has caused the price of oil to rise, because there will once again be a supply shortage in Europe.

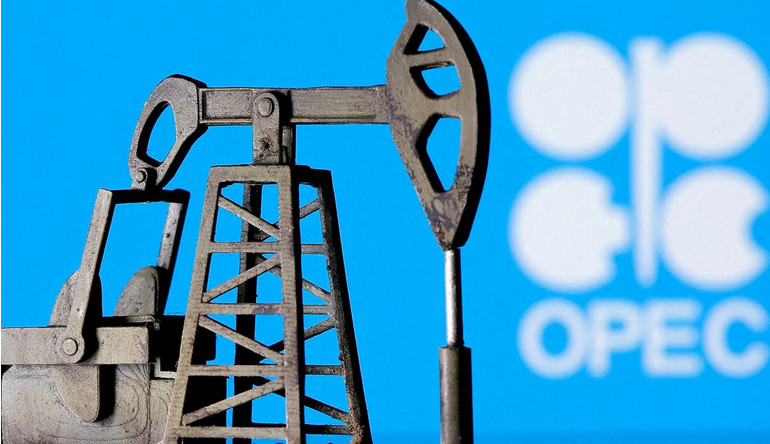
As a coincidence, Additionally, the overall OPEC+ nations last October stated that they would cut oil production targets by 2 million barrels per day until the end of 2023, so this cut by Russian firms in March is a sudden step to curtail production against a wider backdrop of scaling back oil production by the overall OPEC+ bloc of nations.

Supply and demand has always dictated the price of consumable commodities such as oil, and today’s circumstances are no exception.

VIEW FULL ANALYSIS VISIT - FXOpen Blog…

Disclaimer: This Forecast represents FXOpen Companies opinion only, it should not be construed as an offer, invitation or recommendation in respect to FXOpen Companies products and services or as Financial Advice.

8,000 was a pipe dream for the FTSE 100… for now!

It has been clear for almost two years that the FTSE 100 index, which consists of the 100 most prestigious and well capitalized blue-chip companies listed on the London Stock Exchange, has been the exception to the overall direction of most other assets in the United Kingdom.

Whilst the Pound, along with many other business sectors, floundered, and a cost of living crisis engulfed the nation whilst energy prices and the cost of everyday consumables and necessities rocketed due to 50-year highs in inflation, the FTSE 100 remained not only very buoyant but reached unprecedented highs.

Back in mid-2021, euphoric analysts were waxing lyrical on financial news channels in mainstream media about how the FTSE 100 index had broken the 7,000 point barrier. That was during a time at which the British government was lining up its ministers on an almost daily basis to tell the public how intent on locking down the country’s businesses and public on a repeated basis, disabling businesses and impoverishing the general public.

Now, here we are a year and a half later, and whilst the lockdowns have stopped, they have been replaced by geopolitical uncertainty and an intent involvement by the British government in sanctions against one of the world’s largest oil and gas producing country as well as massive public spending during a time of recession in which millions of people are having to tighten their belts and interest rates are four times higher than they were two years ago with inflation still in double digits.

Despite this perhaps alarming backdrop, the FTSE 100 is not only hovering above the 7,000 points mark that it was during the equally surprising trends demonstrated in 2021, but it has been almost reaching 8,000 points!

Just last week, many seasoned analysts in financial institutions had looked toward the 8,000 point mark being reached.

This looked very likely last week, as the value of the FTSE 100 index continued to rise rapidly, but today things have taken a turn.

The FTSE 100 index dropped by 0.68% during the early hours of the London trading session and by 9.00am UK time, it was trading at 7,954 points.

That is still very high and is still at its highest point in over a year apart from last Thursday when it briefly broke through the 8,000 points mark and reached 8012 points which is an all time high.

Whilst it is still very interesting and quite fascinating that these high levels are being reached by the performance of long-established traditional companies that make up the FTSE 100 index in such bleak economic times, the seemingly endless upward surge has stopped and momentum has tailed off.

That it is still high is of course remarkable, but the real news here is that the one economic measure that has been bucking the trend for a long time has begun to stop increasing in value at such a rapid rate.

What is perhaps odd here is that FTSE 100 opened lower this morning even though there has been better than expected news on public sector debt in the United Kingdom - something many people are very worried about - and ahead of a raft of PMI announcements.

It is highly likely that some macro data has affected the values, and the only negative information that has come to light is that medical firm Smith & Nephew announced a drop in annual operating profits as margins dipped.

The global medical technology company said operating profit margins slipped to 8.6% from 11.4% reflecting higher inflation in freight and logistics, the impact of China VBP, as well as sales and marketing expenditure levels returning to more normal levels. However despite this, its stock rose in value by over 6%!

InterContinental Hotels PLC experienced a drop in share value of 2.1%, following its announcement of a forthcoming $750 million share buyback. That is still not much to rock the entire index however.

Perhaps this is just a small blip, but it is definitely one of interest.

VIEW FULL ANALYSIS VISIT - FXOpen Blog…

Disclaimer: This Forecast represents FXOpen Companies opinion only, it should not be construed as an offer, invitation or recommendation in respect to FXOpen Companies products and services or as Financial Advice.

BTCUSD and XRPUSD Technical Analysis – 21st FEB 2023

BTCUSD: Three WHITE Soldiers Pattern Above $22079

Bitcoin was unable to sustain its bearish momentum last week and after touching a low of $22079 the price started to correct upwards against the US dollar, touching a high of $25093 today in the Asian trading session.

We have seen a bullish opening of the markets this week.

We can clearly see the three white soldiers pattern above the $22079 handle which is a bullish reversal pattern because it signifies the end of a downtrend and a shift towards an uptrend.

Bitcoin touched an intraday low of 24681 and an intraday high of 25093 in the Asian trading session today.

We can see that the MACD indicator is back over zero in the weekly time frame indicating bullish trends.

We can see a bullish price crossover with moving average MA50 in the weekly time frame indicating bullish trends.

Both the STOCH and STOCHRSI are indicating overbought levels which means that in the immediate short term, a decline in the prices is expected.

The resistance of the channel is broken in the daily time frame indicating a bullish scenario.

The relative strength index is at 62.08 indicating a STRONG demand for bitcoin, and the continuation of the buying pressure in the markets.

Bitcoin is now moving above its 100 hourly simple moving average and above its 100 hourly exponential moving averages.

Most of the major technical indicators are giving a buy signal, which means that in the immediate short term, we are expecting targets of 25000 and 27500.

The average true range is indicating less market volatility with a strong bullish momentum.

  • Bitcoin: Bullish reversal seen above $22079.
  • The Williams percent range is giving an overbought signal.
  • The price is now trading just below its pivot level of $25005.
  • The short-term range is strongly BULLISH.

Bitcoin: Bullish Reversal Seen Above $22079

The price of bitcoin is marching ahead of the $25000 levels amid improving consumer sentiments and a shift towards a high demand market.

The momentum indicator is back over zero in the 15-minute time frame indicating a bullish outlook.

The MACD crosses up its moving average in the 15-minute time frame.

We can see that the prices have entered into a supper bullish zone and now we are heading towards the $26000 and $27500 levels.

The immediate short-term outlook for bitcoin is strongly bullish, the medium-term outlook has turned bullish, and the long-term outlook remains neutral under present market conditions.

Bitcoin’s support zone is located at $23074 at which the price crosses 18-day moving average stalls, and $23315 which is a pivot point 2nd support point.

The price of BTCUSD is now facing its classic resistance level of 25077 and Fibonacci resistance level of 25120 after which the path towards 26000 will get cleared.

In the last 24hrs, BTCUSD has increased by 2.14% by 524.45$ and has a 24hr trading volume of USD 27.875 billion. We can see a decrease of 2.34% in the trading volume compared to yesterday, which appears to be normal.

The Week Ahead

Bitcoin needs to continue its bullish moves this week, which will further validate the end of the crypto winter and the start of a bullish run for Bitcoin which was long overdue.

There is an ascending channel forming with the current support at $23165 at which the price crosses the 18-day moving average.

The daily RSI is printing at 66.97 which indicates a VERY STRONG demand for bitcoin and the continuation of the bullish phase present in the markets in the short-term range.

We can see the formation of a bullish trend line from $22079 towards the $25265 level.

The price of BTCUSD is now facing its resistance zone located at $25890 which is a pivot point 2nd resistance level and $26017 which is a 3-10 day MACD oscillator stalls.

The weekly outlook is projected at $27000 with a consolidation zone of $26000.

Technical Indicators:

The average directional index (14): is at 32.84 indicating a BUY.

The ultimate oscillator: is at 53.92 indicating a BUY.

The rate of price change: is at 0.979 indicating a BUY.

Bull/bear power (13): is at 204.85 indicating a BUY.

VIEW FULL ANALYSIS VISIT - FXOpen Blog…

Disclaimer: This Forecast represents FXOpen Companies opinion only, it should not be construed as an offer, invitation or recommendation in respect to FXOpen Companies products and services or as Financial Advice.

EUR/USD Turns Red While EUR/JPY Could Rally Further


EUR/USD is struggling below the 1.0700 resistance zone. EUR/JPY is rising and might rally further if it clears the 144.20 resistance zone.

Important Takeaways for EUR/USD and EUR/JPY

· The Euro started a fresh decline below the 1.0700 support zone.

· There is a key bearish trend line forming with resistance near 1.0670 on the hourly chart.

· EUR/JPY started a steady increase after it found support near the 141.50.

· There is a major rising channel forming with support near 143.50 on the hourly chart.

EUR/USD Technical Analysis

The Euro struggled to clear the 1.0800 zone and started a fresh decline against the US Dollar. The EUR/USD pair declined below the 1.0740 support to enter a bearish zone.

There was a clear move below the 1.0700 level and the 50 hourly simple moving average. The pair even declined below the 1.0650 level before correcting a few points. The recent low was formed near 1.0637 on FXOpen and the pair is now correcting higher.

EUR/USD Hourly Chart

On the upside, an immediate resistance is near the 1.0670 level. There is also a key bearish trend line forming with resistance near 1.0670 on the hourly chart.

The trend line is near the 50% Fib retracement level of the recent decline from the 1.0698 swing high to 1.0637 low. The 50 hourly simple moving average is also near the 1.0670 resistance zone. The next major resistance is near the 1.0685 level.

The 76.4% Fib retracement level of the recent decline from the 1.0698 swing high to 1.0637 low is also near 1.0685. The main resistance is near 1.0700. A clear move above the 1.0700 resistance might send the price towards 1.0750. If the bulls remain in action, the pair could visit the 1.0800 resistance zone in the near term.

On the downside, the pair might find support near the 1.0635 level. The next major support sits near the 1.0610 level, below which the pair could even test the 1.0565 support zone.

If there is a downside break below the 1.0565 support, the pair might accelerate lower in the coming sessions. In the stated case, it could even test 1.0520.

VIEW FULL ANALYSIS VISIT - FXOpen Blog…

Disclaimer: This Forecast represents FXOpen Companies opinion only, it should not be construed as an offer, invitation or recommendation in respect to FXOpen Companies products and services or as Financial Advice.

British Pound suddenly jumps against Euro and Dollar in surprise revival

Anyone who has walked the streets of rural England over the past two years would be led to believe that there is no end to the continual economic doom and gloom.

Very concerned residents, combined with news headlines focusing on recessions, cost of living crises, virulent inflation and a noticeable downturn in standards of living would have likely been very visible.

Certainly these are not sentiments without basis. Despite the British calmness, there has definitely been cause for grave concern for many residents of the provincial areas of the country for at least two years now.

London continues to prosper, due to its status as an international capital, unaffected by national ups and downs, as well as being the world’s largest and most developed financial center, hence there have been some very stable stock market trends in the capital despite the backdrop of austerity in the wider United Kingdom.

The decline of the British Pound over the latter period of last year against the US Dollar and Euro was a very concerning dynamic. It clearly demonstrated the woes of Brexit, as well as the clear reality that even a wounded US economy was able to get back on track quicker than the blighted British economy.

Inflation in the United Kingdom remains at around 10.5%, against 6.5% in the United States, and whilst the North American corporations have had their revenues affected by the decrease in inflation in their own domestic market which has meant that they have to pay more to support their European subsidiaries in areas of high inflation, as well as pay suppliers more as the US inflation decreases and European inflation continues to rise, domestic business is doing quite well in various states.

The US Dollar has been holding its own, and has been very strong against the Pound and Euro for many months.

However suddenly the British Pound has arisen from its downward spiral and by yesterday evening, a sudden spike was evident.

At 16.00 during the London trading session, the British Pound had risen from the low 1.21 mark earlier in the day to almost 1.22.

That may seem only a small movement on the face of it, but it is actually the highest point in five days by far, half a percent above the five day moving average.

The same applies to the Pound’s movement against the Euro. Early this morning it suddenly gained ground and reached 1.137, another five day high against a major currency.

The sudden upward surge that the Pound has experienced has now leveled off, but it has not dropped in value to the lows of earlier this week.

One possible explanation for this could be that figures released by the British government yesterday showing stronger customer demand contributed to renewed increases in backlogs of work and employment across the private sector economy during February, therefore alluding to a possible increase in growth for the British economy which has languished for so long.

The Pound’s journey has been interesting over recent months, now the conundrum of whether the British economy is getting itself back on track or not is another item to watch.

VIEW FULL ANALYSIS VISIT - FXOpen Blog…

Disclaimer: This Forecast represents FXOpen Companies opinion only, it should not be construed as an offer, invitation or recommendation in respect to FXOpen Companies products and services or as Financial Advice.

ETHUSD and LTCUSD Technical Analysis – 23rd FEB, 2023

ETHUSD: Hammer Pattern Above $1596

Ethereum was unable to sustain its bearish momentum and after touching a low of 1596 on 22nd Feb, the price started to correct upwards against the US dollar crossing the $1650 handle today in the European trading session.

We have seen a bullish opening of the markets this week.

We can clearly see a hammer pattern above the $1596 handle which is a bullish pattern and signifies the end of a bearish phase and the start of a bullish phase in the markets.

ETH is now trading just below its pivot level of 1666 and moving into a mildly bullish channel. The price of ETHUSD is now testing its classic resistance level of 1669 and Fibonacci resistance level of 1671 after which the path towards 1700 will get cleared.

The relative strength index is at 61.93 indicating a strong demand for Ether and the continuation of the bullish phase in the markets.

We can see the formation of bullish engulfing lines in the daily time frame.

Both the STOCH and STOCHRSI are indicating an overbought market, which means that the prices are expected to decline in the short-term range.

Most of the technical indicators are giving a strong buy market signal.

Most of the moving averages are giving a strong buy signal, and we are now looking at the levels of $1700 to $1750 in the short-term range.

ETH is now trading above its 100 & 200 hourly simple and exponential moving averages.

  • Ether: bullish reversal seen above the $1596 mark.
  • The short-term range appears to be strongly bullish.
  • ETH continues to remain above the $1650 levels.
  • The average true range is indicating less market volatility.

Ether: Bullish Reversal Seen Above $1596

ETHUSD is now moving in a strongly bullish channel with the prices trading above the $1650 handle in the European trading session today.

ETH touched an intraday low of 1637 and an intraday high of 1678 in the Asian trading session today.

The horizontal resistance is broken in the daily time frame, indicating bullish trends.

The MACD crosses up its moving average in the 4-hour time frame indicating bullish nature of the markets.

The Ichimoku – bullish crossover: Tenkan and Kjiun patterns are visible which is a bulish indication of the markets.

The Ichimoku price is over the cloud in the 1-hour time frame indicating a bullish scenario.

The Aroon indicator is giving a bullish trend in the 15-minute time frame.

The key support levels to watch are $1603 which is a 50% retracement from a 4-week high/low, and $1631 at which the price crosses the 9-day moving average.

ETH has increased by 1.84% with a price change of 30.19$ in the past 24hrs and has a trading volume of 8.818 billion USD.

We can see an increase of 1.15% in the total trading volume in the last 24 hrs which appears to be normal.

The Week Ahead

ETH’s price continues to remain in a bullish zone against the US dollar and bitcoin. ETHUSD is expected to move higher towards the $1700 and $1800 levels this week.

On the upside we are now looking at the immediate targets of 1724 which is a pivot point 3rd level resistance, and 1741 which is a 13-week high.

The immediate short-term outlook for Ether has turned strongly bullish, the medium-term outlook has turned bullish, and the long-term outlook for Ether is neutral in present market conditions.

The price of ETHUSD will need to remain above the important support level of $1628 which is a pivot point.

The weekly outlook is projected at $1800 with a consolidation zone of $1750.
VIEW FULL ANALYSIS VISIT - FXOpen Blog…

Disclaimer: This Forecast represents FXOpen Companies opinion only, it should not be construed as an offer, invitation or recommendation in respect to FXOpen Companies products and services or as Financial Advice.

Gold Price Faces Hurdles And Crude Oil Price Could Recover Steadily

Gold price declined from the $1,850 resistance zone. Crude oil price is attempting a recovery wave above the $75.50 resistance zone.

Important Takeaways for Gold and Oil

· Gold price started a strong decline below the $1,832 level against the US Dollar.

· A key bearish trend line is forming with resistance near $1,835 on the hourly chart of gold.

· Crude oil price started a fresh increase from the $73.75 support zone.

· There was a break above a major bearish trend line with resistance near $75.70 on the hourly chart of XTI/USD.

Gold Price Technical Analysis

Gold price struggled to clear the $1,850 resistance against the US Dollar. The price started a strong decline and traded below the $1,832 support zone.

The bears even pushed the price below $1,825 and the 50 hourly simple moving average. The price traded below the $1,820 level. A low is formed near $1,817 on FXOpen and the price is now consolidating losses. On the upside, an immediate resistance is near the $1,828 level or the 50 hourly simple moving average.

Gold Price Hourly Chart

The stated level is near the 38.2% Fib retracement level of the downward move from the $1,846 swing high to $1,817 low. The next key hurdle is near the $1,832 level.

There is also a key bearish trend line is forming with resistance near $1,835 on the hourly chart of gold. The trend line is near the 50% Fib retracement level of the downward move from the $1,846 swing high to $1,817 low.

A clear upside break above the $1,835 resistance could send the price towards $1,850. If there is no upside break, the price might correct lower.

An immediate support on the downside is near the $1,820 level. The next major support is near the $1,812 level, below which there is a risk of a larger decline. In the stated case, the price could decline sharply towards the $1,800 support zone.

VIEW FULL ANALYSIS VISIT - FXOpen Blog…

Disclaimer: This Forecast represents FXOpen Companies opinion only, it should not be construed as an offer, invitation or recommendation in respect to FXOpen Companies products and services or as Financial Advice.

Watch FXOpen’s February 20 - 24 Weekly Market Wrap Video

In this video, FXOpen UK COO Gary Thomson sums up the week’s happenings and discusses the most significant news reports.

  • Oil volatility in vogue once again as crude production set to decrease
  • 8,000 was a pipe dream for the FTSE 100… for now!
  • British pound suddenly jumps against euro and dollar in surprise revival
  • Minutes of the Fed meeting show determination to further increase the rate

Watch our short and informative video, and stay updated with FXOpen.

FXOpen YouTube

Disclaimer: This forecast represents FXOpen Companies opinion only, it should not be construed as an offer, invitation or recommendation in respect to FXOpen Companies products and services or as financial advice.

#fxopen #fxopenyoutube #fxopenuk #weeklyvideo

GBP/USD Declines Heavily While EUR/GBP Attempts Recovery


GBP/USD started a fresh decline below the 1.2200 support zone. EUR/GBP is rising and trading above the 0.8920 support zone.

Important Takeaways for GBP/USD and EUR/GBP

· The British Pound started a fresh decline from the 1.2150 resistance against the US Dollar.

· There is a major bearish trend line forming with resistance near 1.2000 on the hourly chart of GBP/USD.

· EUR/GBP found support near 0.8780 and is currently recovering higher.

· There is a key bullish trend line forming with support near 0.8805 on the hourly chart.

GBP/USD Technical Analysis

The British Pound started a major decline from the 1.2150 resistance zone against the US Dollar. The GBP/USD pair gained pace below the 1.2050 level to move into a bearish zone.

There was a clear move below the 1.2000 level and the 50 hourly simple moving average. The bears even pumped the price below the 1.1950 level and a low is formed near 1.1928 on FXOpen. It is now consolidating losses and trading below the 1.2000 level.

GBP/USD Hourly Chart

On the upside, an initial resistance is near the 1.1985 level. It is near the 50% Fib retracement level of the downward move from the 1.2041 swing high to 1.1928 low.

The first major resistance is near the 1.2000 level. There is also a major bearish trend line forming with resistance near 1.2000 on the hourly chart of GBP/USD. The trend line is near the 61.8% Fib retracement level of the downward move from the 1.2041 swing high to 1.1928 low.

A clear move above the 1.2000 level could spark a decent increase. The next major resistance sits near the 1.2020 level. Any more gains might send the pair towards the 1.2100 resistance zone.

On the downside, an initial support is near the 1.1925 level. The next major support is near the 1.1880 level. Any more losses could lead the pair towards the 1.1800 support zone.

Disclaimer: This Forecast represents FXOpen Companies opinion only, it should not be construed as an offer, invitation or recommendation in respect to FXOpen Companies products and services or as Financial Advice.

Things are beginning to look up for the British Pound

The British Pound, which for many years was a bastion of solidity, its position as the world’s most valuable sovereign currency giving it a unique status among other majors, and its low volatility giving it a guilt-edged reputation for low volatility and dependable long term value.

That all changed during the course of last year, when the combined result of the United Kingdom’s exit from the European Union, one and a half years of lockdowns, and involvement in global geopolitical affairs along with a cost of living crisis which is now over a year long, resulted in the British Pound sliding down to very low points against the Euro and US Dollar over a period of several weeks.

As 2023 began, this constant reduction in value began to subside and volatility began, with the Pound sometimes regaining ground against the Dollar and Euro despite the clear economic concerns about the recession-bound British economy.

Today, a little more volatility has been demonstrated, and the Pound rose this morning quite noticeably against the US Dollar, going from 1.19 to the high 1.20 range within an hour of the London markets opening.

This may be the result of a few interesting factors, one of which may be the Office of National Statistics (ONS) having released data that the value of total goods imports into the United Kingdom increased by £155.5 billion (32.3%) and the value of total goods exports increased by £66.2 billion (20.8%) in 2022 when compared with 2021, which is an interesting and confidence-inspiring metric considering 2022’s poor economic outlook for the country.

Perhaps the most pragmatic way to view this is that imports did grow, but that is compared to 2021 when supply chain restrictions and lockdowns impeded imports, and consumers were saving their money due to uncertainty about the reopening of the economy.

Either way, this is a positive direction and the Pound is responding in line with it.

Additionally, as London continues to be an international financial and economic powerhouse despite the woes in the rest of the country, global consultancy EY has released figures which forecast that London’s economy is on track to expand 2.6 per cent each year between 2024 and 2026, pushing it to the top of the countrywide growth table.

Perhaps it is fair to assume that if this is the case, London is continuing to expand its economy despite the struggles in the provincial areas, denoting two distinctly different economic structures in one country.

London’s standing as a global financial capital with the world’s best infrastructure for Tier 1 trading bodes well for growth as international business is the backbone of the city’s financial ecosystem, therefore an increase in the value of the Pound on the back of such a report is perhaps to be expected.

Certainly despite London’s GDP being expected to undergo a minor slowdown, shrinking 0.2 per cent this year, also the lowest of any region, it is tipped to race past Britain’s average yearly growth of 2.1 per cent between 2024 and 2026.

Therefore the analysis depicts volatility, and the national currency is echoing it very clearly.

VIEW FULL ANALYSIS VISIT - FXOpen Blog…

Disclaimer: This Forecast represents FXOpen Companies opinion only, it should not be construed as an offer, invitation or recommendation in respect to FXOpen Companies products and services or as Financial Advice.

BTCUSD and XRPUSD Technical Analysis – 28th FEB 2023

BTCUSD: Bullish Doji Star Pattern Above $22796

Bitcoin was unable to sustain its bearish momentum last week and after touching a low of $22796 on 25th Feb the prices started to correct upwards against the US dollar, touching a high of $23873 on 27th Feb.

We have seen a bearish opening of the markets this week.

We can clearly see a bullish Doji star pattern above the $22796 handle which is a bullish reversal pattern because it signifies the end of a downtrend and a shift towards an uptrend.

Bitcoin touched an intraday high of 23557 in the Asian trading session, and an intraday low of 23214 in the European trading session today.

We can see that the MACD indicator is back over zero in the weekly time frame indicating bullish trends.

The price of bitcoin is ranging near horizontal support in the weekly time frame indicating a bullish trend.

Both the STOCH and STOCHRSI are indicating Overbought levels which means that in the immediate short term, a decline in the prices is expected.

The price of bitcoin is ranging near the support of the channel in the 15-minute time frame indicating a bullish scenario.

The relative strength index is at 55.00 indicating a strong demand for bitcoin, and the continuation of the buying pressure in the markets.

Bitcoin is now moving below its 100 hourly simple moving average and below its 100 hourly exponential moving averages.

Most of the major technical indicators are giving a buy signal, which means that in the immediate short term, we are expecting targets of 24000 and 25500.

The average true range is indicating less market volatility with a bullish momentum.

  • Bitcoin: bullish reversal seen above $22796.
  • The Williams percent range is giving an overbought signal.
  • The price is now trading just below its pivot level of $23729.
  • The short-term range is mildly BULLISH.

Bitcoin: Bullish Reversal Seen Above $22796

The price of bitcoin is now moving into a consolidation channel below the $23500 handle which also means that now we are preparing for the next upwards move in bitcoin towards the $25000 level.

The commodity channel index indicator is giving an oversold signal which indicates a neutral tone in the markets.

Some of the technical indicators are also giving a neutral tone present in the markets.

Bitcoin has resumed its rising trend channel with a positive momentum that is building at levels above the $23110.

The immediate short-term outlook for bitcoin is strongly bullish, the medium-term outlook has turned bullish, and the long-term outlook remains neutral under present market conditions.

Bitcoin’s support zone is located at $22711 which is a 14-day RSI at 50% and at $22893 which is a 3-10 day MACD oscillator stalls.

The price of BTCUSD is now facing its classic resistance level of 24948 and Fibonacci resistance level of 26119 after which the path towards 27000 will get cleared.

In the last 24hrs, BTCUSD has increased by 0.58% by 135.92$ and has a 24hr trading volume of USD 22.280 billion. We can see a decrease of 2.34% in the trading volume as compared to yesterday, which appears to be normal.

The Week Ahead

We can see that the price of bitcoin is now almost 53% up against the lows formed in November 2022.

The consolidation in the levels of bitcoin also indicates that the global investor sentiment continues to improve and will lead to the higher price of bitcoin in the month of March 2023.

The daily RSI is printing at 50.79 which indicates a neutral demand for bitcoin and the continuation of the bullish phase present in the markets in the short-term range.

We can see the formation of a bullish trend line from $22796 towards the $23989 level.

The price of BTCUSD is now facing its resistance zone located at $24030 at which the price crosses 9-day moving average and $24095 which is a 14-3 day raw stochastic at 70%

The weekly outlook is projected at $24500 with a consolidation zone of $24000.

VIEW FULL ANALYSIS VISIT - FXOpen Blog…

Disclaimer: This Forecast represents FXOpen Companies opinion only, it should not be construed as an offer, invitation or recommendation in respect to FXOpen Companies products and services or as Financial Advice.

EUR/USD Eyes Recovery While USD/JPY Remains In Uptrend

EUR/USD is correcting higher from the 1.0520 zone. USD/JPY is also rising and might rally further above the 137.00 resistance.

Important Takeaways for EUR/USD and USD/JPY

· The Euro started an upside correction above the 1.0550 resistance zone.

· There was a break above a key bearish trend line with resistance near 1.0570 on the hourly chart of EUR/USD.

· USD/JPY is showing a lot of bullish signs above the 135.80 support zone.

· There is a major bullish trend line forming with support near 135.80 on the hourly chart.

EUR/USD Technical Analysis

This past week, the Euro saw bearish moves below the 1.0600 support against the US Dollar. The EUR/USD pair even broke the 1.0580 support zone.

The pair gained pace below the 1.0550 support zone and traded as low as 1.0532 on FXOpen. The pair started an upside correction and traded above the 1.0550 resistance. There was a clear move above the 1.0580 level.

EUR/USD Hourly Chart

Besides, there was a break above a key bearish trend line with resistance near 1.0570 on the hourly chart of EUR/USD. A high was formed near 1.0645 and the pair started a fresh decline. There was a clear move below the 1.0600 support zone, but the pair stayed above the 50 hourly simple moving average.

There was a spike below the 61.8% Fib retracement level of the upward move from the 1.0532 swing low to 1.0645 high. It is now consolidating near the 1.0590 level.

On the upside, an immediate resistance is near the 1.0600 level. The next major resistance is near the 1.0640 level. An upside break above 1.0640 could set the pace for another increase. In the stated case, the pair might visit 1.0700.

Any more gains might send the pair towards 1.0750. If not, it could continue to move down. An initial support on the downside is near the 1.0570 level. The first major support is near the 1.0550 level.

The main support sits near the 1.0535 zone, below which the pair could start a major decline. In the stated case, the pair might dive towards the 1.0450 support zone.

VIEW FULL ANALYSIS VISIT - FXOpen Blog…

Disclaimer: This Forecast represents FXOpen Companies opinion only, it should not be construed as an offer, invitation or recommendation in respect to FXOpen Companies products and services or as Financial Advice.

ETHUSD and LTCUSD Technical Analysis – 02nd MAR, 2023

ETHUSD: Three White Soldiers Pattern Above $1558

Ethereum was unable to sustain its bearish momentum and after touching a low of $1558 on 25th Feb, the prices started to correct upwards against the US dollar ranging above the $1640 handle today in the Asian trading session.

The prices of Ethereum are ranging near a new record high of 1 month.

The price of ETHUSD is back over the pivot point in the weekly time frame indicating a bullish scenario.

We can clearly see a three white soldiers pattern above the $1558 handle which is a bullish pattern and signifies the end of a bearish phase and the start of a bullish phase in the markets.

ETH is now trading just above its pivot level of 1645 and moving into a mildly bullish channel. The price of ETHUSD is now testing its classic resistance level of 1650 and Fibonacci resistance level of 1656 after which the path towards 1700 will get cleared.

We can see the formation of the bullish harami pattern in the weekly timeframe.

The relative strength index is at 52.40 indicating a neutral demand for Ether and a shift towards the consolidation phase in the markets.

The commodity channel index, CCI, is giving a neutral signal, which means that the prices are expected to remain in a consolidation phase.

Some of the technical indicators are giving a buy market signal.

Most of the moving averages are giving a buy signal at the current market level of $1645.

ETH is now trading above both the 100 hourly simple and 100 hourly exponential moving averages.

  • Ether: bullish reversal seen above the $1558 mark.
  • The short-term range appears to be mildly bullish.
  • ETH continues to remain above the $1640 level.
  • The average true range is indicating less market volatility.

Ether: Bullish Reversal Seen Above $1558

ETHUSD continues to consolidate its gains and is now moving above the $1600 handle with an upside focus of $1700 and $1800 levels.

We can see the formation of the bullish trend reversal pattern with moving averages MA20 in the daily time frame.

The resistance of the channel is broken in the 15-minute time frame indicating a bullish outlook present in the markets.

ETHUSD touched an intraday high of 1677 in the Asian trading session and an intraday low of 1638 in the London trading session today.

The key support levels to watch are $1593 which is a 14-day RSI at 40%, and at $1637 at which the price crosses 18-day moving average stalls.

ETH has decreased by 0.73% with a price change of 12.10$ in the past 24hrs and has a trading volume of 6.909 billion USD.

We can see a decrease of 11.89% in the total trading volume in the last 24 hrs which is due to the market consolidation.

The Week Ahead

ETH has retracted after touching a high of $1677, and after this consolidation phase gets over, we are looking to cross the $1700 handle.

We can see the formation of a bullish ascending channel from $1558 towards the $1691 level.

The immediate short-term outlook for Ether has turned mildly bullish, the medium-term outlook has turned bullish, and the long-term outlook for Ether is neutral in present market conditions.

The resistance zone is located at $1686 which is a 14-3 day raw stochastic at 80% and at $1694 at which the price crosses 9-day moving average stalls.

The weekly outlook is projected at $1750 with a consolidation zone of $1700.
VIEW FULL ANALYSIS VISIT - FXOpen Blog…

Disclaimer: This Forecast represents FXOpen Companies opinion only, it should not be construed as an offer, invitation or recommendation in respect to FXOpen Companies products and services or as Financial Advice.

AUD/USD Aims Recovery While NZD/USD Remains In Uptrend

AUD/USD declined below the 0.6780 level before it found support near 0.6700. NZD/USD is rising and might aim a move above the 0.6250 resistance.

Important Takeaways for AUD/USD and NZD/USD

· The Aussie Dollar started a fresh decline from the 0.6840 resistance against the US Dollar.

· There is a key bearish trend line forming with resistance near 0.6755 on the hourly chart of AUD/USD.

· NZD/USD started a decent increase above the 0.6150 resistance zone.

· There is a major bullish trend line forming with support near 0.6220 on the hourly chart of NZD/USD.

AUD/USD Technical Analysis

The Aussie Dollar started a major decline from the 0.6840 resistance zone against the US Dollar. The AUD/USD pair declined below the 0.6800 and 0.6780 level.

The pair even moved below the 0.6750 level and the 50 hourly simple moving average. A low was formed near the 0.6706 on FXOpen and the pair is now recovering losses. The pair is now trading near the 0.6750 resistance zone and the 50 hourly simple moving average.

AUD/USD Hourly Chart

On the upside, the AUD/USD pair is facing resistance near the 0.6750 level. It is near the 50% Fib retracement level of the downward move from the 0.6783 swing high to 0.6706 low.

The next major resistance is near the 0.6755 level. There is also a key bearish trend line forming with resistance near 0.6755 on the hourly chart of AUD/USD. The trend line is near the 61.8% Fib retracement level of the downward move from the 0.6783 swing high to 0.6706 low.

A close above the 0.6755 level could start another steady increase in the near term. The next major resistance could be 0.6800.

On the downside, an initial support is near the 0.6725 level. The next support could be the 0.6700 level. If there is a downside break below the 0.6700 support, the pair could extend its decline towards the 0.6665 level.

VIEW FULL ANALYSIS VISIT - FXOpen Blog…

Disclaimer: This Forecast represents FXOpen Companies opinion only, it should not be construed as an offer, invitation or recommendation in respect to FXOpen Companies products and services or as Financial Advice.

Watch FXOpen’s February 27 - March 3 Weekly Market Wrap Video

In this video, FXOpen UK COO Gary Thomson sums up the week’s happenings and discusses the most significant news reports.

  • US indices post worst week of 2023
  • SEC continues to put pressure on the crypto market
  • February removes the January positive
  • GBPUSD: Bearish pattern and CBR uncertainty

Watch our short and informative video, and stay updated with FXOpen.

FXOpen YouTube

Disclaimer: This forecast represents FXOpen Companies opinion only, it should not be construed as an offer, invitation or recommendation in respect to FXOpen Companies products and services or as financial advice.

#fxopen #fxopenyoutube #fxopenuk #weeklyvideo

GBP/USD Starts Recovery While USD/CAD Faces Key Resistance


GBP/USD is correcting losses and trading above the 1.2000 zone. USD/CAD is struggling to clear the 1.3650 resistance zone.

Important Takeaways for GBP/USD and USD/CAD

· The British Pound started a decent recovery wave above the 1.2000 resistance zone.

· There was a break above a key bearish trend line with resistance near 1.1965 on the hourly chart of GBP/USD.

· USD/CAD is struggling below the 1.3640 and 1.3650 support levels.

· There is a major bearish trend line forming with resistance near 1.3640 on the hourly chart.

GBP/USD Technical Analysis

The British Pound started a fresh decline from well above 1.2120 against the US Dollar. The GBP/USD pair gained bearish momentum after there was a break below the 1.2050 support.

The pair even broke the 1.2000 support level and the 50 hourly simple moving average. The recent swing high was formed near 1.1925 on FXOpen before the price started an upside correction. There was a move above the 1.1980 level.

GBP/USD Hourly Chart

There was a break above a key bearish trend line with resistance near 1.1965 on the hourly chart of GBP/USD. Besides, there was a move above the 50% Fib retracement level of the downward move from the 1.2142 swing high to 1.1925 low.

An immediate resistance is near the 1.2050 level. It is near the 61.8% Fib retracement level of the downward move from the 1.2142 swing high to 1.1925 low.

The next major resistance is near the 1.2080 level. Any more gains could lead the pair towards the 1.2120 barrier in the near term. If not, the pair could move down and might break the 1.2000 support. The next major support is near 1.1980.

If there is a downside break, GBP/USD might test the 1.1920 support. The next major support sits at 1.1850, where the bulls might take a stand.
VIEW FULL ANALYSIS VISIT - FXOpen Blog…

Disclaimer: This Forecast represents FXOpen Companies opinion only, it should not be construed as an offer, invitation or recommendation in respect to FXOpen Companies products and services or as Financial Advice.

Inflation top of the agenda as Euro slumps

The rampant inflation that has blighted the everyday lives of European citizens for over a year has now reached the high profile dialog of Christine Lagarde.

Ms. Lagarde, who is the President of the European Central Bank, has publicly stated that "inflation is a monster that we need to knock on the head”.

This may appear an obvious remark considering that consumers and businesses across Western Europe have been faced with inflation levels at around 10% to 11% for almost a year now, and in parts of Eastern Europe over 25% which has resulted in discernible levels of hardship for many citizens and businesses.

Perhaps the most concerning part of Ms. Lagarde’s direction on this matter is that she, along with many other central bankers across the Western world who are charged with the responsibility of managing inflation levels in the markets over which they preside, views interest rate increases as a solution.

This is a well-worn method of curtailing consumer spending and putting a stop to consumer borrowing, however it is also a generator of barriers to economic strength in that many members of the public can often become disenfranchised by being unable to afford to buy a house due to mortgage payment increases that are not in line with their earnings, and those who already have a mortgage feel the pinch as they have to find extra money to cover the increasing payments and spend less on other items.

Ms. Lagarde explained to press in Spain this week that the European Central Bank is not seeking to “break the economy” with rate increases as she appealed for banks to reschedule debt repayments for households struggling to cope with soaring borrowing costs on variable-rate mortgages.

That perhaps is one soundbite which attempts to try to soothe the fears of borrowers but ultimately the message remains that interest rates are increasing and have been for over a year now.

The Euro is now at almost parity with the US Dollar, this morning weighing in at 1.06, against a backdrop of US inflation having decreased from double figures last year to around 7% in recent weeks.

Of course, US inflation having decreased has its own disadvantages for US-based multinational businesses as they have to now pay more to supply and operate their European subsidiaries, however overall the domestic US economy appears to be settling down and the depreciation of the currency against everyday life expenses is nowhere near at European or British levels.

Certainly volatility is in the air for the Euro and likely the Pound too, as the British inflation level and monetary policy appears to resemble that of mainland Western Europe.

VIEW FULL ANALYSIS VISIT - FXOpen Blog…

Disclaimer: This Forecast represents FXOpen Companies opinion only, it should not be construed as an offer, invitation or recommendation in respect to FXOpen Companies products and services or as Financial Advice.

BTCUSD and XRPUSD Technical Analysis – 07th MAR 2023

BTCUSD: Evening Star Pattern Below $23963

Bitcoin was unable to sustain its bullish momentum last week and after touching a high of $23963 on 01st March, the prices started to correct downwards against the US dollar, touching a low of $22048 on 03rd March.

We have seen a bearish opening of the markets this week.

We can clearly see an evening star pattern below the $23963 handle which is a bearish reversal pattern because it signifies the end of an uptrend and a shift towards a downtrend.

Bitcoin touched an intraday high of 22544 in the Asian trading session, and an intraday low of 23370 in the European trading session today.

The momentum indicator is back under zero in the 4-hour time frame indicating bearish trends.

The price of bitcoin is ranging near a new record low of 1 month.

Both the STOCH and Williams percent range are indicating overbought levels which means that in the immediate short term, a decline in the prices is expected.

We can see the formation of bearish engulfing lines in the 1-hour time frame.

The relative strength index is at 43.75 indicating a weak demand for bitcoin, and the continuation of the selling pressure in the markets.

Bitcoin is now moving below its 100 hourly simple moving average and below its 100 hourly exponential moving averages.

Most of the major technical indicators are giving a sell signal, which means that in the immediate short term, we are expecting targets of 22000 and 21500.

The average true range is indicating less market volatility with a bearish momentum.

  • Bitcoin: bearish reversal seen below $23963.
  • The STOCHRSI is indicating an oversold market.
  • The price is now trading just below its pivot level of $22414.
  • The short-term range is mildly bearish.

Bitcoin: Bearish Reversal Seen Below $23963

The price of bitcoin is now moving in a consolidation channel above the $22000 handle after which fresh declines could be expected, or we can see some market correction upwards if the demand for bitcoin increases in the global markets.

Some of the technical indicators are also giving a neutral tone present in the markets.

We can see the formation of a bearish price crossover pattern with the adaptive moving average, AMA 50, in the 30-minute time frame.

The price of bitcoin is ranging near the resistance of the channel indicating a bearish trend present in the markets.

The immediate short-term outlook for bitcoin is strongly bearish, the medium-term outlook has turned bearish, and the long-term outlook remains neutral under present market conditions.

Bitcoin’s support zone is located at $21780 which is a 3-10 day MACD oscillator stalls, and at $21851 at which the price crosses 18-day moving average stalls.

The price of BTCUSD is now facing its classic support level of 22376 and Fibonacci support level of 22404 after which the path towards 22000 will get cleared.

In the last 24hrs, BTCUSD has increased by 0.03% by 5.75$ and has a 24hr trading volume of USD 15.799 billion. We can see an increase of 1208% in the trading volume compared to yesterday, which appears to be normal.

The Week Ahead

We can see that the price of Bitcoin has resumed its downtrend, which may extend to $21500 after which we may see some correction and change in the trend present in the markets.

There is a descending channel forming with the current support located at $20785 which is a 50% retracement from a 13-week high/low.

The daily RSI is printing at 43.26 which indicates a weak demand for bitcoin and the continuation of the bearish phase present in the markets in the short-term range.

We can see the formation of a bearish trendline from $23963 towards the $22141 level.

The price of BTCUSD is now facing its resistance zone located at $22695 which is a 14-3 day raw stochastic at 20% and at $22774 which is a 14-day RSI at 50%

The weekly outlook is projected at $21500 with a consolidation zone of $22000.

VIEW FULL ANALYSIS VISIT - FXOpen Blog…

Disclaimer: This Forecast represents FXOpen Companies opinion only, it should not be construed as an offer, invitation or recommendation in respect to FXOpen Companies products and services or as Financial Advice.

EUR/USD Gains Bearish Momentum While USD/CHF Extends Rally


EUR/USD started a major decline below the 1.0620 level. USD/CHF is rising and might aim more gains above the 0.9450 resistance.

Important Takeaways for EUR/USD and USD/CHF

· The Euro started a fresh decline from the 1.0700 resistance against the US Dollar.

· There was a break below a key bullish trend line with support near 1.0620 on the hourly chart of EUR/USD.

· USD/CHF started a fresh increase above the 0.9350 resistance zone.

· There was a break above a major bearish trend line with resistance near 0.9315 on the hourly chart.

EUR/USD Technical Analysis

After struggling to clear the 1.0700 resistance, the Euro started a fresh decline against the US Dollar. The EUR/USD pair traded below the 1.0620 support zone to enter a bearish zone.

The pair even declined below the 1.0600 level above the 50 hourly simple moving average. There was also a break below a key bullish trend line with support near 1.0620 on the hourly chart of EUR/USD. The decline gained pace below the 1.0580 level.

EUR/USD Hourly Chart

A low is formed near 1.0531 on FXOpen and the pair is now showing a lot of bearish signs. An immediate resistance is near the 1.0570 level. It is near the 23.6% Fib retracement level of the downward move from the 1.0694 swing high to 1.0531 low.

The next major resistance is near the 1.0610 level. It is near the 50% Fib retracement level of the downward move from the 1.0694 swing high to 1.0531 low.

A clear move above the 1.0610 resistance zone could send the pair further higher. Any more gains might open the doors for a move towards the 1.0650 level. If there is no recovery, the pair might continue to move down below the 1.0530 level.

On the downside, an immediate support is near the 1.0520 level. The next major support is near the 1.0500 level. A downside break below the 1.0500 support could start steady decline towards the 1.0450 level.
VIEW FULL ANALYSIS VISIT - FXOpen Blog…

Disclaimer: This Forecast represents FXOpen Companies opinion only, it should not be construed as an offer, invitation or recommendation in respect to FXOpen Companies products and services or as Financial Advice.

Euro hits one-month low against the US Dollar

It could be fair to say that the US Dollar, and the wider economy across the United States is an anomaly and has been for over a year.

Despite the same lockdowns in many major centers as other Western economies, the same supply chain difficulties disabling all sectors of industry to the same extent as that of Western Europe, and a similar approach toward involvement in geopolitical matters between the West and Russia, the American economy is not in anything like the bad condition experienced in other regions.

To compound this oddity further, the US Dollar has retained a very strong position against all other major currencies throughout the entirety of last year.

Yesterday, the US Dollar has shown its strength again, as the Euro has fallen to a one-month low against the greenback, with the rate now being at the low end of the 1.05 range during the early hours of the European trading session.

Some data released on Tuesday has put a dampener on the value of the Euro, one such metric being that retail sales within the Euro-denominated area, a good proxy for consumer demand, rebounded much less than expected in January, challenging other data, including PMI surveys, which pointed to a steady recovery.

Energy prices are continuing to soar across Europe, contributing massively to the overall increases in cost of living, which in some areas of Eastern Europe is compounded by inflation rates at over 25%, meaning that spending is outstripping earnings on a continual basis.

In Western Europe, the 10% average inflation is still a major barrier to economic stability and growth, whilst in the United States, the levels of inflation have been reducing over the past 6 months and are now at around 6%.

Manufacturing and productivity in the United States remained at least partially open during 2020 and 2021 with the states of Florida and Texas not conducting lockdowns. These are both heavily industrialised states and aside from their existing high technology, medical products, agricultural, energy production and scientific research sectors, attracted many other businesses from across the United States which relocated their offices to these states during 2021 and 2022.

This could be a contributor to the strength of the US dollar by comparison to the Euro, as the entire Eurozone limped in and out of lockdowns for almost 2 years and now the piper has to be paid.

Retail sales rose 0.3% on the month, below the 1% rise forecast by economists, and were down 2.3% year on year, demonstrating that this stagnation is continuing, and with more interest rate rises on the horizon, the belt is tight.

VIEW FULL ANALYSIS VISIT - FXOpen Blog…

Disclaimer: This Forecast represents FXOpen Companies opinion only, it should not be construed as an offer, invitation or recommendation in respect to FXOpen Companies products and services or as Financial Advice.