Daily Market Analysis by IC Markets

EUR/USD:

[B]Daily TF.[/B]
Daily supply at 1.37342-1.36890 has more than proved itself here with the buyers showing very little interest at the moment. Buyers will more than likely show their selves around daily demand below at 1.34770-1.35557 which will obviously be the first trouble area for the sellers.


[B]4hr TF.[/B]
The decision point level marked with an x at 1.36454 did hold price up for a while where a minor bullish reaction was seen as reported may happen in the last analysis. During NFP price broke this level south, hitting the round number just below at 1.36000 where price is currently seen trading at the moment.

If price continues on its bearish path, we may well see the buyers at the round number (level above) consumed, meaning the path south will likely be clear to hit 4hr demand below at 1.35036-1.35312. Why will the path be clear? Take a look at the small trendline to the left, it appears pro money have consumed the majority of the buyers lurking around this area, as once price rallied, it then spiked down to consume what buyers were left, hence the expectation of a clear path.

At the time of writing, price is capped between the round number 1.36000 as acting support, and the decision point level marked with an x at 1.36454 as acting resistance.

[B]Pending/P.A confirmation orders:[/B]

[ul]
[li][B]No pending buy orders [/B](Green line) are seen in the current market environment.[/li][li][B]P.A confirmation buy orders [/B](Red line) are seen just above demand (1.35036-1.35312) at 1.35433. The reason behind us placing a P.A confirmation buy order here, rather than a pending buy order is because the aforementioned demand area appears weak as deep spikes have been seen recently (marked with two arrows), and also the circled tail/spike could have cleared out the majority of buy orders as it left on its advance.[/li][li][B]The P.A confirmation buy order [/B](Red line) set just above the round number 1.36000 at 1.36052[B]is now active. The buyers will need to confirm this level by consuming some of the sellers in and around the S/R flip level at 1.36666 for a pending buy order to be set awaiting a possible retracement.[/B][/li][li][B]The pending sell order[/B] (Green line) set at 1.36955 just below supply at 1.37235-1.37005 [B]has now been closed in full profit with price hitting our second and final take-profit level at the round number 1.36000.[/B][/li][li][B]Pending sell orders [/B](Green line) are seen just below supply (1.37749-1.37450) at 1.37414. A pending sell order is set here as we believe this 4hr supply is good for at least a bounce as it still remains fresh/untouched.[/li][/ul]


[B]Quick Recap:[/B]
The daily timeframe shows the sellers have taken control for the time being from around daily supply at 1.37342-1.36890, while on the 4hr timeframe, our short position up from 4hr supply (1.37235-1.37005) at 1.36955 has hit its second and final target below at the round number 1.36000, which in turn triggered our P.A confirmation buy order set at 1.36052. Buyers will need to prove this level by consuming some or most of the sellers around the S/R flip level at 1.36666 above before a pending buy order is even considered.
However, if price breaks the round number (south) just mentioned, we will very likely see a touch at the 4hr demand (1.35036-1.35312) below may be later on today sometime or early next week.

[ul]
[li][B]Areas to watch for buy orders:[/B] [B]P.O:[/B] No pending buy orders are seen in the current market environment. [B]P.A.C: [/B]1.35433 (SL: Dependent on price action after the level has been confirmed TP: Dependent on approaching price action after the level has been confirmed) 1.36052 [B]([/B][B]Active-awaiting confirmation)[/B] (SL: Dependent on price action after the level has been confirmed TP: Dependent on approaching price action after the level has been confirmed).[/li][li][B]Areas to watch for sell orders[/B]: [B]P.O:[/B] 1.36955 [B](Closed in full profit)[/B] (SL: 1.37270 TP: [1] [B]1.36666[/B][2] [B]1.36000[/B]) 1.37414 (SL: 1.37785 TP: Dependent on price action approach). [B]P.A.C:[/B] No P.A confirmation sell orders are seen in the current market environment.[/li][/ul]

GBP/USD:

[B]4hr TF.[/B]
It was reported in the last analysis, serious sellers were not likely to show interest until price was seen trading around the round number above at 1.72000, clearly this did not happen!

Price has retraced and reacted beautifully to the round number 1.71000 below. If price consumes the high marked with an x at 1.71767, price will very likely hit the round number 1.72000 above where selling pressure is expected to be seen, if only for a small bounce, as the buyers seem adamant on taking price higher to daily supply at 1.76290-1.73110 at the moment as shown in the last analysis.

Price still remains capped between the round numbers 1.71000 and 1.72000 with a positive break either side yet to be seen.
[B]Pending/P.A confirmation orders:[/B]

[ul]
[li][B]Pending buy orders [/B](Green line) are seen just above the decision point (demand) area (1.70066-1.70272) at 1.70288. A pending order is set here as we believe this area will very likely see a bullish reaction, even if only for a bounce, as this is likely the work of pro money, meaning they may not have filled all their buy orders around this level, thus unfilled orders may still be lurking there.[/li][li][B]The P.A confirmation buy order [/B](Red line) set around the round number 1.71000 at 1.71030 [B]is now active. The buyers will need to confirm this level by consuming some or most of the sellers around the high marked with an x at 1.71767, before a pending buy order is permitted to be set awaiting a possible retracement.[/B][/li][li][B]P.A confirmation buy orders [/B](Red line) are seen just above minor support (1.69431) at 1.69482. A reaction north is likely to be seen here, however we are currently seeing price trading within higher-timeframe supply on the weekly timeframe at 1.76290-1.70490, and with the spikes/tails seen south below the area (marked with arrows), this does not exactly instill much confidence in this level, hence the need for a confirmation buy order, rather than a pending buy order.[/li][li][B]No pending sell orders [/B](Green line) are seen in the current market environment.[/li][li][B]No P.A confirmation sell orders [/B](Red line) are seen in the current market environment.[/li][/ul]


[B]Quick Recap:[/B]
A sharp drop in value was seen on the Pound during the NFP announcement, with sellers pushing price into the round number 1.71000 and triggering our P.A confirmation buy order set at 1.71030 in the process. If price consumes the high marked with an x at 1.71767, we have a good chance at price hitting the round number 1.72000 and small bearish reaction being seen. However, do be prepared that aforementioned round number will likely see a positive break north, before the round number 1.71000 below does.

[ul]
[li][B]Areas to watch for buy orders:[/B] [B]P.O:[/B] 1.70288 (SL: 1.69983 TP: Dependent on price approach).[B]P.A.C:[/B] 1.69482 (likely to be set at 1.69176 TP: Dependent on approaching price action after the level has been confirmed) 1.71030 [B](Active-awaiting confirmation)[/B] (SL: Dependent on price action after the level has been confirmed TP: Dependent on approaching price action after the level has been confirmed).[/li][li][B]Areas to watch for sell orders[/B]: [B]P.O: [/B]No pending sell orders seen in the current market environment. [B]P.A.C: [/B]No P.A confirmation sell orders seen in the current market environment.[/li][/ul]

AUD/USD:

[B]Daily TF.[/B]
What a beautiful site that is, pro money sellers were obviously watching this daily supply area at 0.95434-0.94862 as price was seen bursting through the S/D flip demand area at 0.94468-0.93758 with little seen stopping price from hitting daily demand at 0.92054-0.92633.


[B]4hr TF.[/B]
Oh my! The buyers did really not stand a chance with this onslaught of recent selling that has taken place. The 4hr decision point (demand) area at 0.94132-0.94221 has been well and truly consumed, along with the 4hr demand area below at 0.93542-0.93670 also. Buyers have begun to show interest around the 4hr D/S flip area (demand) area at 0.93186-0.93345 (all seen on chart one below).

Chart 1:

Chart two below shows price is now currently trading in between 4hr demand (D/S flip area) at 0.93186-0.93345 and supply (D/S flip area) at 0.93542-0.93670).

Price on the daily timeframe shows there is very little stopping it from hitting daily demand below at 0.92054-0.92633 apart from the low 0.93218. If a break is seen of this low, lower prices should be expected.

Taking what we now know on the daily timeframe into consideration, if we see a positive break below the 4hr demand area at 0.93186-0.93345, price will have a very good chance of hitting 4hr demand below at 0.92037-0.92203.

[B]Pending/P.A confirmation orders:[/B]

[ul]
[li][B]The pending buy order [/B](Green line) set just above demand (0.93542-0.93670) at 0.93689 [B]has been stopped out.[/B][/li][li][B]The pending buy order [/B](Green line) set just above the decision point (demand) area (0.94132-0.94221) at 0.94244 [B]has been stopped out.[/B][/li][li][B]The P.A confirmation buy order [/B](Red line) set just above demand (0.93186-0.93345) at 0.93361[B]is now active. The buyers will need to confirm this area by consuming some or most of the sellers around a small minor supply (marked with an x) at 0.93821 for a pending buy order to be set awaiting a possible retracement.[/B][/li][li][B]The pending sell order [/B](Green line) set within supply (0.95434-0.95057) at 0.95178 [B]has been cancelled. Price dropped too far from the entry level for the time being.[/B][/li][li][B]No P.A confirmation sell orders [/B](Red line) are seen in the current market environment.[/li][/ul]

Chart 2:

[B]Quick Recap:[/B]
A full onslaught of selling pressure was seen during the NFP, and in all honesty we did not expect two of our demand areas to be consumed in the process (see chart one above – 0.94132-0.94221….0.93542-0.93670), which in turn stopped out two of our pending buy orders (0.93689/0.94244). Price is currently seen trading between supply (D/S flip area) at 0.93542-0.93670 and demand (D/S flip area) at 0.93186-0.93345. Price will likely see a break of the 4hr demand area just mentioned as the daily timeframe is currently showing room to move south to daily demand at 0.92054-0.92633 with a little trouble area to overcome first (low: 0.93218).

[ul]
[li][B]Areas to watch for buy orders:[/B] [B]P.O: [/B]No pending buy orders seen in the current market environment. [B]P.A.C:[/B] 0.93361 [B](Active-awaiting confirmation)[/B] (SL: Dependent on price action after the level has been confirmed TP: Dependent on approaching price action after the level has been confirmed).[/li][li][B]Areas to watch for sell orders[/B]: [B]P.O:[/B] No pending buy orders seen in the current market environment. [B]P.A.C:[/B] No P.A confirmation sell orders seen in the current market environment.[/li][/ul]

USD/JPY:

[B]Daily TF.[/B]
Active buyers were still clearly lurking within daily demand (S/D flip area) at 101.532-100.787 with sellers yet to show any interest. Price still remains capped between the daily demand area just mentioned and daily supply (Minor resistance) at 102.645.


[B]4hr TF.[/B]
Chart one shows the buyers took no prisoners before and during the NFP announcement. Two of our decision point levels (102.013/101.709) have been consumed north leaving the sellers with little choice but to cover their positions.

Chart 1:

Chart two shows the alterations that need to be made. Price currently remains capped between the round number 102.000 as acting support, and the decision point (supply) at 102.367.

Price has a very good chance of hitting our decision point (supply) level at 102.367 still, with a bearish reaction expected, if only for a bounce, so any traders with pending sell orders around this level, once or if the order is filled, do remember to bail at the first sign of trouble due the current higher-timeframe picture (Weekly support: 101.254 Daily demand: see above).

[B]Pending/P.A confirmation orders:[/B]

[ul]
[li][B]No pending buy orders [/B](Green line) are seen in the current market environment.[/li][li][B]The P.A confirmation buy order[/B] (red line) set just above the round number (101.000) at 101.027[B]has been removed. Price has rallied too far from the entry level for the time being.[/B][/li][li][B]Pending sell orders [/B](Green line) are seen at 102.367. A pending order is valid here since this is the area where pro money made the ‘decision’ to break the low 102.113 and take prices lower into what was demand (101.427-101.660 [B]seen on Monday 30[SUP]th[/SUP] June analysis[/B]) at the time, meaning unfilled sell orders were likely left there in the process.[/li][li][B]The pending sell order [/B](Green line) set just below the decision point (102.103) at 102.084 [B]has been stopped out.[/B][/li][li][B]The pending sell order [/B](Green line) set just below the decision point (101.709) at 101.691 [B]has been stopped out.[/B][/li][li][B]No P.A confirmation sell orders[/B] (Red line) are seen in the current market environment.[/li][/ul]

Chart 2:

[B]Quick Recap:[/B]
The daily timeframe is currently showing buying interest around daily demand at 101.532-100.787. Two decision point (supply) areas (102.103/101.709) were obliterated before and during the NFP announcement along with the pending sell orders set just below them (102.084/101.691). Price now remains capped between the round number 102.000 below acting as temporary support and 4hr supply (decision point) above at 102.367.A rally up towards the aforementioned supply level will likely be seen, where a bearish reaction is expected, if only for a bounce.

[ul]
[li][B]Areas to watch for buy orders:[/B] [B]P.O: [/B]No pending buy orders are seen in the current market environment.[B]P.A.C:[/B] No P.A confirmation buy orders are seen in the current market environment.[/li][li][B]Areas to watch for sell orders[/B]: [B]P.O:[/B] 102.367 (SL: 102.458 TP: Dependent on how price action approaches this area) [B]P.A.C:[/B] No P.A confirmation sell orders are seen in the current market environment.[/li][/ul]

EUR/GBP:

[B]Weekly TF.[/B]
The weekly timeframe shows sellers have pushed through weekly demand at 0.79596-0.80299, and are currently seen heading towards the large weekly demand area below at 0.77010-0.79140.


[B]Daily TF.[/B]
Buyers and sellers are seen battling it out deep within daily demand at 0.79282-0.79649. If a daily close is seen below this area, we may see price dropping to major daily support below at 0.77533.

With the weekly demand area (levels above) seeing a break south, it is very likely the daily demand area mentioned above will possibly follow suit, only time will tell!

[B]4hr TF.[/B]
Chart one below shows the sellers have aggressively consumed the 4hr demand area at 0.79405-0.79552 during and after the NFP announcement, price is now free to hit acting support below at the round number 0.79000.

Chart 1:

Chart two below shows the alterations that need to be made. Price is now free, with little to left stopping the sellers from hitting at least the round number 0.79000 below where a reaction is expected as this is the upper limit of the weekly demand area at 0.77010-0.79140 (see above). At the time of writing, price remains capped between the D/S flip area (supply) at 0.79405-0.79552 and the round number below at 0.79000 where price is likely to stay trading today due to the Americans being on vacation, but do keep an eye on both of these areas for possible trading opportunities.

[B]Pending/P.A confirmation orders:[/B]

[ul]
[li][B]The pending buy order[/B] (Green line) set at 0.79580 just above demand at 0.79405-0.79552 [B]has been stopped out.[/B][/li][li][B]New P.A confirmation buy orders[/B] (Red line) are seen just above the round number 0.79000 at 0.79054. Price will likely see a bullish reaction here due to it being located around the upper limit of a weekly demand area seen at 0.77010-0.79140. The reason we have not selected a pending buy order here is simply because there was no logical area for a stop-loss order, and as most traders know, these psychological numbers are magnets for deep spikes.[/li][li][B]New pending sell orders[/B] (Green line) are seen just below 4hr supply (0.80647-0.80583) at 0.80297. Our rationale behind placing a pending sell order here is because the sellers have already confirmed this supply (using a P.A confirmation sell order set at 0.80293) area by consuming most of the buyers around (what was) 4hr demand ([B]see 4[SUP]th[/SUP] July analysis[/B]) at 0.79405-0.79552, thus instilling confidence in this area for a pending sell order to be set awaiting price to possibly return.[/li][li][B]The P.A confirmation sell order[/B] (Red line) set under the S/R flip level 0.81403 at 0.81393 [B]has been removed since price has dropped too far from the entry level for the time being.[/B][/li][li][B]The P.A confirmation sell order [/B](Red line) set just under supply (0.80869-0.80771) at 0.80752[B]has been removed since price has dropped too far from the entry level for the time being.[/B][/li][/ul]
Chart 2:

[B]Quick Recap:[/B]
The weekly timeframe shows sellers have pushed through weekly demand at 0.79596-0.80299, while on the daily timeframe a small battle between the buyers and the sellers is being seen within daily demand at 0.79282-0.79649. 4hr demand at 0.79405-0.79552 has been well and truly consumed along with our pending buy order originally set at 0.79580. Price remains capped between the D/S flip area (supply) at 0.79405-0.79552 and the round number below at 0.79000 (a P.A confirmation buy order is set here at 0.79054) where price is likely to stay trading today due to the Americans being on vacation, so keep an eye on both of these areas for possible trading opportunities.

[ul]
[li][B]Areas to watch for buy orders: P.O: [/B]No pending buy orders are seen in the current market environment. [B]P.A.C: [/B]0.79054 (SL: (SL: Dependent on price action after the level has been confirmed TP: Dependent on approaching price action after the level has been confirmed).[/li][li][B]Areas to watch for sell orders[/B]: [B]P.O:[/B] 0.80297 (SL: 0.80652 TP: Dependent on approaching price action). [B]P.A.C:[/B] No P.A confirmation sell orders are seen in the current market environment.[/li][/ul]

USD/CAD:

[B]Weekly TF.[/B]
The sellers are still seen aggressively pushing deeper into weekly demand at 1.05609-1.07372 with the buyers showing very little interest at the moment.


[B]Daily TF.[/B]
Buyers did begin to show some enthusiasm within daily demand at 1.05883-1.06779 earlier, it did not last long though, as the sellers have recently been seen taking control once again!


[B]4hr TF.[/B]
The 4hr timeframe shows the buyers did indeed confirm the 4hr demand area at 1.06101-1.06335 during the NFP announcement by consuming some/most of the sellers around the high marked with an x at 1.06776. First trouble areas (supply) from this 4hr demand (levels above) are seen around the round number 1.07000 area, so do keep a close eye on this area. If the 4hr demand area (levels above) does see a break south, price will likely trade directly into the round number 1.06000 lurking just below.

[B]Pending/P.A confirmation orders:[/B]

[ul]
[li][B]The new pending buy order [/B](Green line) set within demand (1.06101-1.06335) at [B]1.06317[/B] [B]is now active. We placed a pending buy order here as soon as we saw price consuming some of the sellers around the high at 1.06776, thus confirming this area[/B] (A P.A confirmation buy order was used previously set at 1.06370 to ‘confirm’ this area (see July 3[SUP]rd[/SUP] analysis for details).[/li][li][B]No P.A confirmation buy orders[/B] (Red line) are seen in the current market environment.[/li][li][B]The pending sell order [/B](Green line) set within the decision point supply area (1.08251-1.08164) at 1.08226 [B]has been removed since price has dropped too far from the entry level for the time being.[/B][/li][li][B]Pending sell orders [/B](Green line) are seen around the decision point level (1.07481) at 1.07461. A pending sell order is valid here due to this being the last ‘obvious’ decision made by pro money that consumed buyers around the S/R flip level at 1.07266, unfilled sell orders may have been left here in the process. However, we still have to remain aware, as we’re currently seeing price trading in higher-timeframe demand (Weekly: 1.05609-1.07372 Daily: 1.05883-1.06779), so we would need to exit this position at the first sign of trouble if the sell order does indeed get filled.[/li][li][B]No P.A confirmation sell orders[/B] (Red line) are seen in the current market environment.[/li][/ul]


[B]Quick Recap:[/B]
Price is currently seen trading within both weekly and daily demand areas (1.05609-1.07372/1.05883-1.06779). The 4hr timeframe shows buyers were indeed active around the 4hr demand area at 1.06101-1.06335 as price confirmed this area by consuming some of the sellers lurking around the high 1.06776, allowing us to place a pending buy order at 1.06317, which was filled shortly after. Very little buying pressure is currently being seen; however, do keep an eye out for our first target around the 1.07000 area as price will likely visit this area if buyers begin showing interest once again, a drop below the 4hr demand area (levels above) could force price to test the round number below at 1.06000, so do be prepared for this as well.

[ul]
[li][B]Areas to watch for buy orders:[/B] [B]P.O: [/B]1.06317 B [/B]SL: 1.05937 TP: 1.07000 [May be subject to change])[B] P.A.C:[/B] There are no P.A confirmation buy orders seen within the current market environment.[/li][li][B]Areas to watch for sell orders[/B]: [B]P.O:[/B]1.07461 (SL: 1.07550 TP: Dependent on how price approaches this level). [B]P.A.C:[/B] There are no P.A confirmation sell orders seen within the current market environment).[/li][/ul]

USD/CHF:

[B]4hr TF.[/B]
The buyers recently showed strength during the NFP announcement with an impressive full-bodied bullish candle seen consuming more than likely all of the traders attempting to short around 4hr supply (D/S flip area) at 0.88973-0.89168. As reported in yesterday’s analysis: [I]If price breaks above the supply area just mentioned, price will be free to rally back up to 4hr supply at 0.90381-0.90033. Why is price likely free to do this? Notice the arrows marked the charts, these resemble wicks that have consumed supply i.e. sellers. So with most of the sellers already likely consumed in this area, buyers will be free to push price up until it hits probable supply (sellers) which will likely be around the 4hr supply at 0.90381-0.90033[/I].

However, before pro money can rally price to 4hr supply (levels above), they will more than likely need liquidity to do so (sell orders to buy into). So, watch for a possible deep retracement, likely hitting the origin of the rally away from the daily S/R flip level at 0.88501, specifically targeting the 0.88669 area, before price hits 4hr supply (levels above).

[B]Pending/P.A confirmation orders:[/B]

[ul]
[li][B]New pending buy orders[/B] (Green line) are seen just above the daily S/R flip level (0.88501) at 0.88669. The reason a pending order is permitted to be set here is simply because this is the origin of a nice rally to the upside. Price has also been seen entering into an area that appears clear (little supply) up until 4hr supply at 0.90381-0.90033; however, we expect pro money to need liquidity, and where better to look for this than the origin of the actual move up![/li][li][B]The P.A confirmation buy order [/B](Red line) set just above the round number 0.88000 at 0.88039[B]has been removed since price has rallied too far from the entry level for the time being.[/B][/li][li][B]No pending sell orders [/B](Green line) are seen in the current market environment.[/li][li][B]P.A confirmation sell orders[/B] (Red line) are seen just below the round number 0.90000 and 4hr supply (0.90381-0.90033) at 0.89976. The reason a pending sell order was not used here is simply because the aforementioned 4hr supply area has seen a lot of touches, indicating supply may have weakened, so a need to wait for confirmation here is essential.[/li][/ul]


[B]Quick Recap:[/B]
The 4hr timeframe shows the buyers have aggressively pushed price higher consuming more than likely most of the sellers around the D/ S flip area (supply) at 0.88973-0.89168 in the process. From here price will likely see a deep retracement back to the origin of the move up around the 0.88561 area where we currently have a pending buy order waiting at 0.88669 which should be filled in the process, before we see our 4hr supply area hit at 0.90381-0.90033.

[ul]
[li][B]Areas to watch for buy orders[/B]: P.O: 0.88669 (SL: 0.88463 TP: Dependent on approaching price action [B]P.A.C:[/B] There are currently no P.A confirmation buy orders seen within the current market environment.[/li][li][B]Areas to watch for sell orders[/B]: [B]P.O:[/B] There are currently no pending sell orders seen within the current market environment.[B] P.A.C:[/B] 0.89976 (SL: likely to be set at 0.90415 TP: Dependent on approaching price action after the level has been confirmed).[/li][/ul]

XAU/USD (GOLD)

Daily TF.
The daily timeframe shows sellers had begun to show some enthusiasm around daily supply at 1331.13-1318.24, it appears it was short lived though! Let’s take a look on the lower timeframes to see what more information we can find.


4hr TF.
A sharp drop has been seen towards demand (S/D flip area) at 1314.49-1309.37, where a subsequent reaction north was seen.
It was reported in the last analysis that:
Price will now very likely hit the 4hr supply area at 1342.46-1337.02 before price breaks the 4hr S/D flip area at 1314.49-1309.37 below, as pro money will likely want to collect as many of the stops (buy orders) as they can around this area to sell into. If this indeed is a fakeout above daily supply (1331.13-1318.24) as it appears it may be (at the time of writing), price may advance a little to 4hr supply at 1342.46-1337.02.as it works its way through the rest of the sellers’ stops.

Reading the above definitely seems to be the case right now, as the sellers could not break the demand area S/D flip area) at 1314.49-1309.37.

Pending/P.A confirmation orders:

[ul]
[li]Pending buy orders (Green line) are seen within demand (S/D flip area… 1284.88-1280.74) at 1282.82. We have set a pending buy order here due to the fact there was a decision made here (marked by the black horizontal level, when decisions are made by pro money, they may be unfilled buy orders left there, hence the fact we have set our pending order there.[/li][li]Pending buy orders (Green line) are seen just above demand (1258.57-1265.27) at 1268.91. We are permitted to set a pending buy order here as the buyers have consumed sellers within (which was at the time of writing) supply at 1293.47-1285.52, as per the previous confirmation buy order originally set at 1266.00 (See Thursday 19[SUP]th[/SUP] June for details).[/li][li]No P.A confirmation buy orders (Red line) are seen in the current market environment.[/li][li]Pending sell orders (Green line) are seen just below supply (1342.46-1337.02) at 1336.59. A pending sell order is set here because pro money love to get the cheapest prices, if price has indeed faked above daily supply at 1331.13-1318.24, pro money will want all of the stops (buy orders) around this area to sell into, hence a push up to the 4hr supply area mentioned above may well happen.[/li][li]No P.A confirmation sell orders (Red line) are seen in the current market environment.[/li][/ul]


Quick Recap:
The daily timeframe shows sellers did begin to show some energy around daily supply at 1331.13-1318.24, however it was short lived as the buyers are currently seen pushing price back up into daily supply. The 4hr timeframe shows the sellers pushed price right into 4hr demand at 1314.49-1309.37 only to be quickly rejected by the buyers! Price will not likely break the aforementioned 4hr demand area before hitting 4hr supply above at 1342.46-1337.02 triggering our pending sell order set at 1336.59 in the process, we may not see this happen today due to the Americans being on vacation, so expect this early next week sometime.

[ul]
[li]Areas to watch for buy orders: P.O: 1268.91 (SL: 1264.30 TP: Dependent on approaching price action) 1282.82 (SL: 1275.12 TP: Dependent on approaching price action). P.A.C: There are currently no P.A confirmation buy orders seen in the current market environment.[/li][li]Areas to watch for sell orders: P.O: 1336.59 SL: 1343.47 TP: Dependent on approaching price action) P.A.C: There are currently no P.A confirmation sell orders seen in the current market environment.[/li][/ul]

EUR/USD:

[B]Weekly TF.[/B]
This timeframe still shows price trading within weekly demand at 1.34760-1.36314 as it has been now for six weeks! The buyers did in fact attempt to trade higher, but were soon hammered back down unable to close above the previous weekly high at 1.36502 where the market closed at 1.35921. As we are still trading within this weekly demand area (levels above), higher prices are naturally expected, until a break lower is seen.


[B]Daily TF.[/B]
Daily supply at 1.37297-1.36879 and daily demand below at 1.34760-1.35265 are currently capping the market either side, which magnifies the consolidating price action within weekly demand (levels above).
A beautiful reaction was seen at the beginning of last week at the aforementioned daily supply area, which sent price south for most of last week!

We may well see a third test of daily demand below (levels above) before we see a break of daily supply above (levels above), possibly forcing price to test of the daily S/R flip level above at 1.37908.


[B]4hr TF.[/B]
During Friday’s trading session the sellers broke below the round number 1.36000, and was seen retesting it nearing the end of week, now becoming a temporary resistance level. If this round number resistance proves itself with lower prices at the beginning of this week, we may well see a touch of the low below at 1.35746.

A positive break below of the aforementioned low could see prices dropping all the way to 4hr demand at 1.35018-1.35375 sometime early this week. The reason being is that most of the demand/buyers have already been consumed. Take a look at the arc pattern on the chart; can you see the tails that spike down as price continued to rally? This is more than likely pro money at work clearing the buyers out for a move south later on. This is why the low just mentioned is so important; as this is the last obstacle in the way before 4hr demand (levels above) could possibly see some action.

[B]Pending/P.A confirmation orders:[/B]

[ul]
[li][B]No pending buy orders [/B](Green line) are seen in the current market environment.[/li][li][B]P.A confirmation buy orders [/B](Red line) are seen just above demand (1.35018-1.35375) at 1.35417. The reason behind us placing a P.A confirmation buy order here, rather than a pending buy order is because the aforementioned demand area appears weak as deep spikes have been seen recently (marked with two arrows).[/li][li][B]No pending sell orders [/B](Green line) are seen in the current market environment.[/li][li][B]P.A confirmation sell orders [/B](Red line) are seen just below supply (1.37224-1.37028) at 1.36894. A P.A.C order was selected here due to the reaction seen at the aforementioned supply area proving its validity. However, pro money may well decide to push price higher into this supply area if/when price returns to it, thus making it a risky trade for a stop above the high 1.36995 which could be very easily be stopped out if a pending sell order was set, hence the need to wait for confirmation.[/li][/ul]


[B]Quick Recap:[/B]
The weekly timeframe still shows buyers and sellers battling it out within weekly demand at 1.34760-1.36314, while on the daily timeframe price still remains capped between daily demand at 1.34760-1.35265 and daily supply above at 1.37297-1.36879. The 4hr timeframe shows sellers broke the round number 1.36000 early Friday, with price being seen retesting it late Friday confirming it as temporary resistance. Price will likely see a push to the downside testing the low 1.35746, where a decision will need to be made! If we see a positive break below this low we could see price drop down to 4hr demand at 1.35018-1.35375 where we have a P.A confirmation buy order set at 1.35417.

[ul]
[li][B]Areas to watch for buy orders:[/B] [B]P.O:[/B] No pending buy orders are seen in the current market environment. [B]P.A.C: [/B]1.35417 (SL: Dependent on price action after the level has been confirmed TP: Dependent on approaching price action after the level has been confirmed).[/li][li][B]Areas to watch for sell orders[/B]: [B]P.O:[/B] No pending sell orders are seen in the current market environment. [B]P.A.C:[/B] 1.36894 (SL: Dependent on price action after the level has been confirmed TP: Dependent on approaching price action after the level has been confirmed).[/li][/ul]

GBP/USD:

[B]Weekly TF.[/B]
The buyers have pushed price higher into weekly supply (1.76297-1.67702) consequently forming a nice-looking demand area at the base (1.66917-1.67939). When will this buying activity end, and will the sellers begin to put up a fight? Let’s take a look at the daily timeframe for a closer view!


[B]Daily TF.[/B]
This timeframe shows a great-looking daily supply area (1.76297-1.73024) looming just above current price action (around 140 pips); this could very well be the area we see the sellers begin to show interest. Price has very little stopping it from reaching the aforementioned daily supply area, but for price to rally that far, pro money will require liquidity (sell orders to buy into), so a retracement may be seen to the daily S/R flip level below at 1.69712 before a rally higher is seen.
[B] [/B]
[B]4hr TF.[/B]
Price is currently seen trading between round numbers 1.71000 and 1.72000. A beautiful reaction was seen off of the round number 1.71000, what followed after this was important. Notice the high marked with a flag at 1.71762? Early Friday, price consumed this high with a small wick/spike above it, more than likely stopping out some of the sellers in the process.

With the high now clear of some potential supply, logically there is room for price to move above this, to test the round number 1.72000, with the possibility of breaking this level also. A retracement to the round number 1.71000 is not out of the question though, as pro money will require orders to move the market higher, so do be on the lookout for this early sometime time this week.

[B]Pending/P.A confirmation orders:[/B]

[ul]
[li][B]A pending buy order [/B](Green line) is set just above the round number 1.71000 at 1.71039. A pending buy order is valid here due to the buyers proving this level by consuming sellers around the high (marked with a flag) at 1.71762, thus potentially clearing the path for higher prices, and if a retracement occurs, we will be ready and waiting to enter the market![/li][li][B]P.A confirmation buy orders [/B](Red line) are seen just above demand (1.70617-1.70459) at 1.70662. A reaction north is likely to be seen here as there is no doubt unfilled buy orders left around this area when pro money made the ‘decision’ to push higher. However deep spikes can occur around flip areas (levels above) such as these, hence the need to wait for confirmation.[/li][li][B]No pending sell orders [/B](Green line) are seen in the current market environment.[/li][li][B]No P.A confirmation sell orders [/B](Red line) are seen in the current market environment.[/li][/ul]

[B]Quick Recap:[/B]
The weekly timeframe shows buyers have aggressively pushed prices higher into weekly supply at 1.76297-1.67702, while on the daily timeframe, price is seen trading between daily supply at 1.76297-1.73024 and the S/R flip level below at 1.69712, which is where price will likely retrace to before a rally up to daily supply (levels above) is seen. The 4hr timeframe shows price is currently capped between two round numbers 1.71000 and 1.72000. Buyers confirmed the round number 1.71000 by consuming sellers around the high marked with a flag at 1.71762, thus allowing us to place a pending buy order around the round number just mentioned at 1.71039 where a retracement will likely be seen early sometime this week.

[ul]
[li][B]Areas to watch for buy orders:[/B] [B]P.O:[/B] 1.71039 (SL: 1.70870 TP: Dependent on price approach).[B]P.A.C:[/B] 1.70662 (likely to be set at 1.70423 TP: Dependent on approaching price action after the level has been confirmed).[/li][li][B]Areas to watch for sell orders[/B]: [B]P.O: [/B]No pending sell orders seen in the current market environment. [B]P.A.C: [/B]No P.A confirmation sell orders seen in the current market environment.[/li][/ul]

AUD/USD:

[B]Weekly TF.[/B]
Consolidating price action is still being seen on the weekly timeframe (0.94600/0.92046). The buyers did attempt to break out of this range (notice the wick) but were very quickly hammered back down by the sellers closing the market for the week at 0.93621, and forming what the majority of traders call a bearish engulfing outside candle/bar, meaning we may be in for lower prices this week?


[B]Daily TF.[/B]
A beautiful reaction was seen from daily supply at 0.95425-0.94852 at the beginning of last week with buying interest seen coming in around the low 0.93208 on Thursday and Friday. If price breaks the aforementioned low, we may very well see price hit daily demand below at 0.92046-0.92354.
At the time of writing price remains capped between daily supply at 0.95425-0.94852 and daily demand below at 0.92046-0.92354.

[B]4hr TF.[/B]
From Tuesday onwards last week, the sellers were very much in control breaking multiple demand areas in the process. The buyers began to show a little interest around 4hr demand at 0.93208-0.93417, however this interest should be nothing to get excited about, as it was more than likely pro money taking profit on their positions from the recent decline in price.

If price consumes the 4hr demand area just mentioned, we could be in for a nice move to the downside, why? Look back on the daily timeframe above, the daily low 0.93208 is the bottom limit of our 4hr demand area, so we should at least expect price to touch the round number 0.93000 below if indeed a break lower does happen.

Price is capped between the aforementioned 4hr demand area and the round number 0.94000 above, price may very well rally to this round number, before breaking 4hr demand below, at present though, the buyers are appearing weak, so be aware for a sharp drop to the downside early sometime this week.

[B]Pending/P.A confirmation orders:[/B]

[ul]
[li][B]No pending buy orders [/B](Green line) are seen in the current market environment.[/li][li][B]No P.A confirmation buy orders [/B](Red line) are seen in the current market environment.[/li][li][B]Pending sell orders [/B](Green line) are seen just below supply (0.95425-0.95096) at 0.95052. A pending sell order is placed here due to this being an area where pro money was interested in before; see how close price came to the supply area? (Levels above), this indicates possible strong supply, so the next time price visits we can expect some sort of reaction.[/li][li][B]P.A confirmation sell orders [/B](Red line) are seen just below the round number 094000 at 0.93959. A P.A confirmation sell order was allocated here since this area will likely be the place pro money will rally price to, to collect liquidity, before dropping lower. However, a pending sell order here could be dangerous as there is no logical area to place your stop loss, and as most traders know, these psychological levels are prone to deep spikes on occasion.[/li][/ul]

[B]Quick Recap:[/B]
The weekly timeframe showed sellers were mainly in control of the market for most of the week forming a bearish engulfing outside candle, while on the daily timeframe price is still capped between daily demand at 0.92046-0.92354 and daily supply at 0.95425-0.94852. The 4hr timeframe showed the selling momentum was strong last week consuming a few demand areas in the process. Buyers were seen showing little interest around 4hr demand at 0.93208-0.93417 where price may likely see a rally to the round number above at 0.94000, and triggering our P.A confirmation sell order set at 0.93959 in the process before any lower prices are seen.

[ul]
[li][B]Areas to watch for buy orders:[/B] [B]P.O: [/B]No pending buy orders seen in the current market environment. [B]P.A.C:[/B] No pending sell orders seen in the current market environment.[/li][li][B]Areas to watch for sell orders[/B]: [B]P.O:[/B] 0.95052 (SL: 0.95467 TP: Depending on price approach).[B]P.A.C:[/B] 0.93959 (SL: Dependent on price action after the level has been confirmed TP: Dependent on approaching price action after the level has been confirmed).[/li][/ul]

USD/JPY:

[B]Weekly TF.[/B]
The buyers still seem to really like the long-term weekly S/R flip level at 101.206 as a positive break below has yet to be seen.
Price formed what the majority of traders call a bullish engulfing outside candle/bar; nevertheless a positive close above last week’s open at 102.064 was not seen as the market closed just below at 102.030.


[B]Daily TF.[/B]
The daily timeframe remains capped between daily resistance at 102.713 and daily demand below at 100.747-100.967. Considering the higher-timeframe picture (weekly) we are likely to see higher prices sometime this week, however it goes without saying, a bearish retracement will possibly happen before any higher prices are seen. Let’s take a look at the 4hr chart to see if we can gather any more information regarding this.


[B]4hr TF.[/B]
Last week, the buyers had pushed price above the high 102.157, this is a fantastic sign as higher prices could well be seen now.
One can only imagine the amount of stops lurking above the high just mentioned, and these have all more than likely been consumed, turning them into buy orders for pro money to sell into, hence the small sell off seen already on NFP Thursday!

Where could price possibly go from here? Well the path north has been cleared above the high as explained above, so higher prices can indeed happen. However for price to rally higher, pro money will require liquidity, and lots of it! So, a drop down to either one of the decision point levels (101.754…101.400-101.465) will probably be seen sometime this week, which level, will solely be determined on how much liquidity is actually needed. So, do keep a close eye on both of these levels!

If the above does happen, how far can price rally? Take a look at the green-shaped arc, look at all those wicks! These wicks are most likely supply consumption meaning most of the sellers were consumed as price was dropping, hence a clear path north right up to 4hr supply above at 103.294-102.983.

[B]Pending/P.A confirmation orders:[/B]

[ul]
[li][B]Pending buy orders [/B](Green line) are seen just above the decision-point level (101.400-101.465) at 101.483. The reason a pending buy order is valid here is for the simple fact this is where pro money were active, they made a decision to push prices higher, indicating there may very well be unfilled buy orders lurking here.[/li][li][B]Pending buy orders [/B](Green line) are seen just above the decision-point level (101.754) at 101.771. Very similar reason to above, pro money made the decision here to push price up (above the high 102.157) into a zone of interest (take a look at the green arc and see what it resembles) indicating there may very well be unfilled buy orders lurking here.[/li][li][B]No P.A confirmation buy orders[/B] (Red line) are seen in the current market environment.[/li][li][B]Pending sell orders [/B](Green line) are seen just below supply (103.294-102.983) at 102.953. A pending sell order was set here due to this being an area where likely unfilled sell orders are.[/li][li][B]No P.A confirmation sell orders[/B] (Red line) are seen in the current market environment.[/li][/ul]

[B]Quick Recap:[/B]
The buyers still seem to really like the long-term weekly S/R flip level at 101.206 as a positive break below has yet to be seen, while on the daily timeframe price is still seen being capped between daily resistance at 102.713 and daily demand below at 100.747-100.967. Buyers on the 4hr timeframe seem to have consumed some or most of the sellers around the high 102.157 opening a likely clear path above up to 4hr supply at 103.294-102.983. Price will likely see a retracement early this week to either decision point level below (101.754…101.400-101.465), before any higher prices are seen.

[ul]
[li][B]Areas to watch for buy orders:[/B] [B]P.O: [/B]101.483 (SL: 101.375 TP: Dependent on price approach) 101.771 (SL: 101.673 TP: Dependent on price approach) .[B]P.A.C:[/B] No P.A confirmation buy orders are seen in the current market environment.[/li][li][B]Areas to watch for sell orders[/B]: [B]P.O:[/B] 102.953 (SL: 103.317 TP: Dependent on price approach)[B]P.A.C:[/B] No P.A confirmation sell orders are seen in the current market environment.[/li][/ul]

EUR/GBP:

[B]Weekly TF.[/B]
The weekly timeframe shows the sellers were in full swing last week, closing the market on its weekly lows at 0.79196. Take a quick look at the green arc to the left, notice the wicks/tails? These tails could possibly resemble demand/buyers consumption, so be aware price could very well drop a lot further yet! Let’s take a closer look at the action to see if there are any lower-timeframe demand areas within this area (green arc) that could possibly hold up price.


[B]Daily TF.[/B]
There is not much to report on the daily timeframe other than selling and, yes, more selling! Remember on the weekly timeframe, we mentioned the green arc price action? Well, on the daily timeframe a fresh daily demand area was found within that area at 0.78117-0.78533, so do note this area down, as price will likely react there when or if it reaches it.


[B]4hr TF.[/B]
Towards the end of last week, the sellers broke the S/R flip level south at 0.79679, then came back up to retest it, before dropping like a rock during NFP Thursday.

The 4hr demand below at 0.78862-0.79185 is also another fresh demand area within the green weekly arc zone (see above). Price is now currently capped between the S/R flip level above at 0.79679 and 4hr demand below (levels above). Price will very likely pay a visit to this fresh 4hr demand area just mentioned early this week, and a nice reaction will more than likely be seen due to its location on the higher timeframes (Weekly demand: 0.76931-0.78623 Daily demand: 0.78117-0.78533).

However do not discount the possibility of a retracement north first up to the S/R flip level (level above) before the 4hr demand area (levels above) sees a touch.

[B]Pending/P.A confirmation orders:[/B]

[ul]
[li][B]Pending buy orders[/B] (Green line) are seen just above demand (0.78862-0.79185) at 0.79076. A pending buy order is placed here due to the aforementioned 4hr demand area’s location in the higher timeframes (Weekly demand: 0.76931-0.78623 Daily demand: 0.78117-0.78533).[/li][li][B]No P.A confirmation buy orders[/B] (Red line) are seen in the current market environment.[/li][li][B]Pending sell orders[/B] (Green line) are seen just below the S/R flip level (0.79679) at 0.79641. Our rationale behind placing a pending sell order here when we are trading in and around higher timeframe demand (Weekly demand: 0.76931-0.78623 Daily demand: 0.78117-0.78533) is simply because this was a decision point area made at the aforementioned S/R flip level during NFP Thursday, meaning pro money were certainly active, and unfilled sell orders are more than likely still lurking there.[/li][li][B]No P.A confirmation sell orders[/B] (Red line) are seen in the current market environment.[/li][/ul]

[B]Quick Recap:[/B]
The weekly timeframe shows the sellers were in full swing last week, closing the market on its weekly lows at 0.79196 edging ever so closer to major weekly demand at 0.76931-0.78623, while on the daily timeframe shows buyers had little to no interest in stopping the selling onslaught! Price remains capped between daily demand at 0.78117-0.78533 and daily supply above at 0.80328-0.80024. The sellers on the 4hr timeframe seem to be heading to near-term fresh 4hr demand at 0.78862-0.79185 where we currently have a pending buy order set and waiting at 0.79076. However, do not discount the possibility of a retrace north back up to where pro money decided to bring prices lower, around the S/R flip level (0.79679), where we also have a pending sell order set at 0.79641.

[ul]
[li][B]Areas to watch for buy orders: P.O: [/B]0.79076 (SL: 0.78846 TP: Dependent on price approach)[B]P.A.C: [/B]No P.A confirmation buy orders are seen in the current market environment.[/li][li][B]Areas to watch for sell orders[/B]: [B]P.O:[/B] 0.79641 (SL: 0.79747 TP: Dependent on price approach).[B]P.A.C:[/B] No P.A confirmation sell orders are seen in the current market environment.[/li][/ul]

USD/CAD:

[B]Weekly TF.[/B]
The weekly timeframe tells us that the buyers have consumed most, if not all of the sellers located around the high at 1.11252, meaning price is now clear to rally higher.

Take a quick look at the green arc, notice all those wicks? These wicks are most likely supply consumption, look to the right and see how easy price sliced through this area; it was like a hot knife through butter! The weekly decision point (demand) at 1.05715-1.07008 was clearly where the decision was made to rally price to new highs, so this area is very important!

At the moment we are still trading within the weekly demand just mentioned, forming what the majority of traders call an indecision candle. Price did in fact close just below the previous week’s low (1.06589) at 1.06500, when will the buyers begin to show serious interest here? This is the question we would all like the answer to!

[B]Daily TF.[/B]
On this timeframe, we can clearly see price remains capped between daily demand at 1.05874-1.06680 and an S/R flip level acting as supply at 1.08277. A small battle appears to be going on in the aforementioned daily demand area; buyers are in control one day, with the sellers taking over the next, hence the indecision candle on the weekly timeframe!
We cannot ignore the fact this is a great-looking daily demand area (levels above), so higher prices are naturally expected up to at least the decision point level above at 1.07508-1.07293.


[B]4hr TF.[/B]
Price is seen dancing around 4hr demand at 1.06041-1.06312, buyers are clearly active here, but at the same time remain indecisve.
It is very likely we will see higher prices to at least the round number 1.07000 above, as the sellers begun reacting to a potential temporary supply on the lower timeframes around the 1.06515 area. This could just be enough to push price back into the aforementioned 4hr demand area to collect a few more orders, before taking prices higher, which will likely happen early this week.

[B]Pending/P.A confirmation orders:[/B]

[ul]
[li][B]Pending buy orders [/B](Green line) are seen within demand (1.06041-1.06312) at 1.06229. Price will likely see a retracement into this demand area, and a bullish reaction will likely follow, as we are currently in higher timeframe demand (Weekly demand: 1.05715-1.07008 Daily demand: 1.05874-1.06680).[/li][li][B]No P.A confirmation buy orders[/B] (Red line) are seen in the current market environment.[/li][li][B]Pending sell orders [/B](Green line) are seen just below a small supply area (1.07508-1.07434) at 1.07386. A pending sell order has been set here since a bounce from this area will likely be seen if/when price reaches here, as the momentum from this area was quite strong, indicating unfilled sell orders may still be set there.[/li][li][B]No P.A confirmation sell orders[/B] (Red line) are seen in the current market environment.[/li][/ul]
[B] [/B]

[B]Quick Recap:[/B]
The weekly timeframe formed what the majority of traders call an indecision candle within weekly demand at 1.05715-1.07008, while on the daily timeframe a small battle appears to be going on within the daily demand area at 1.05874-1.06680; buyers are in control one day, with the sellers taking over the next, hence the indecision candle on the weekly timeframe! The 4hr timeframe shows active buyers around 4hr demand at 1.06041-1.06312 where we currently have a pending buy order set within at 1.06229, as we expect price to retrace a little back into 4hr demand (levels above) thus filling our pending buy order (level above) before higher prices are seen to around the round number 1.07000 above.

[ul]
[li][B]Areas to watch for buy orders:[/B] [B]P.O: [/B]1.06229 SL: 1.05951 TP: Dependent on price approach.[B]P.A.C:[/B] There are no P.A confirmation buy orders seen within the current market environment.[/li][li][B]Areas to watch for sell orders[/B]: [B]P.O:[/B]1.07386 (SL: 1.07541 TP: Dependent on price approach).[B]P.A.C:[/B] There are no P.A confirmation sell orders seen within the current market environment.[/li][/ul]

USD/CHF:

[B]Weekly TF.[/B]
The weekly timeframe shows the buyers were in control for most of the week forming what most traders call a pin bar (average looking). Price closed the market near its weekly highs at 0.89382, but was unable to positively close above the previous week’s high at 0.89670.

Price has been trading around weekly demand at 0.85664-0.88124 for some time now, with either buyers or sellers showing much interest on this timeframe. However we cannot ignore the fact we are around higher-timeframe demand (levels above) so, naturally higher prices are expected.


[B]Daily TF.[/B]
The daily timeframe shows price has been for the past month trading around daily supply at 0.90372-0.90042. The sellers have appeared to clear out all the remaining buyers left around the low 0.89071 marked with a flag, and now the buyers have taken back control, and remained in control for the most part of last week.

If the low (level above) has indeed been cleared of buyers, theoretically, there is little stopping price dropping down to the support level at 0.86982. What this would mean though is we would be selling into higher-timeframe weekly demand (levels above), not a wise idea, unless one is very confident in their methodology. Let’s take a look on the 4hr timeframe to see if things are a little clearer for us.

[B]4hr TF.[/B]
Ah! This is what we could not see on the daily timeframe. Price has yet to consume an important low seen at 0.88546, if price did consume this area with a positive close below, price would be free to drop quite some way before hitting its next trouble area around the round number 0.88000.
At the time of writing, we can see price is trading near an important high at 0.89557. The reason for its importance is because if we see a positive close above the aforementioned high, we will likely see price rallying up to at least the round number 0.90000. The reason price could indeed rally this high upon a nice-looking break is because most of the supply has already been consumed by the wicks/spikes highlighted by the green arc pattern, thus the path is most likely clear up to where there is likely sellers lurking i.e. the round number 0.90000.
[B]Pending/P.A confirmation orders:[/B]

[ul]
[li][B]No pending buy orders [/B](Green line) are seen in the current market environment.[/li][li][B]P.A confirmation buy orders [/B](Red line) are seen just above the low 0.88546 at 0.88586. The reason that a P.A confirmation buy order was set here rather than a pending buy order was simply because there is no logical area for a stop loss, and the low (level above) will be likely prone to deep tests, or worse, a positive break below, hence the need to wait for confirmation.[/li][li][B]No pending sell orders [/B](Green line) are seen in the current market environment.[/li][li][B]P.A confirmation sell orders[/B] (Red line) are seen just below the high 0.89557 at 0.89514. The reason that a P.A confirmation sell order was set here rather than a pending sell order was simply because there is no logical area for a stop loss, and the high (level above) will likely be prone to deep tests, or worse, a positive break above, hence the need to wait for confirmation.[/li][/ul]

[B]Quick Recap:[/B]
The weekly timeframe shows price is meandering around weekly demand at 0.85664-0.88124, while the daily timeframe shows price is trading around daily supply at 0.90372-0.90042. The 4hr timeframe shows price is trading near an important high at 0.89557 where we also have a P.A confirmation sell order set at 0.89514, which if consumed, it will open up a void for possible buying up to at least the round number 0.90000.

[ul]
[li][B]Areas to watch for buy orders[/B]: P.O: There are currently no pending buy orders seen within the current market environment.[B] P.A.C:[/B] 0.88586 (SL: Dependent on price action after the level has been confirmed TP: Dependent on approaching price action after the level has been confirmed).[/li][li][B]Areas to watch for sell orders[/B]: [B]P.O:[/B] There are currently no pending sell orders seen within the current market environment.[B] P.A.C:[/B] 0.89514 (SL: likely to be set at 0.89624 TP: Dependent on approaching price action after the level has been confirmed).[/li][/ul]

XAU/USD (GOLD)

[B]Weekly TF.[/B]
The weekly timeframe shows that the most recently closed weekly candle consumed the previous weekly candle high (1325.82) making a new high at 1333.47.

[B]Daily TF.[/B]
Price has remained trading around daily supply at 1318.12-1331.08 for the most part of last week. It is very difficult to see if the wick/spike was a genuine continuation move or a fakeout for lower prices, maybe the 4hr timeframe will shed some light on this.


[B]4hr TF.[/B]
Ah! Price spiking above daily supply (levels above) nearly hit a great-looking 4hr supply area at 1342.30-1335.74. Now, if this is indeed a fakeout above daily supply (levels above), price may yet rally prices further into the aforementioned 4hr supply area to consume all the sellers’ stops lurking above daily supply (levels above).

If price positively closes below 4hr demand at 1304.77-1308.55 we can be quite confident it was indeed a fakeout above daily supply (levels above). If, however price consumes the 4hr supply area above (1342.30-1335.74), we can be pretty sure it is a continuation move. Only time will tell, but we definitely favor a fakeout!

[B]Pending/P.A confirmation orders:[/B]

[ul]
[li][B]No pending buy orders[/B] (Green line) are seen in the current market environment.[/li][li][B]P.A confirmation buy orders [/B](Red line) are seen just above the S/D flip area (1284.77-1280.53) at 1285.71. We have set a P.A confirmation buy order here simply because we could not find a logical area for the stop-loss order, so to avoid any deep spikes, we have decided to wait for confirmation.[/li][li][B]P.A confirmation buy orders [/B](Red line) are seen just above demand (1304.77-1308.55) at 1309.75. We did not think a pending buy order was wise here due to the amount of spikes/tails seen already to this area, hence the need to wait for confirmation.[/li][li][B]Pending sell orders [/B](Green line) are seen just below supply (1342.30-1335.74) at 1334.17. A pending sell order is set here because this is the likely area pro money will push prices to if indeed a fakeout of daily supply (1318.12-1331.08) is happening, thus a pending sell order is valid.[/li][li][B]No P.A confirmation sell orders[/B] (Red line) are seen in the current market environment.[/li][/ul]

[B]Quick Recap:[/B]
The weekly timeframe shows that the most recently closed weekly candle consumed the previous weekly candle high (1325.82) making a new high at 1333.47, while on the daily timeframe price has remained trading around daily supply at 1318.12-1331.08 for the most part of last week. It is very difficult to see if the wick/spike was a genuine continuation move or a fakeout for lower prices at the moment. The 4hr timeframe shows price is currently trading in between 4hr demand at 1304.77-1308.55 and 4hr supply at 1342.30-1335.74 with a break yet to be seen either side, however do watch these areas just mentioned as a break of either could very well answer our questions as to whether a fakeout of daily supply (1318.12-1331) is occurring.

[ul]
[li][B]Areas to watch for buy orders:[/B] [B]P.O:[/B] There are currently no pending buy orders seen in the current market environment. [B]P.A.C:[/B] 1285.71 (SL: (SL: Dependent on price action after the level has been confirmed TP: Dependent on approaching price action after the level has been confirmed) 1309.75 (SL likely to be set at 1303.11 TP: Dependent on approaching price action after the level has been confirmed).[/li][li][B]Areas to watch for sell orders[/B]: [B]P.O: [/B]1334.17 SL: 1343.78 TP: Dependent on approaching price action) [B]P.A.C:[/B] There are currently no P.A confirmation sell orders seen in the current market environment.[/li][/ul]

XAU/USD (GOLD)

[B]Weekly TF.[/B]
The weekly timeframe shows that the most recently closed weekly candle consumed the previous weekly candle high (1325.82) making a new high at 1333.47.

[B]Daily TF.[/B]
Price has remained trading around daily supply at 1318.12-1331.08 for the most part of last week. It is very difficult to see if the wick/spike was a genuine continuation move or a fakeout for lower prices, maybe the 4hr timeframe will shed some light on this.


[B]4hr TF.[/B]
Ah! Price spiking above daily supply (levels above) nearly hit a great-looking 4hr supply area at 1342.30-1335.74. Now, if this is indeed a fakeout above daily supply (levels above), price may yet rally prices further into the aforementioned 4hr supply area to consume all the sellers’ stops lurking above daily supply (levels above).

If price positively closes below 4hr demand at 1304.77-1308.55 we can be quite confident it was indeed a fakeout above daily supply (levels above). If, however price consumes the 4hr supply area above (1342.30-1335.74), we can be pretty sure it is a continuation move. Only time will tell, but we definitely favor a fakeout!

[B]Pending/P.A confirmation orders:[/B]

[ul]
[li][B]No pending buy orders[/B] (Green line) are seen in the current market environment.[/li][li][B]P.A confirmation buy orders [/B](Red line) are seen just above the S/D flip area (1284.77-1280.53) at 1285.71. We have set a P.A confirmation buy order here simply because we could not find a logical area for the stop-loss order, so to avoid any deep spikes, we have decided to wait for confirmation.[/li][li][B]P.A confirmation buy orders [/B](Red line) are seen just above demand (1304.77-1308.55) at 1309.75. We did not think a pending buy order was wise here due to the amount of spikes/tails seen already to this area, hence the need to wait for confirmation.[/li][li][B]Pending sell orders [/B](Green line) are seen just below supply (1342.30-1335.74) at 1334.17. A pending sell order is set here because this is the likely area pro money will push prices to if indeed a fakeout of daily supply (1318.12-1331.08) is happening, thus a pending sell order is valid.[/li][li][B]No P.A confirmation sell orders[/B] (Red line) are seen in the current market environment.[/li][/ul]

[B]Quick Recap:[/B]
The weekly timeframe shows that the most recently closed weekly candle consumed the previous weekly candle high (1325.82) making a new high at 1333.47, while on the daily timeframe price has remained trading around daily supply at 1318.12-1331.08 for the most part of last week. It is very difficult to see if the wick/spike was a genuine continuation move or a fakeout for lower prices at the moment. The 4hr timeframe shows price is currently trading in between 4hr demand at 1304.77-1308.55 and 4hr supply at 1342.30-1335.74 with a break yet to be seen either side, however do watch these areas just mentioned as a break of either could very well answer our questions as to whether a fakeout of daily supply (1318.12-1331) is occurring.

[ul]
[li][B]Areas to watch for buy orders:[/B] [B]P.O:[/B] There are currently no pending buy orders seen in the current market environment. [B]P.A.C:[/B] 1285.71 (SL: (SL: Dependent on price action after the level has been confirmed TP: Dependent on approaching price action after the level has been confirmed) 1309.75 (SL likely to be set at 1303.11 TP: Dependent on approaching price action after the level has been confirmed).[/li][li][B]Areas to watch for sell orders[/B]: [B]P.O: [/B]1334.17 SL: 1343.78 TP: Dependent on approaching price action) [B]P.A.C:[/B] There are currently no P.A confirmation sell orders seen in the current market environment.[/li][/ul]

EUR/USD:

[B]4hr TF.[/B]
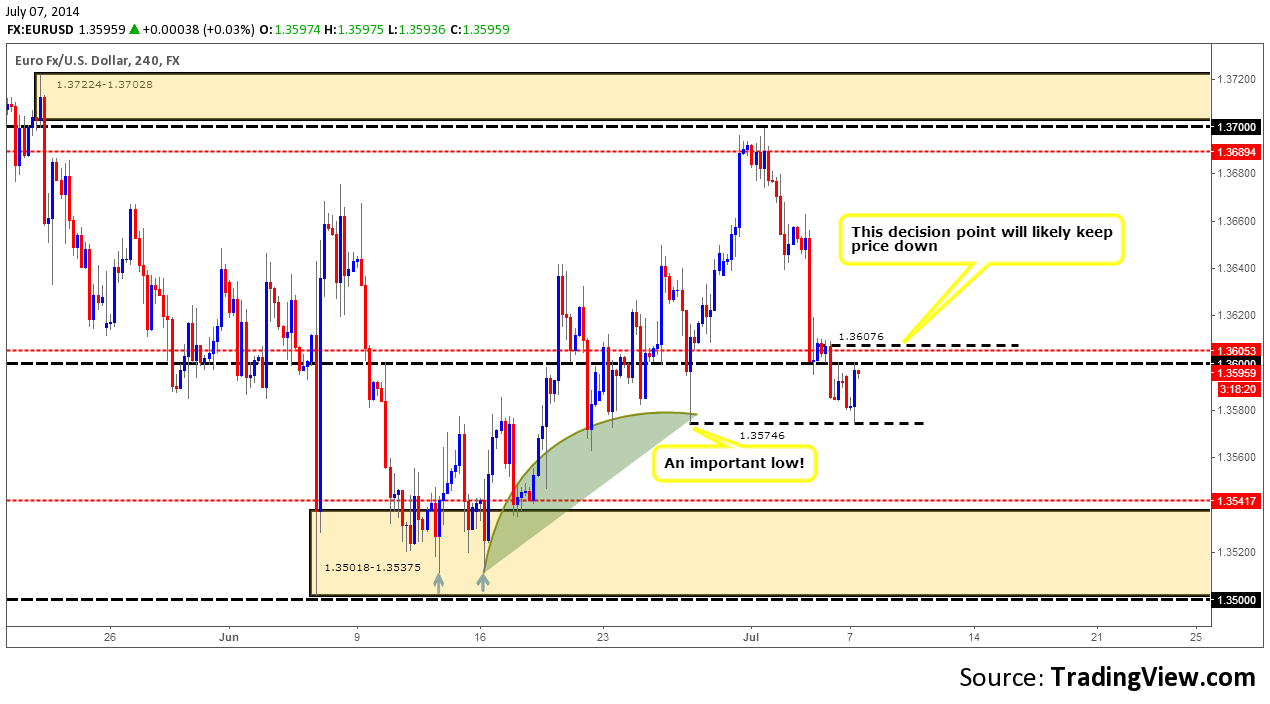
The market opened on Monday a little higher than Friday’s close (1.35921) at 1.35946. It was reported in the last analysis that if the round number 1.36000 proves itself, we may well see a touch at the low 1.35746. This did indeed happen with the sellers seen pushing price down to the aforementioned low, only to see a to-the-pip bullish reaction.

Price is now contained between the round number 1.36000 and the low mentioned above. Our analysis remains similar to that of the last: [I]a positive break below of the low could see prices dropping all the way to 4hr demand at 1.35018-1.35375 sometime early this week. The reason being is that most of the demand/buyers have already been consumed. Take a look at the arc pattern on the chart; can you see the tails that spike down as price continued to rally? This is more than likely pro money at work clearing the buyers out for a move south later on[/I].

If however we get a break above the round number 1.36000, price would very likely test the decision point level above at 1.36076 which will possibly send price south once again. On the other hand, the round number and decision point level could make a nice fake out area for pro money. One can only imagine how many sellers’ stops and break out buy orders are lurking around this area, pro money know this (liquidity = buy orders for pros to sell into), and at the same time, they very likely see the same decision point above it, so we may see a fakeout above the round number into the decision point level sometime today.
[B]Pending/P.A confirmation orders:[/B]

[ul]
[li][B]No pending buy orders [/B](Green line) are seen in the current market environment.[/li][li][B]P.A confirmation buy orders [/B](Red line) are seen just above demand (1.35018-1.35375) at 1.35417. The reason behind us placing a P.A confirmation buy order here, rather than a pending buy order is because the aforementioned demand area appears weak as deep spikes have been seen recently (marked with two arrows).[/li][li][B]No pending sell orders [/B](Green line) are seen in the current market environment.[/li][li][B]P.A confirmation sell orders [/B](Red line) are seen just below supply (1.37224-1.37028) at 1.36894. A P.A.C order was selected here due to the reaction seen at the aforementioned supply area proving its validity. However, pro money may well decide to push price higher into this supply area if/when price returns to it, thus making it a risky trade for a stop above the high 1.36995 which could be very easily be stopped out if a pending sell order was set, hence the need to wait for confirmation.[/li][li][B]New P.A confirmation sell orders [/B](Red line) are seen just below the decision point level (1.36076) at 1.36053. The reason a P.A confirmation sell order was used here is simply because these psychological levels are, as most traders already know, prone to deep tests/spikes, hence the need to wait for confirmation.[/li][/ul]


[B]Quick Recap:[/B]
On the 4hr timeframe, price is seen trading in between the round number 1.36000 and the all-important low at 1.35746. A break above the round number could very well see price testing the decision point level above at 1.36076 where we now have a P.A confirmation sell order set at 1.36053. Conversely, a break below the low at 1.35746 could force price to test the 4hr demand area below at 1.35018-1.35375. Sometime soon, price will likely fakeout above the round number hitting our decision point level (levels above) before dropping back towards the low mentioned above, and filling our P.A confirmation sell order (levels above) in the process.

[ul]
[li][B]Areas to watch for buy orders:[/B] [B]P.O:[/B] No pending buy orders are seen in the current market environment. [B]P.A.C: [/B]1.35417 (SL: Dependent on price action after the level has been confirmed TP: Dependent on approaching price action after the level has been confirmed).[/li][li][B]Areas to watch for sell orders[/B]: [B]P.O:[/B] No pending sell orders are seen in the current market environment. [B]P.A.C:[/B] 1.36894 (SL: Dependent on price action after the level has been confirmed TP: Dependent on approaching price action after the level has been confirmed) 1.36053 (SL: 1.36121 TP: Dependent on approaching price action after the level has been confirmed).[/li][/ul]

GBP/USD:

[B]Weekly TF:[/B]
A quick reminder of the weekly timeframe shows price is (at the time of writing) trading deep within weekly supply at 1.76297-1.67702.


[B]Daily TF.[/B]
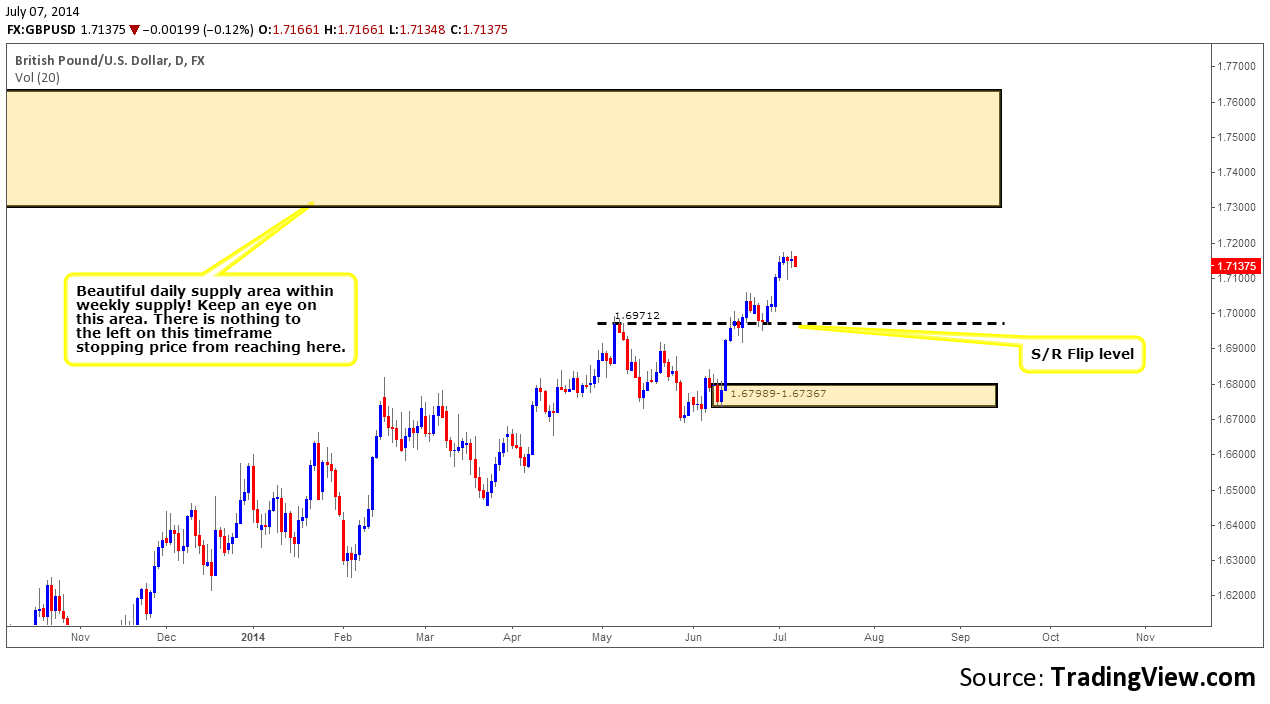
The daily timeframe is currently seen trading between a beautiful daily supply area at 1.76297-1.73024 which is located deep within the weekly supply area mentioned above, and a nice-looking S/R flip level at 1.69712.


[B]4hr TF.[/B]
The market opened just a tad higher than Friday’s close (1.71574) at 1.71661. The sellers then proceeded to take control with very little interest currently being seen by the buyers at the moment.
Technically, price has not changed much since the last analysis, and this is to be expected as Monday’s are notoriously slow! So, much of the last analysis (copied below) still holds true:

[I]Price is currently seen trading between round numbers 1.71000 and 1.72000. A beautiful reaction was seen off of the round number 1.71000, what followed after this was important. Notice the high marked with a flag at 1.71762? Early Friday, price consumed this high with a small wick/spike above it, more than likely stopping out some of the sellers in the process.
[/I]
[I]With the high now clear of some potential supply, logically there is room for price to move above this, to test the round number 1.72000, with the possibility of breaking this level also. A retracement to the round number 1.71000 is not out of the question though, as pro money will require orders to move the market higher, so do be on the lookout for this early sometime time this week.[/I]
[B]Pending/P.A confirmation orders:[/B]

[ul]
[li][B]A pending buy order [/B](Green line) is set just above the round number 1.71000 at 1.71039. A pending buy order is valid here due to the buyers proving this level by consuming sellers around the high (marked with a flag) at 1.71762, thus potentially clearing the path for higher prices, and if a retracement occurs, we will be ready and waiting to enter the market![/li][li][B]P.A confirmation buy orders [/B](Red line) are seen just above demand (1.70617-1.70459) at 1.70662. A reaction north is likely to be seen here as there is no doubt unfilled buy orders left around this area when pro money made the ‘decision’ to push higher. However deep spikes can occur around flip areas (levels above) such as these, hence the need to wait for confirmation.[/li][li][B]No pending sell orders [/B](Green line) are seen in the current market environment.[/li][li][B]No P.A confirmation sell orders [/B](Red line) are seen in the current market environment.[/li][/ul]

[B]Quick Recap:[/B]
Price is still seen deep within weekly supply at 1.76297-1.67702, while on the daily timeframe buyers and sellers are still seen trading between daily supply at 1.76297-1.73024 and the daily S/R flip level below at 1.69712. There was not much action seen on the 4hr timeframe, we still have our pending buy orders set around the round number 1.71000 at 1.71039 in the anticipation of a decline, test and subsequent rally higher to at least the round number 1.72000, and possibly beyond.

[ul]
[li][B]Areas to watch for buy orders:[/B] [B]P.O:[/B] 1.71039 (SL: 1.70870 TP: Dependent on price approach).[B]P.A.C:[/B] 1.70662 (likely to be set at 1.70423 TP: Dependent on approaching price action after the level has been confirmed).[/li][li][B]Areas to watch for sell orders[/B]: [B]P.O: [/B]No pending sell orders seen in the current market environment. [B]P.A.C: [/B]No P.A confirmation sell orders seen in the current market environment.[/li][/ul]

AUD/USD:

[B]Daily TF.[/B]
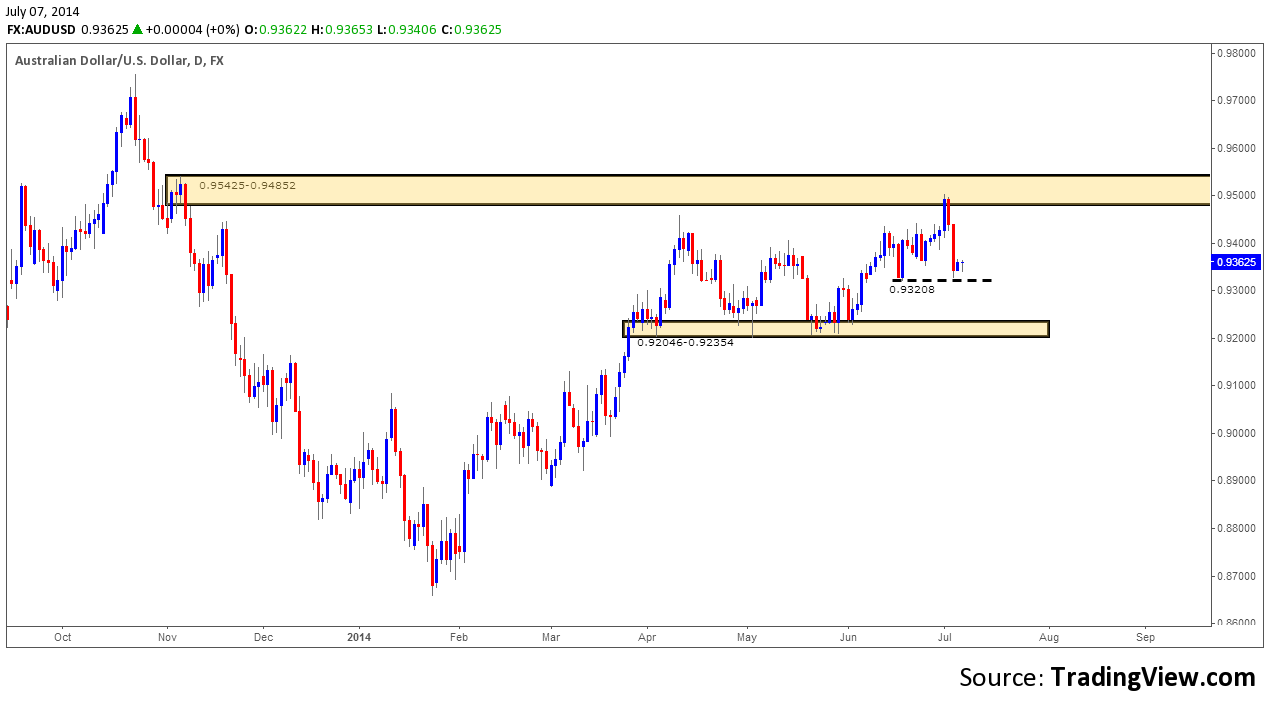
A quick reminder of the daily timeframe shows price stalled around the low 0.93208 where buyers have begun showing a little interest, a break below this low could force price to test the daily demand area below at 0.92046-0.92354.


[B]4hr TF.[/B]
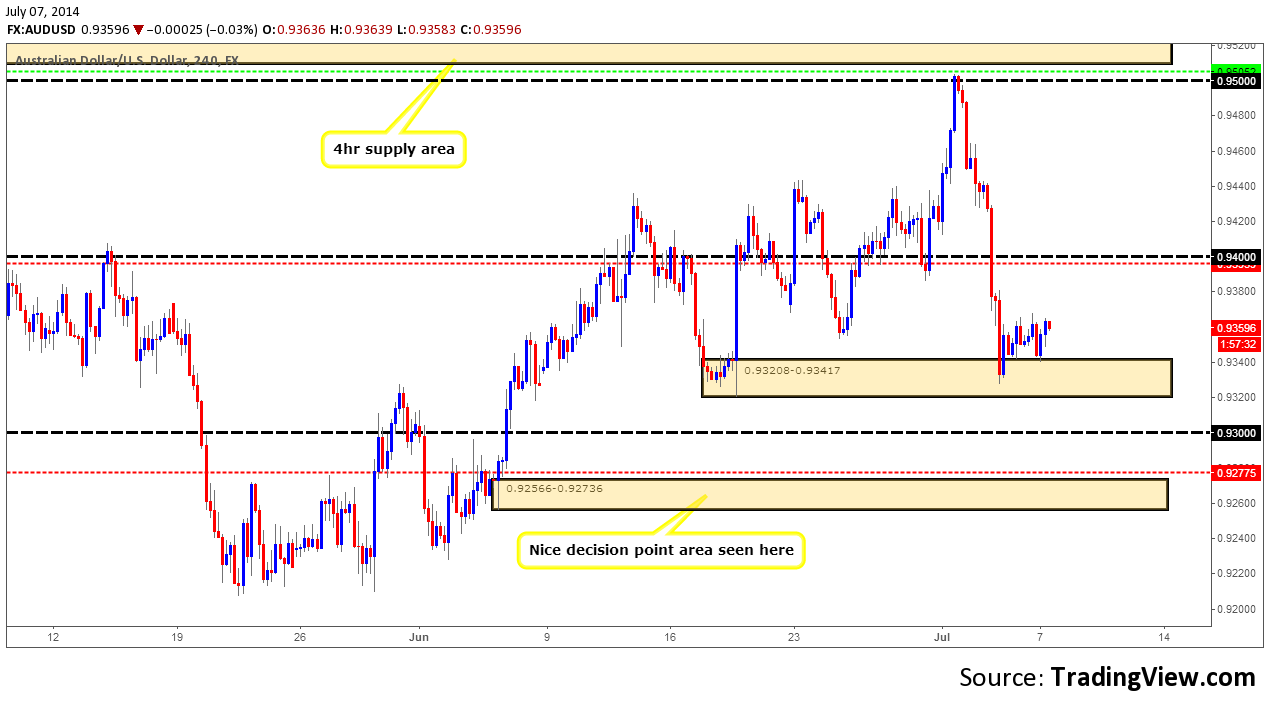
The market opened around Friday’s close at 0.93622, subsequently seeing the sellers take control, pushing price hard into 4hr demand below at 0.93208-0.93417 where a bullish reaction followed.

This is very similar to the last analysis where as if we see a break below the aforementioned 4hr demand area at, we are effectively seeing a break of an important daily low (0.93208). Taking this into consideration, a break below the 4hr demand area above could easily see price testing at least the round number 0.93000 below, with the possibility of price spiking down to the 4hr decision point area at 0.92566-0.92736.

A rally to the round number 0.94000 above should not be discounted as this may very well happen before a break of the 4hr demand area (levels above) is seen, which was also mentioned in the last analysis.

[B]Pending/P.A confirmation orders:[/B]

[ul]
[li][B]No pending buy orders [/B](Green line) are seen in the current market environment.[/li][li][B]P.A confirmation buy orders [/B](Red line) are seen just above the decision point level (0.92566-0.92736) at 0.92775. The reason for placing a P.A confirmation buy order here rather than pending buy order is simply because we are just above a daily demand ‘buy zone’ at 0.92046-0.92354, meaning pro money could very well just ignore this level completely and trade deeper into the aforementioned daily demand area, so, confirmation is the order of the day![/li][li][B]Pending sell orders [/B](Green line) are seen just below supply (0.95425-0.95096) at 0.95052. A pending sell order is placed here due to this being an area where pro money was interested in before; see how close price came to the supply area? (Levels above), this indicates possible strong supply (selling pressure), so the next time price visits we can expect some sort of reaction.[/li][li][B]P.A confirmation sell orders [/B](Red line) are seen just below the round number 094000 at 0.93959. A P.A confirmation sell order was allocated here since this area will likely be the place pro money will rally price to, to collect liquidity, before dropping lower. Placing a pending sell order here could be dangerous as there is no logical area to place your stop loss, and as most traders know, these psychological levels are prone to deep spikes on occasion.[/li][/ul]

[B]Quick Recap:[/B]
Buyers and sellers are seen trading around an important daily low seen at 0.93208. If a break lower is seen we may likely see price testing the extreme daily demand at 0.92046-0.92354. The open saw the sellers take full control hammering price down to 4hr demand at 0.93208-0.93417, this selling pressure did not last long though as the buyers quickly took back the reigns! Considering we are at 4hr and daily demand (levels above), the buying interest is not exactly convincing! So, a break below will likely occur sometime today or tomorrow, do be aware though, price may spike up to the round number 0.94000 triggering our P.A confirmation sell order set at 0.93959, before a break lower is seen.

[ul]
[li][B]Areas to watch for buy orders:[/B] [B]P.O: [/B]No pending buy orders seen in the current market environment. [B]P.A.C:[/B] 0.92775 (SL: Dependent on price action after the level has been confirmed TP: Dependent on approaching price action after the level has been confirmed).[/li][li][B]Areas to watch for sell orders[/B]: [B]P.O:[/B] 0.95052 (SL: 0.95467 TP: Depending on price approach).[B]P.A.C:[/B] 0.93959 (SL: Dependent on price action after the level has been confirmed TP: Dependent on approaching price action after the level has been confirmed).[/li][/ul]