Tariffs and Export Controls Reignite US-China Trade Tensions
Trump Doubles Tariffs on Steel and Aluminum
On Tuesday, President Trump signed a proclamation to double tariffs on imported steel and aluminum from 25% to 50%, citing national security concerns. The new tariffs take effect Wednesday and reflect Trump’s ongoing push to reduce US reliance on foreign metal imports.
According to Trump, the increased tariffs aim to boost domestic production and protect American steelmakers from what he calls “national security” threats. However, this move has alarmed multiple industries, especially manufacturers that heavily rely on imported metals.
For these businesses, raw material costs are likely to surge. As a result, companies may be forced to raise prices, delay production, trim profit margins, cut jobs, or scale back investments.
The immediate market reaction reveals fears of cost-push inflation and a potential deterioration in global trade relations.
China’s Rare Earth Export Restrictions
At the same time, China’s latest export restrictions on critical minerals are hitting global manufacturers. In April, China suspended exports of several rare earth materials vital to EV batteries, semiconductors, aerospace parts, and military production.
China, which dominates the global rare earth supply chain, has intensified already strained global supply networks with these curbs.
Automakers worldwide—particularly in the US, Europe, and Japan—are voicing concerns about possible delays or factory shutdowns. Industry associations warn that without swift identification of alternative suppliers or diplomatic solutions, production disruptions may affect several strategic sectors.
Broader Implications: A Trade War Again?
The US’s move to increase tariffs and China’s export restrictions highlight the fragility of US-China trade relations. Although both nations signed a trade deal in May, these new actions indicate that tensions remain unresolved.
Senior US officials suggest that President Trump and President Xi may soon meet to address the escalating friction.
However, China insists that the US must first create the necessary conditions for bilateral relations to return to a “correct path.” While high-level talks remain a possibility, the risk of another trade war cannot be ruled out.
Market Reaction: Gold Surges to One-Month High
Gold, a traditional safe haven, has rallied sharply over the past two days, hitting its highest level in a month amid growing concerns about global trade tensions.
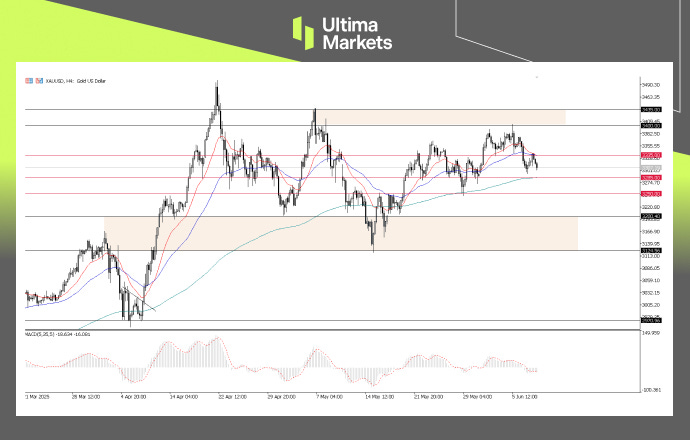
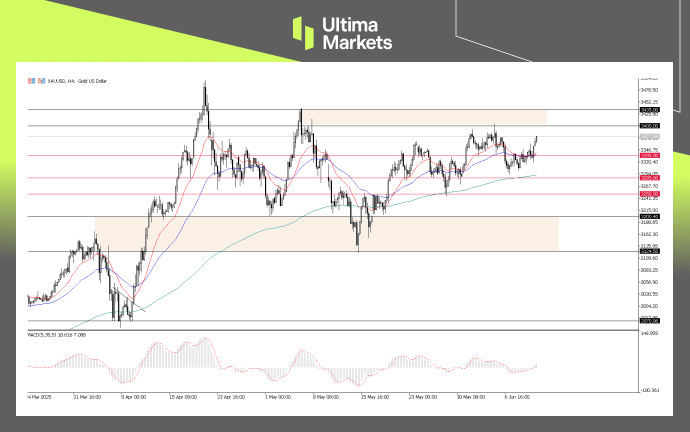
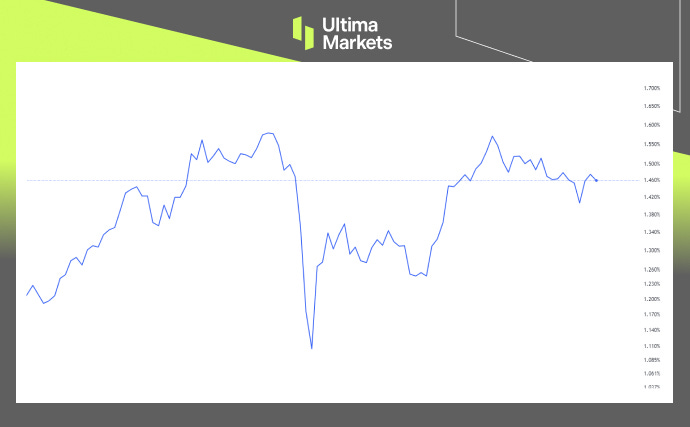
XAUUSD 4-Hour Chart Analysis | Source: Ultima Market MT5
From a technical perspective, gold has broken above the resistance level near 3355 and reached a new high earlier this week. If prices remain firm above this level, further short-term upside is possible.
That said, gold remains within a broad consolidation range. Unless trade tensions significantly escalate, prices may continue to fluctuate sideways.
Author:Joshen Stephen|Senior Market Analyst at Ultima Markets
Disclaimer
Comments, news, research, analysis, price, and all information contained in this article are for informational purposes only and do not constitute investment advice. Ultima Markets has taken reasonable measures to ensure data accuracy, but makes no guarantee and may revise the information at any time without notice. Ultima Markets shall not be held liable for any loss or damage, including but not limited to lost profits, arising directly or indirectly from the use of or reliance on such information.


.jpg")