Bitcoin struggles to escape short pressure ahead of Fed meeting
Bitcoin (BTCUSD) price entered a tight range after a sharp decline, with market sentiment appearing hesitant ahead of the Federal Reserve’s upcoming meeting. While the stochastic indicator suggests selling pressure may be easing, suggesting a potential rebound in the short term, bearish forces appear to be back in control.
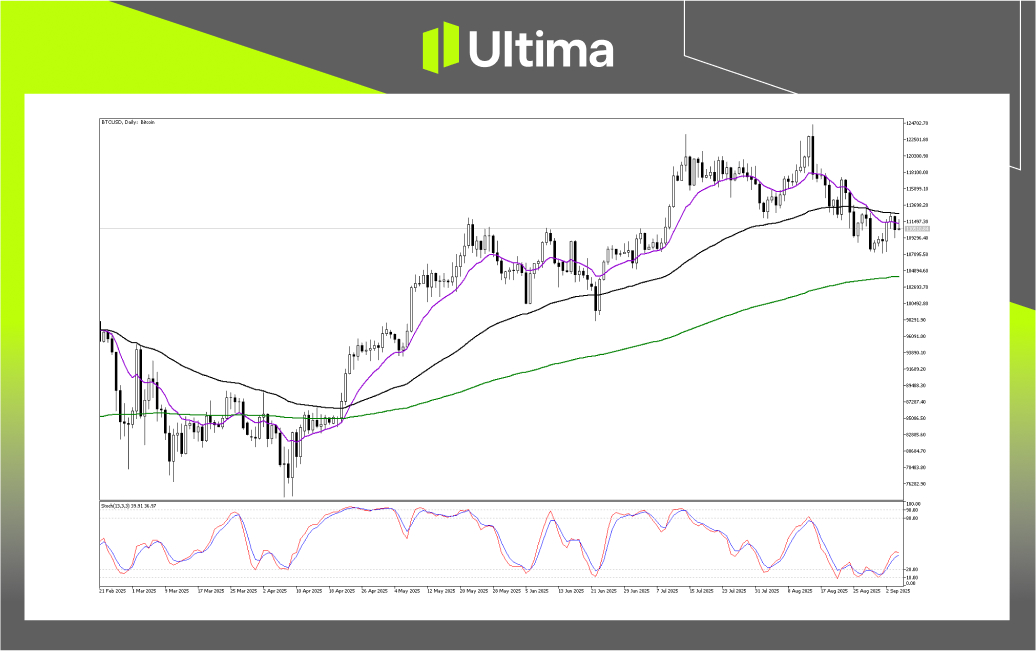
Daily chart technical analysis
Looking at the daily chart, Bitcoin’s price is now in a narrow consolidation range after a sharp drop.
- Key Support Levels : The main support level (S2) is located near 103,500 , which coincides with a rising long-term moving average. A break below this level would seriously undermine the validity of the long-term uptrend. Furthermore, the short-term support level (S1) is located near 107,000 , which marks the low of the recent correction.

Image Location: BTCUSD daily chart, source: Ultima Markets MT5
2-hour chart analysis and breakout scenarios
Looking at the 2-hour chart, Bitcoin’s price fell sharply after being rejected by resistance, breaking below the short- and medium-term moving averages. This suggests that sellers have regained control of the market. The stochastic indicator has also turned downward from its mid-level, suggesting that bullish momentum has faded while bearish momentum is building.
- Bearish Scenario : A sustained breakout and close below the immediate support level of 107,600 would confirm the continuation of the downtrend, a high-probability bearish breakout scenario. This could signal a move towards the next major support level of 105,000 or even lower.
- Bullish Scenario : For a bullish reversal to be credible, buyers must first reclaim the immediate resistance level around 110,750 , but a true shift in momentum would require a decisive breakout and close above 112,000 . However, the probability of such a bullish breakout is low.
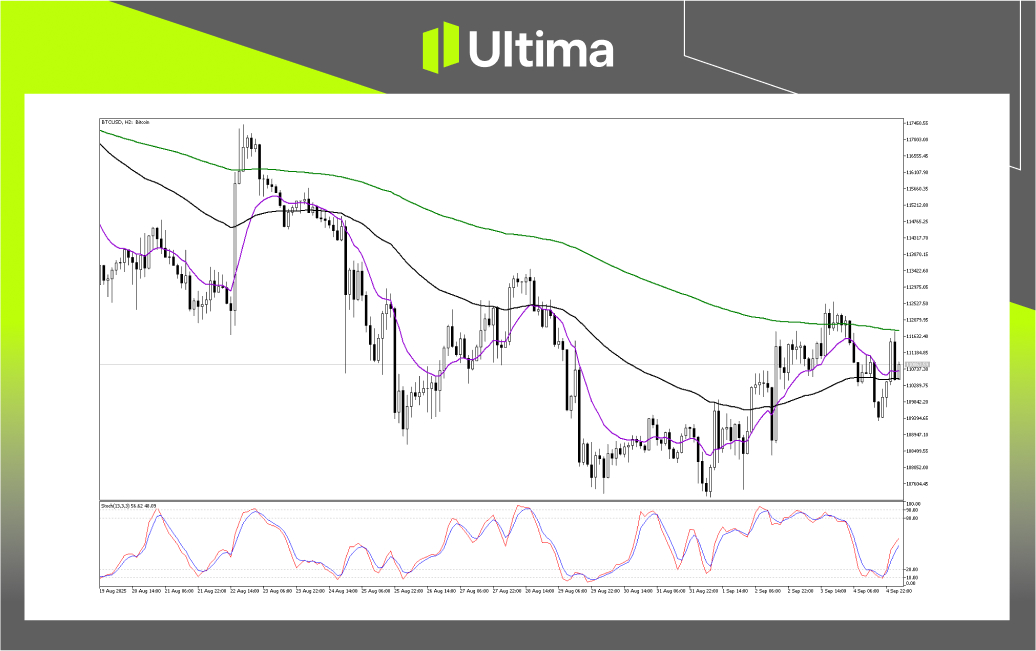
Image Location: BTCUSD 2-hour chart, source: Ultima Markets MT5

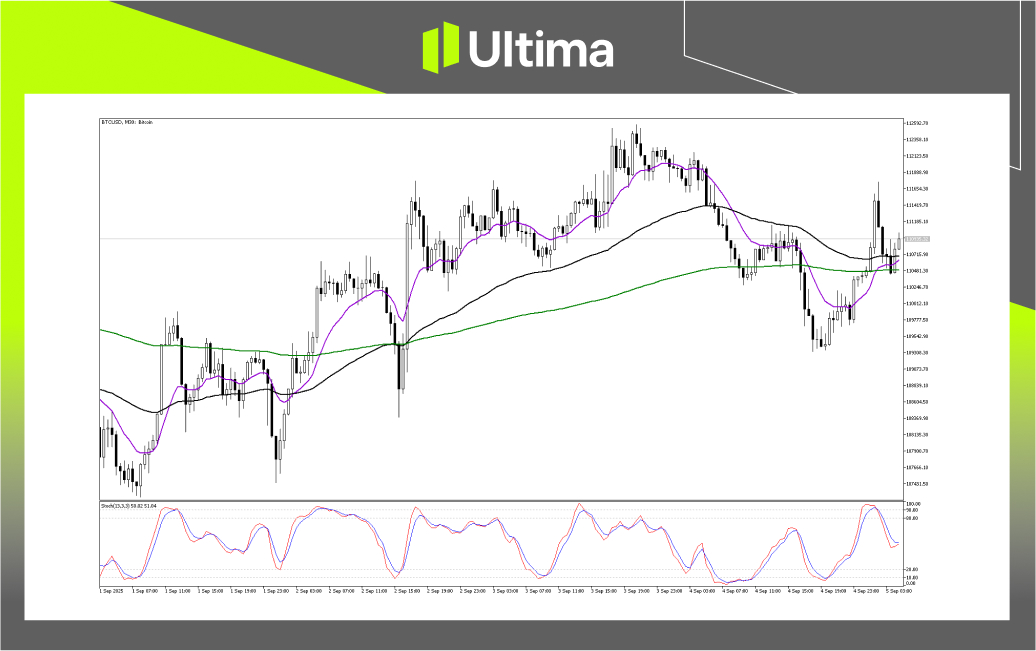
Hub line indicator analysis
Currently, the market is trading sideways at the confluence of the moving averages, and the short-term trend is neutral.
- Bullish Breakout : If the price can sustain above the moving average confluence at 110,600 and decisively break above the immediate resistance at 111,200 , it will signal the resumption of the recovery.
- Bearish Breakout : If the price eventually closes below the critical support at 110,400 , it will indicate a failure of the bullish recovery and bears will take control, putting 109,300 at immediate risk.

Image Location: BTCUSD 30-minute chart, source: Ultima Markets MT5
Risk Warning : Trading leveraged derivatives carries a high level of risk and may result in capital loss. Before trading, carefully consider your investment objectives, level of experience, and risk tolerance. If you are unsure, seek advice from a professional financial advisor.
Author:Joshen Stephen|Senior Market Analyst at Ultima Markets
Disclaimer : The comments, news, research, analysis, prices and other information contained in this article are general market information only and are intended to help readers understand the market situation and do not constitute any investment advice.