The Euro Zone’s Producer Price Index (PPI) figures for June disappointed and signaling deflation remains an issue in Europe, as monthly basis, the index fell 0.1% compared to previous 0.0%. Yearly basis, it met expectations falling 2.2% compared to May reading of -2.0%.
In the US, Factory Orders surged in June, driven by a big gain in commercial airplanes, up 1.8% in the month, but economic optimism slipped 2.5% in August, posting a reading of 46.9, below the past 12-month average.
The dollar turned sharply higher in the American afternoon, following Atlanta’s FED President Dennis Lockhart pledging for a September lift off in rates, unless “significant deterioration” in data occur.
The EUR/USD pair, which was contained by the 1.1000 level, sunk to fresh lows below the 1.0900 level, and even extended below the past week low of 1.0892, and maintains a strong bearish momentum in the short term by the end of the US session, with the 1 hour chart showing that the technical indicators head sharply lower below their mid-lines, and that the price has accelerated well below it moving averages, having been unable to advance beyond the 100 SMA.

In the 4 hours chart the technical picture is also strong bearish, albeit the pair may hover around the current level and even bounce some before extending its decline. A break below 1.0860 should see the pair extending its decline this Wednesday towards the 1.0800/20 price zone, where buying interest has been containing the downside since late May.
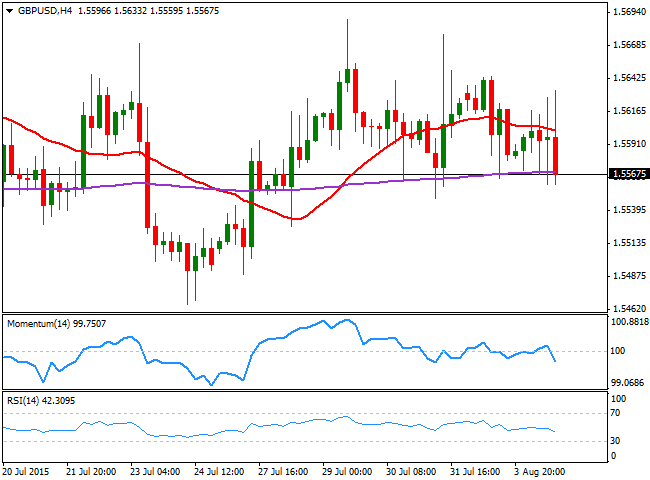
Meanwhile the GBP/USD pair has been trading in quite a limited range since the week started, with buying interest surging around 1.5560 and sellers aligned in the 1.5630/40 price zone. The pair tested the base of the range a couple of times this Tuesday, dragged lower early in the European session after the UK Construction PMI unexpectedly slowed in July, printing 57.1 and retreating from a 4-month high of 58.1 in June.

The pair bounced again from the level with the release of the US data, but and points to break below it following FED’s Lockhart comments on rates, as the 1 hour chart shows that the technical indicators have extended to lower lows, maintaining their strong bearish slopes in negative territory. In the 4 hours chart, the price is struggling around a horizontal 20 SMA, whilst the technical indicators have turned lower around their mid-lines, still unable to confirm additional declines. In this last chart, the price has failed to establish above a now bearish 20 SMA ever since the day started, inclining the balance towards the downside for the upcoming hours.


