The last time I analyzed DataDog was in August of 2020. At the time, I was favouring further upside to take place before possibly experiencing a large pullback to correct the cycle from 2019 low. Real quick, lets refresh on what Data Dog does:
“Datadog helps developers and operations teams see their full infrastructure – cloud, servers, apps, services, metrics, and more – all in one place. This includes real-time interactive dashboards that can be customized to a team’s specific needs, full-text search capabilities for metrics and events, sharing and discussion tools so teams can collaborate using the insights they surface, targeted alerts for critical issues, and API access to accommodate unique infrastructures.
Datadog also integrates with various cloud, enterprise, and developer software tools out of the box, so established team workflows will be unchanged and uninterrupted when adopting Datadog’s service.”
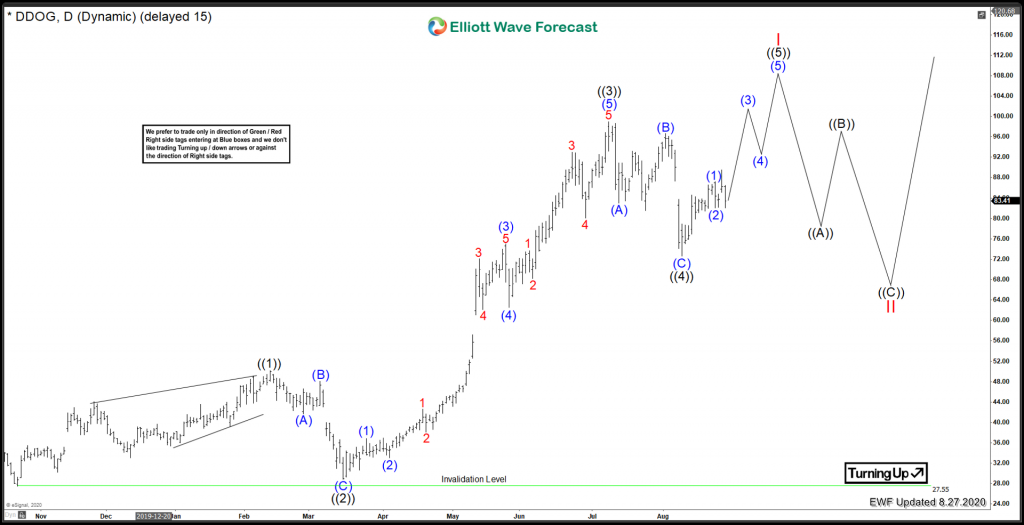
Lets take a look at the Elliottwave view I presented nearly a year ago:
At the time, I was favouring one more high to take place in the cycle from 2019 low. It was getting higher risk to be adding new long term positions into this stock at the time. Fast forward to today:
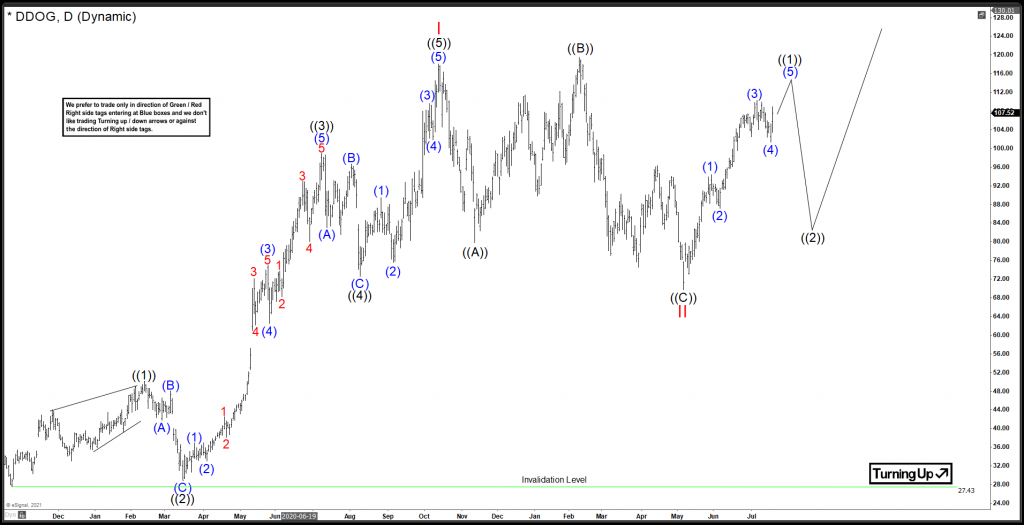
DataDog Elliottwave Daily View July 2021:
As you can see, the correction took place as anticipated. After peaking in October of 2020, the correction has unfolded as an expanded flat correction. After setting a low in May of 2021, the stock has shown an impulsive structure.
From the Red II low set at 69.73 on May 6 2021, the structure has unfolded as an impulsive advance. Right now, one more high is needed at least, before the sequence can be complete. It is favoured that ((1)) is likely to peak in the weeks to come for a ((2)) pullback. Before moving higher again.

