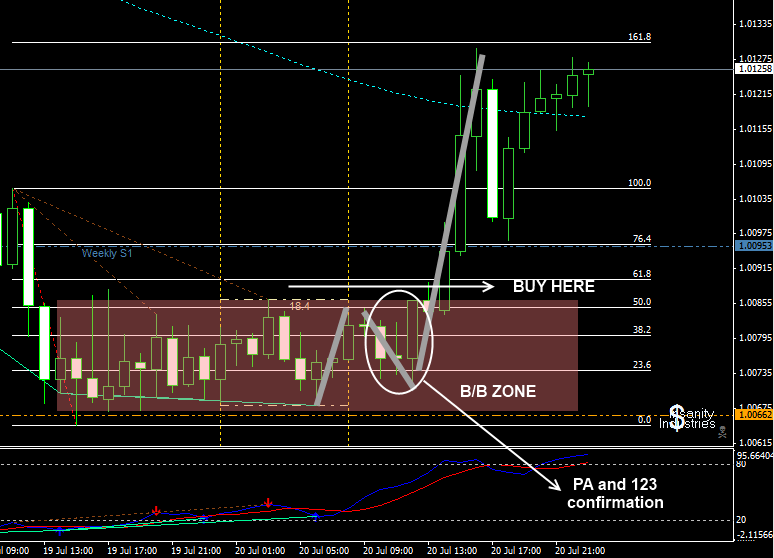
Here you go Pete, this is what I did.
Thanks pipsalots and like joffie you would have got in before the BB zone on a double bottom test of support level…so perhaps BB zones are not as essential for entries or waiting for the price action at BB zones…take this example of the GU bouncing off a tripple resistance level for example…not necessarily where the key SMA/FIB levels meet…
This is the way I am seeing things with David strategy… USD/CAD
Since it is a intraday strat I try to draw my fibs with the day before highs and lows…then look for the congestion/confluence area and wait for PA/divergence/123 confirmation
1 HOUR CHART
http://i1086.photobucket.com/albums/j449/yunny11/eurusd91.png
Just trying to learn  any comments welcome…
its all good david, i just follow the posts then edit them into a pdf and format them, its the best tread i ever came across thank you so much
I Joffie, I will direct this question to you as i do not wanna take up davids time on stuff he answered before. I am a bit confused but i may be right, i am not sure how to make the bbzone, i think i am just using the last major swing high or swing low? then looking for confluance around the 50 fib and so on is that right? thanks joffie
i am making davids stuff in the a un edited word dox or pdf once its current im on page 29 now i will post
i love that only fools and horses plonker, nice one
Hello Yunny1, Am i correct assuming that you are trading the gap ? I mean, the distance between price and the MA’s ? Cause the trade u plotted is against the bias.
From what i’ve read, for a sell, the BB zone should be on high and vice versa for buy.
If you don’t mind, May i know to whom you are directing your post to ?
…yes I can see how they help - thanks pipsalots…
About B/B zones
You are right, gs8888. The trade was against the current bias. I am sure is a plus to trade with the trend. In this case (intraday trade) the MA were not in the daily B/B zone… so I constructed the B/B zone with the most elements that I could… congestion and S/R area and then look for PA/123/divergence to get direction and look for retest of the B/B zone.
Remember I am just learning…  I am sure David will give us some examples next week…
David you do not have to waste your time dealing with skeptics we are here to learn apologies from all of us
Hey Dave,
Hope you’re having a good weekend so far.
I’ve attached a screenshot of options data from IFR, I’m having a hard time figuring out exactly how to decipher it.
There is no historical data to compare to charts, which I think would help immensely, so I am going to take snapshots from this point forward for future backtesting.
Would you be kind enough to answer a few questions I have regarding this?
- How would you interpret and use this data come Monday?
- Is this a complete data set, as far as you can tell?
- If not, What data is missing?
- How important and/or how much do you pay attention to this?
Thanks again!
Charles

No problem buddy, yes makes it easier on the entries, especially when one drills down to the 15 min chart, you will find your RRR improves by putting the S/L just above the Zigzag and one can make a RRR of 1:3 or 1:5 on a good day, all good :59:
oh sorry it should have been attached with post 290 from Mrchilled so sorry
Wellcome to the forum bro,like John the baptist in the bible,a man sent from God,you are a great addition to the house,thanks for the post & God bless.
USD/CAD
Hi David, been rechecking the loonie’s friday close. Price has passed the 100MA and then bounced off the B/B zone.
Chart 1-David’s chart (pg.21 post 207)
Chart 2-1H Fri close
Chart 3-15M 123
Since price and the 100MA are not in the B/B zone together, do we:
- trade the bounce as a short
- wait until price is closes under the 100MA for a short
- wait to see if price retraces to the 100MA and bounces north for a long?
Looking at a 15 min chart we see a 123 pattern with a higher 3 point thus negating a short…
Cheers,
Pete
This is kind of what I was asking about in an earlier post…so did you just add a sell for slightly more than 250 million, and that was enough to make that profit? How much volume did it take to move the price 3 pips? And how does that work, does it make the price go up or down when you sell a bunch? How does the math work on that…why did the other party have to buy to make you a profit? What happens if you sell and then buy back the same lot size at a significant volume to move price, assuming nobody else has any trades happen during that period? Is it BE? So the big banks really do move the price to pro money area to take out stops intentionally (how does taking out stops equate to profit?) then move the market after that retrace to their target?
so thanks David Jefferson !
very helpfull


