In this technical blog, we will look at the past performance of 1 hour Elliott Wave Charts of DAX index. In which, the rally from 28 January 2021 low unfolded as an impulse structure. And showed a higher high sequence with a bullish sequence stamp favored more upside extension to take place. Therefore, we advised members not to sell the index & buy the dips in 3, 7, or 11 swings at the blue box areas. We will explain the structure & forecast below:
DAX 1 Hour Elliott Wave Chart
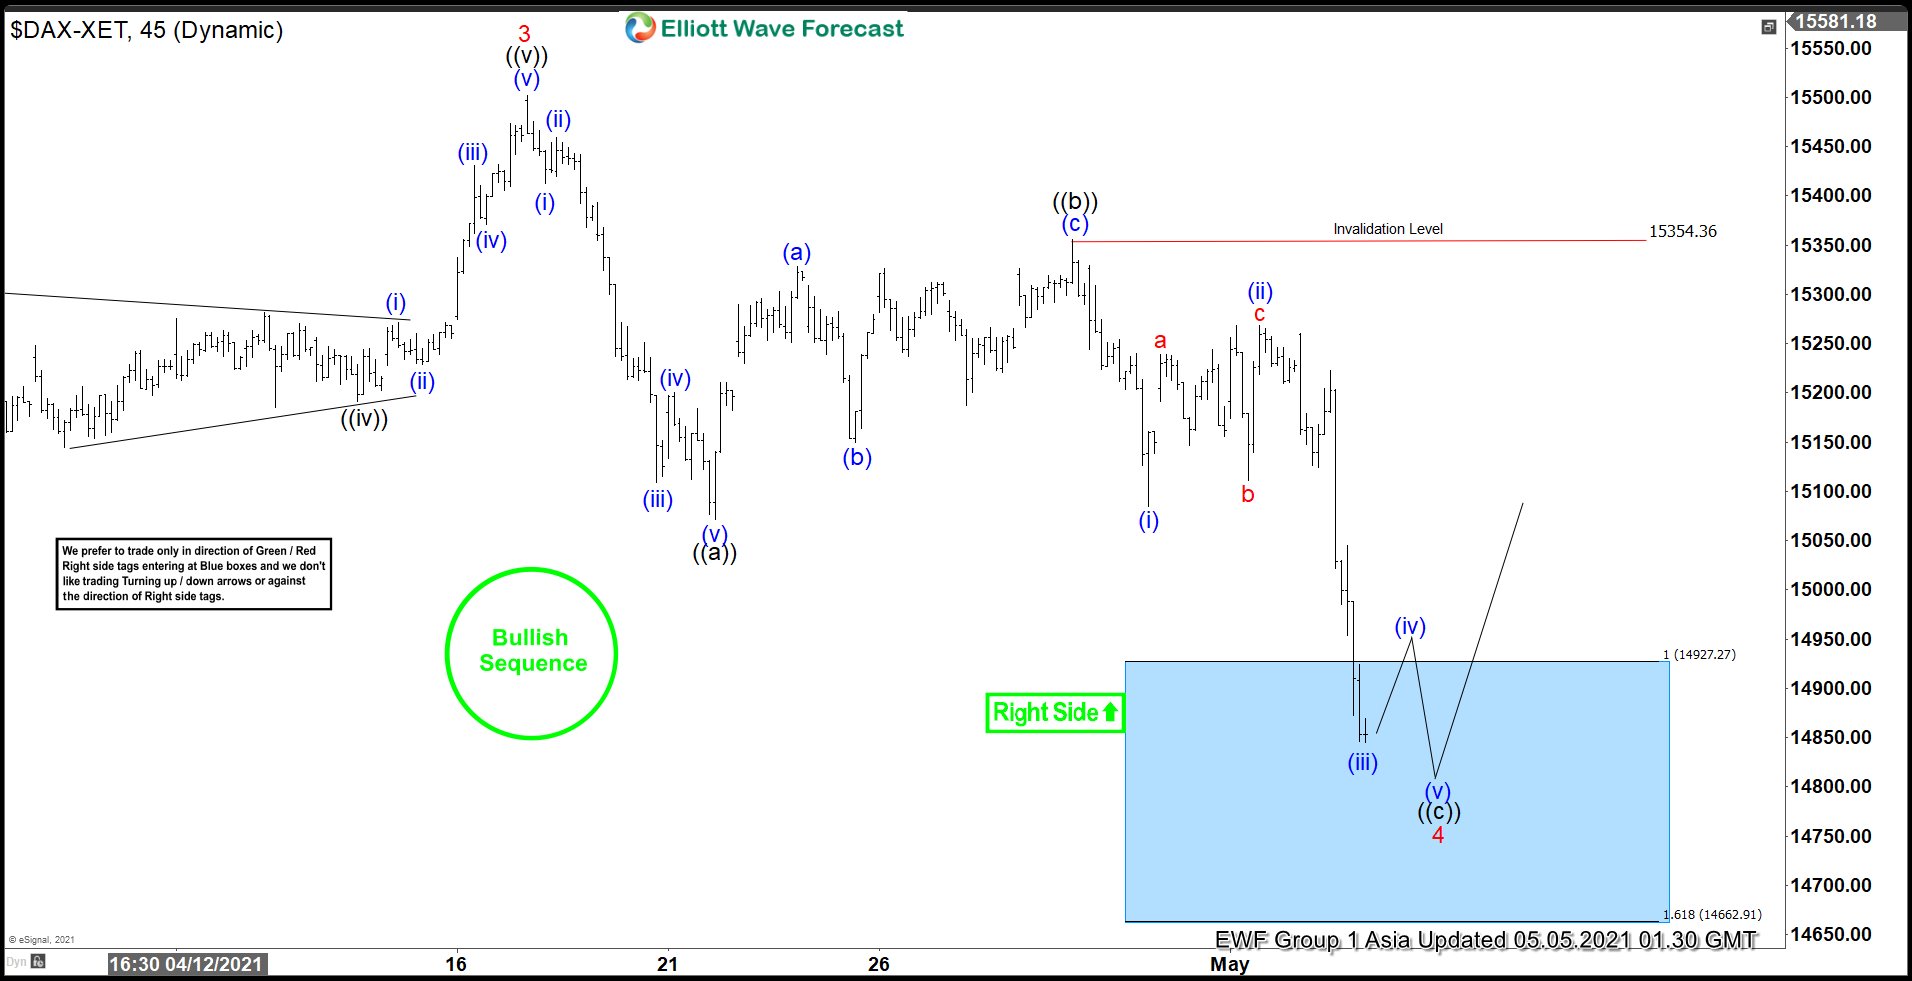
Below is the 1hr Elliott wave chart of DAX from the 5/05/2021 Asia update. In which, the rally to 15501.84 high ended the higher degree wave 3. Down from there, the index corrected lower within wave 4 pullback. The internals of that pullback unfolded as Elliott wave zigzag structure where the first leg of the pullback ended in wave ((a)) at 15071.78 low. While a 3 wave bounce ended wave ((b)) at 15355.28 high.
Then the index started the next leg lower of the pullback in wave (©). And managed to reach the blue box area at 14926.25- 14661.90 100%-161.8% Fibonacci extension area of ((a))-((b)). From there, buyers were expected to appear looking for further upside ideally or for a 3 wave bounce at least.
DAX 1 Hour Elliott Wave Chart
Here’s the 1hr Elliott wave chart of DAX from the 5/07/2021 Midday update. The index is showing a strong reaction higher taking place from the blue box area after ending the zigzag correction at 14836.70 low. Allowed members to create a risk-free position shortly after taking the long positions at the blue box area. However, a break above 15501.84 high still needs to be seen to confirm the next leg higher & avoid double correction lower.
