Deutsche Lufthansa AG Technical Analysis Summary
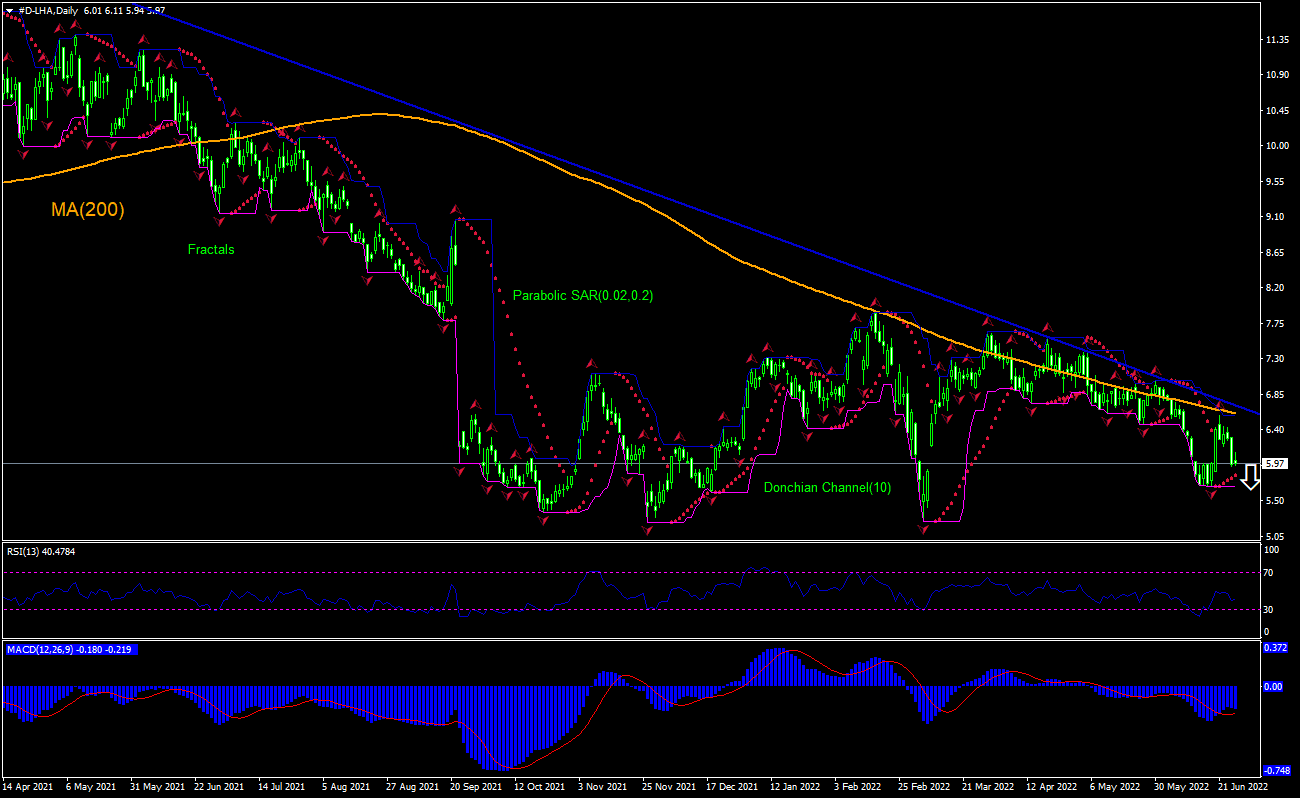
Sell Stop: Below 5.68
Stop Loss: Above 6.58
| Indicator | Signal |
|---|---|
| RSI | Neutral |
| MACD | Sell |
| Donchian Channel | Neutral |
| MA(200) | Sell |
| Fractals | Sell |
| Parabolic SAR | Buy |
Deutsche Lufthansa AG Chart Analysis
Deutsche Lufthansa AG Technical Analysis
The technical analysis of the Lufthansa stock price chart on daily timeframe shows #D-LHA, Daily is falling under the 200-day moving average MA(200) after multiple tests of the moving average. We believe the bearish momentum will continue after the price breaches below the lower boundary of Donchian channel at 5.68. This level can be used as an entry point for placing a pending order to sell. The stop loss can be placed above 6.58. After placing the order, the stop loss is to be moved every day to the next fractal high, following Parabolic indicator signals. Thus, we are changing the expected profit/loss ratio to the breakeven point. If the price meets the stop loss level (6.58) without reaching the order (5.68), we recommend cancelling the order: the market has undergone internal changes which were not taken into account.
Fundamental Analysis of Stocks - Deutsche Lufthansa AG
Lufthansa stock price closed virtually flat after the airline said didn’t expect improvement until 2023. Will the Lufthansa stock price continue retreating?
Deutsche Lufthansa AG is a major German airline. Its market capitalization is €7.19 billion. The stock is trading at P/E ratio (Trailing Twelve Months) of -1.02 currently and the revenue for the trailing twelve months was €19.65 billion, while the Return on Equity (ttm) was -46.03% and Return on Assets (ttm) was -1.96%. The airline said does not expect its global airline operations to return to normal until 2023. Lufthansa announced plans to scrap around 3,000 flights, or some 15% of its capacity, at its hubs in Frankfurt and Munich this summer. Lower capacity utilization means lower revenue expectations which is bearish for stock price.