Deutsche Lufthansa AG Technical Analysis Summary
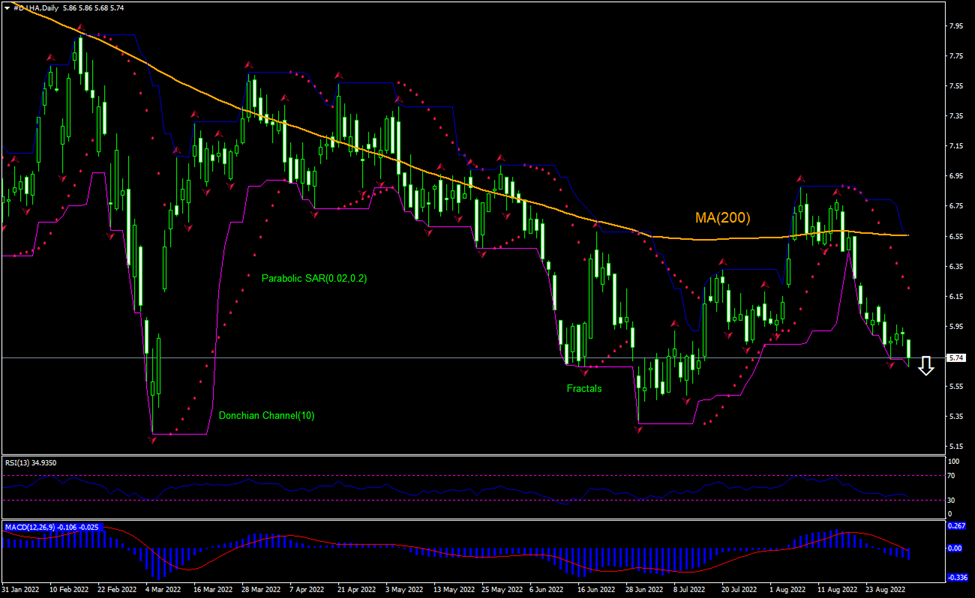
Below 5.68
Sell Stop
Above 6.55
Stop Loss
| Indicator | Signal |
|---|---|
| MACD | Sell |
| Donchian Channel | Sell |
| MA(200) | Sell |
| Fractals | Sell |
| Parabolic SAR | Sell |
| MACD | Sell |
Deutsche Lufthansa AG Chart Analysis
Deutsche Lufthansa AG Technical Analysis
The technical analysis of the Lufthansa stock price chart on daily timeframe shows #D-LHA, Daily is falling under the 200-day moving average MA(200) after breaching above the moving average. We believe the bearish momentum will continue after the price breaches below the lower boundary of Donchian channel at 5.68. This level can be used as an entry point for placing a pending order to sell. The stop loss can be placed above 6.55. After placing the order, the stop loss is to be moved every day to the next fractal high, following Parabolic indicator signals. Thus, we are changing the expected profit/loss ratio to the breakeven point. If the price meets the stop loss level (6.55) without reaching the order (5.68), we recommend cancelling the order: the market has undergone internal changes which were not taken into account.
Fundamental Analysis of Stocks - Deutsche Lufthansa AG
Lufthansa stock price closed 3.1% lower after the airline said flights would be canceled due to pilots’ strike. Will the Lufthansa stock price continue retreating?
Deutsche Lufthansa AG said it will have to cancel 800 flights today, likely affecting 130,000 passengers because of a one-day pilots’ union strike. The Vereinigung Cockpit (VC) pilot’s union said late on Wednesday that pay talks had failed. Lufthansa had offered a total of 900 euros more in basic pay per month in two stages over an 18-month term as well as an agreement guaranteeing cockpit staff a minimum fleet size. VC is demanding a 5.5% pay rise this year for its more than 5,000 pilots and automatic inflation compensation thereafter. Flight cancellations are bearish for airline stock.