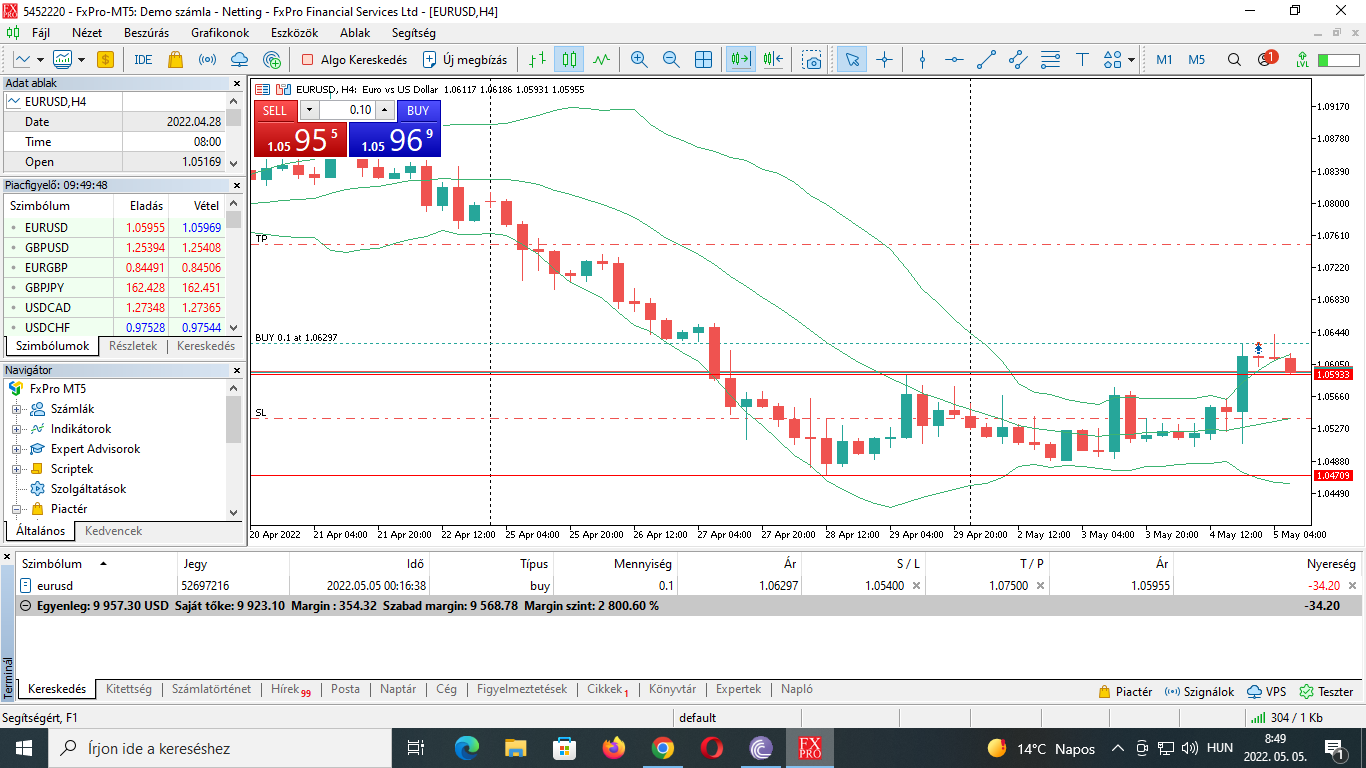
Currently the chart looks like this.
I bought at the close of the big bullish candle, because the price has broken through the resistance level, the Bollinger band and even had three bull candles with growing body, although after that the price began to fall. I hope it’s just retesting the resistance level from the top and will climb back up. What do you think? Fortunately it’s just a demo account.
1 Like
D1 chart shows a consistent downtrend until the last 5 days. Yesterday was a tall and very bullish candle, the preceding 4 were in a tight sideways range. Looking at the 4-day range I would have been bearish so I would have been disappointed to be stopped out by yesterday’s dramatic price rise.
But a dramatic counter-trend price change is always likely to be followed by at least an attempt to resume the trend. I’m going to say the reasoning behind the buy is still good, so although price has started to move against you for me it has not confirmed the downtrend resumption. Do you see any TA reasons that should cause you to exit right now?
1 Like
There are some indicators, like stochastic that tells that EURUSD is already overbought, but for example RSI does not. That’s why I’m a bit uncertain, but we’ll see how it goes…  I’ll probably not exit just now. BTW that was my reasoning for the days before as well, I was waiting for a sign one way or another.
1 Like
Two indicators gauging similar characteristics using the same data will often conflict, especially in times of market flux, just when you need clarity most urgently. If you want certainty in determining what to do, drop one. Over the long term, it probably doesn’t matter which.
Indicators are there to tell you what you should do, not to tell you what the market should do.
I don’t mean to be critical, I hope this is a helpful pointer.
2 Likes
Good post and interesting. I think you entered a trade too early while in a possible consolidation range. To trade against the long-term trend is always risky, especially in current markets. On my Daily chart most - but not all - my signals still remain bearish, which tells me it’s undecided, and I would wait for a clear movement.
Personally, I would always sell if below the 200SMA on the Daily chart - which is the major banks and financial institutions position guide. IMO,swing trading against the 200SMA trend is not a long term profitability strategy.
Cheers.
2 Likes
Your not only learning set up s ,but also that trading imbigous too all part of the learning
1 Like
Personally I see price has closed in a gap in price and expect it to drop