@petrogold - Thanks for the well wishes. While I’ve gotten used to looking at charts the past year I’ve always felt comfortable looking at data on spreadsheets. Indicators, to me, quantify PA in numerical terms. I don’t shy away from using PA. I just don’t rely on it solely. Tend to use it as a further confirmation for entries/exits.
Journal
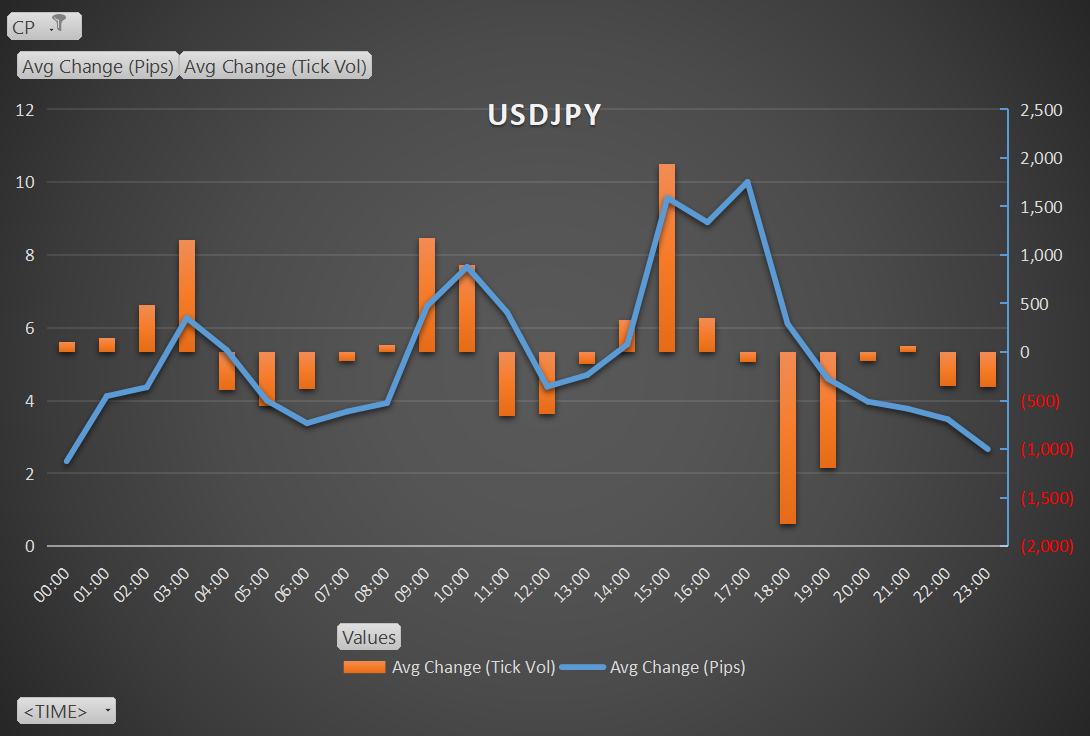
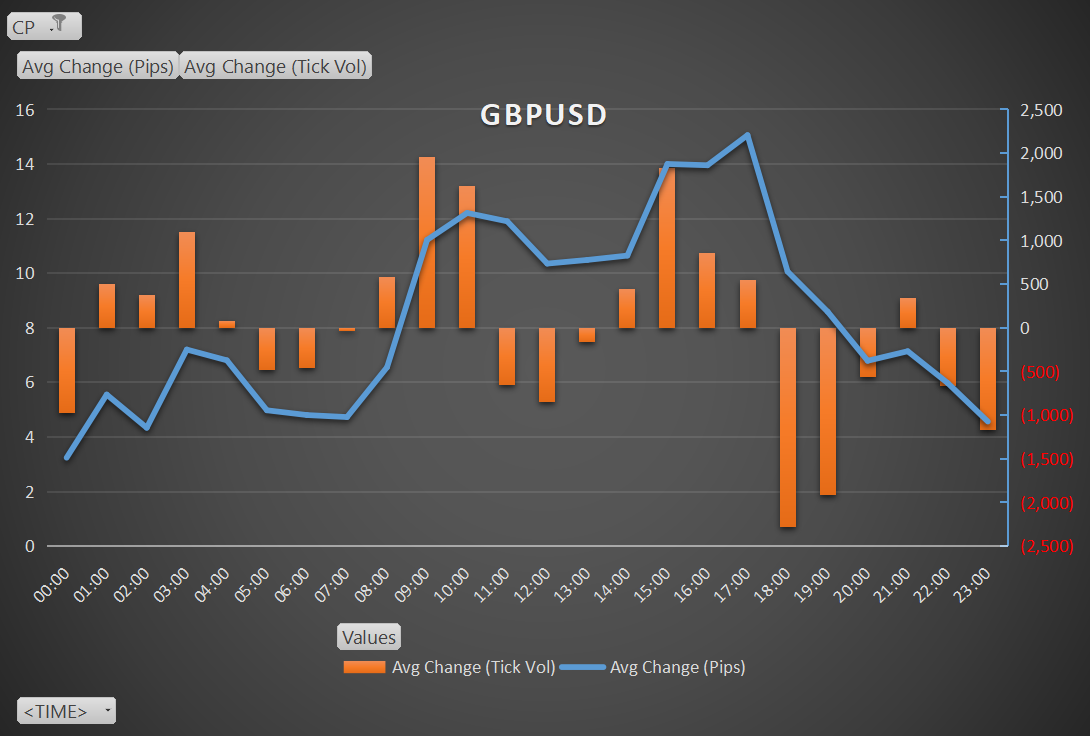
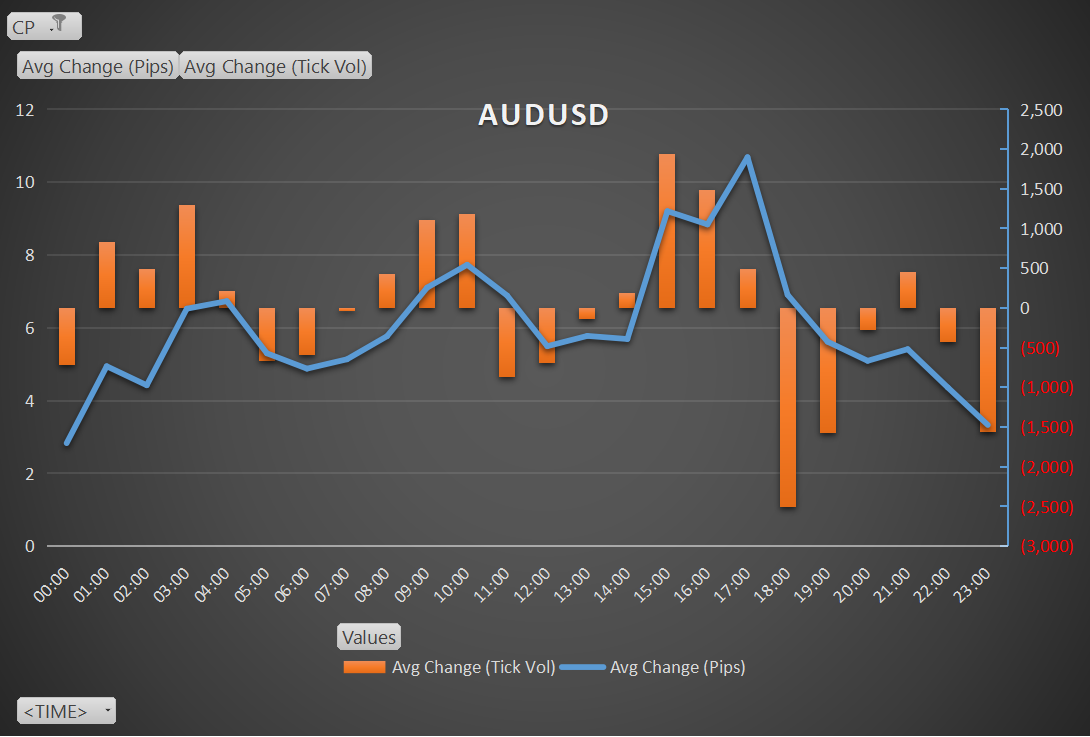
Decided to take a break from staring at the D1 charts and attempted to code something in MQL5 (incomplete). Also thought I’d look at the H1 data for all the US pairs to get a better idea about the hourly activity because I’ve never really paid heed to the TYO session. Only spent time on the LON and NYC sessions. Wanted to know if I was being an idiot.
Charts show an average change in pip values and tick volumes for Calendar Year 2021 by hour. Times are in GMT+2 (MQL5), which translates to the following session times:
- TYO = 0100 - 1200
- LON = 0900 - 1800
- NYC = 1400 - 2200
Notes:
1. Tick volume is according to liquidity provider against my broker. May not be an accurate representation of tick data for all LPs out there.
2. DST isn’t taken into account. I’ve never lived with DST and calculating it confuses me & gives me headaches. So there might be a +1hr skew for a portion of the data.
3. Certain months traditionally have had more activity than others so there could be greater deviations in certain months.